A Technique for Separating the Gravitational Torques of Bars and Spirals in Disk Galaxies
Abstract
We describe a Fourier-based method of separating bars from spirals in near-infrared images. The method takes advantage of the fact that a bar is typically a feature with a relatively fixed position angle, and uses the simple assumption that the relative Fourier amplitudes due to the bar decline with radius past a maximum in the same or a similar manner as they rose to that maximum. With such an assumption, the bar can be extrapolated into the spiral region and removed from an image, leaving just the spiral and the axisymmetric background disk light. We refer to such a bar-subtracted image as the ”spiral plus disk” image. The axisymmetric background (Fourier index =0 image) can then be added back to the bar image to give the ”bar plus disk” image. The procedure allows us to estimate the maximum gravitational torque per unit mass per unit square of the circular speed for the bar and spiral forcing separately, parameters which quantitatively define the bar strength and the spiral strength following the recent study of Buta & Block. For the first time, we are able to measure the torques generated by spiral arms alone, and we can now define spiral torque classes, in the same manner as bar torque classes are delineated.
We outline the complete procedure here using a 2.1m image of NGC 6951, a prototypical SAB(rs)bc spiral having an absolute blue magnitude of 21 and a maximum rotation velocity of 230 km s-1. Comparison between a rotation curve predicted from the =0 near-infrared light distribution and an observed rotation curve suggests that NGC 6951 is maximum disk in its bar and main spiral region, implying that our assumption of a constant mass-to-light ratio in our analysis is probably reliable. We justify our assumption on how to make the bar extrapolation using an analysis of NGC 4394, a barred spiral with only weak near-infrared spiral structure, and we justify the number of needed Fourier terms using NGC 1530, one of the most strongly-barred galaxies (bar class 7) known. We also evaluate the main uncertainties in the technique. Allowing for uncertainties in vertical scaleheight, bar extrapolation, sky subtraction, orientation parameters, and the asymmetry in the spiral arms themselves, we estimate =0.280.04 and =0.210.06 for NGC 6951.
1 Introduction
In two previous papers (Buta & Block 2001, hereafter BB01; Block et al. 2001), we outlined a new approach to quantifying the observed bar strengths of galaxies. Instead of relying on deprojected bar ellipticities, we used a theoretical equation (Combes & Sanders 1981) based on the forcing of the bar implied by the near-infrared light distribution. This method, called the relative bar torque, or , method, was applied to 36 galaxies by BB01 and later to nearly 40 more galaxies by Block et al. (2001). The method has also been applied to more than 100 Two Micron All Sky Survey (2MASS) galaxies by Laurikainen, Salo, & Rautiainen (2002) and by Laurikainen & Salo (2002), who also refined the method. Most recently, Block et al. (2002) applied the method to more than 150 galaxies in the Ohio State University Bright Galaxy Survey (OSUBGS, Eskridge et al. 2002) and used the results to show that normal galaxies may double their mass by accretion in 1010 years.
A difficulty with the method as applied in these previous studies is that the bar strengths based on the method could be affected by spiral arm torques. represents the maximum ratio of the tangential force to the mean axisymmetric radial force. If the bar is a typical SB-type bar (rather than an oval), then this maximum will usually be a good approximation to the bar strength and the force ratio map will show a characteristic butterfly pattern (BB01). However, many barred spirals have pronounced spiral arms that break directly from the ends of the bar, and these arms can affect the bar butterfly pattern and increase the apparent bar strength.
The original intent of BB01 was that should measure bar strength, not a combination of bar and spiral arm strength. There are good reasons for trying to find a way to separate the effects of the spiral from the bar. First, if we want to investigate scenarios of bar formation in disk galaxies (e.g., Sellwood 2000), then we should have measures of bar torques, not spiral plus bar torques. Second, with a separation analysis, we can check theoretical predictions that bars with larger torques drive spirals with higher amplitudes (Elmegreen & Elmegreen 1985 and references therein; also see Yuan & Kuo 1997 and references therein).
In this paper, we outline a straightforward method of separating the bars from the spirals using 2.1m near-infrared images. The method uses Fourier techniques in conjunction with a simple assumption of how to extrapolate the bar into the spiral-dominated regions. The method works effectively even for the strongest bars with the strongest spirals. For the first time, we can investigate spiral arm torques in galaxies and even define spiral torque classes in the same manner as BB01 defined bar torque classes.
We illustrate the method using a representative example, the SAB(rs)bc spiral NGC 6951. The image we use is a -short, or , image obtained during a run with the 4.2-m William Herschel Telescope (WHT) in 2001. The image scale is 0.′′24 per pixel and the field of view is 4.′1 square. A total of 15 spiral galaxies was observed for investigating bar and spiral torques. Full details of these observations, and analysis of the remaining galaxies, will be provided in Block et al. (2003, hereafter paper II) where the techniques described in this paper will be applied to examine the relations between bars and spirals.
2 Estimation of Gravitational Torques
The method was fully described in BB01. The dimensionless parameter can be interpreted as the maximum gravitational bar torque per unit mass per unit square of the circular speed. To derive it, we process a near-infrared image by removing all foreground stars, and then deproject the image using available orientation parameters. For NGC 6951, we used a mean position angle and axis ratio based on isophotal ellipse fits on the 2.1m image itself. The values used were = 0.773 and = 143.∘1. These are in good agreement with optical photometric estimates of the same parameters from Márquez & Moles (1993). IRAF routine IMLINTRAN was used for the deprojection. To facilitate our analysis, we have rotated the deprojected image such that the bar axis is horizontal. The bar position angle in the raw deprojected image was measured using ellipse fits, and IRAF routine ROTATE was used for the final rotation.
The deprojected image was then centered within an array of dimension 2n, where =10 for the WHT image, and run through a program which transforms the near-infrared image into a two-dimensional potential (Quillen, Frogel, & González 1994, hereafter QFG). From the 2D potential, planar forces are calculated and then decomposed into radial and tangential components. Our main analysis is based on maps of the ratio of the tangential force to the mean axisymmetric radial force, the latter derived from the =0 component of the potential. We assume a constant mass-to-light ratio, but in addition to the force ratios, we also compute a predicted axisymmetric rotation curve in order to evaluate the correctness of this assumption, especially in the spiral arm regions. We have also made a refinement to our use of the QFG potential method, based on a study by Laurikainen & Salo (2002), who noted that the QFG convolution integral for the vertical dimension included some gravity softening. We use a revised lookup table from H. Salo (private communication) for an exponential vertical density profile without softening. Laurikainen & Salo (2002) showed that the relative bar torques of BB01 are too low by about one bar class because of this softening.
The computation of a potential from a near-infrared image requires a value for the vertical scaleheight, which cannot be directly measured for NGC 6951. In BB01 and Block et al. (2001), it was assumed that all galaxies had the same vertical exponential scaleheight as our Galaxy, = 325pc. However, this approach required knowledge of the distance to each galaxy, which had to be based on radial velocities. Here we derive by scaling a value from the radial scalelength, . As shown by de Grijs (1998), the ratio / (based on mostly -band and some -band surface photometry) depends on Hubble type, being larger for later types compared to earlier types. For NGC 6951, we estimated a radial exponential scalelength using an azimuthally-averaged surface brightness profile. The slope of the outer light profile provides an approximation to a radial scalelength, which we obtained to be = 33′′. From a bulge/disk decomposition of an -band luminosity profile, Márquez & Moles (1993) obtained a disk effective radius of 42.′′76 for NGC 6951, which corresponds to a radial exponential scalelength of 25.′′5. This is in reasonable agreement with our estimate. For an Sbc spiral, de Grijs’s analysis shows that = (62) on average. For a redshift distance of 24.1 Mpc (Tully 1988) for NGC 6951, this gives = 640pc, about twice the Galactic value. The average value of in de Grijs’s sample is 600400pc.
We found it necessary to remove some of the very strong star-forming regions from the near-infrared image of NGC 6951 before the potential was calculated. These objects can cause local maxima or minima in the force ratio maps that may be unreliable if the mass-to-light ratios of these regions differ from the dominant old stellar background. It is well-known that HII regions and luminous red supergiants impact the 2.2m spectral region (e.g., Knapen et al. 1995), and can be locally important at the 33% level (Rhoads 1998).
3 Bar/Spiral Separation: A Fourier Approach
The basic idea of our approach is that the bar is a feature dominated mostly by even Fourier terms in a relatively fixed position angle. We compute the relative Fourier intensity amplitudes , where is an integer index, as a function of radius and make the assumption, when necessary, that the relative bar intensity declines past a maximum in the same or a similar manner as it rises to that maximum. That is, the Fourier amplitudes relative to the axisymmetric background have a single maximum at radius and decline smoothly and roughly symmetrically to either side of this radius. The bar extrapolation involves scaling the sine and cosine amplitudes of the even Fourier terms according to the ratio, , of the =0 amplitudes at symmetric radii . This is essential because the average intensity of the background starlight decreases with increasing radius and because we extrapolate , not alone. As long as the Fourier phases are relatively constant, this scaling is reasonable.
Our assumption about how to make the extrapolations is based on data from mostly pure bar plus disk systems, and on cases where the bar and spiral are well-enough separated that we can differentiate their distinct contributions in plots of and the =2 phase . Ohta, Hamabe, & Wakamatsu (1990) presented relative Fourier amplitudes for six early-type barred systems that showed three characteristics of the relative Fourier amplitudes of bars: (1) strong bars have significant higher order terms, such that even =10 can be important; (2) relative amplitudes rise and then decline past a maximum that lies roughly in the middle of the apparent bar; (3) the radii of the maxima for higher order terms ( = 4, 6, 8, etc.) can shift to slightly larger values compared to = 2. Correct treatment requires that we examine plots of the relative amplitudes of all even Fourier terms used, to evaluate especially effects (2) and (3).
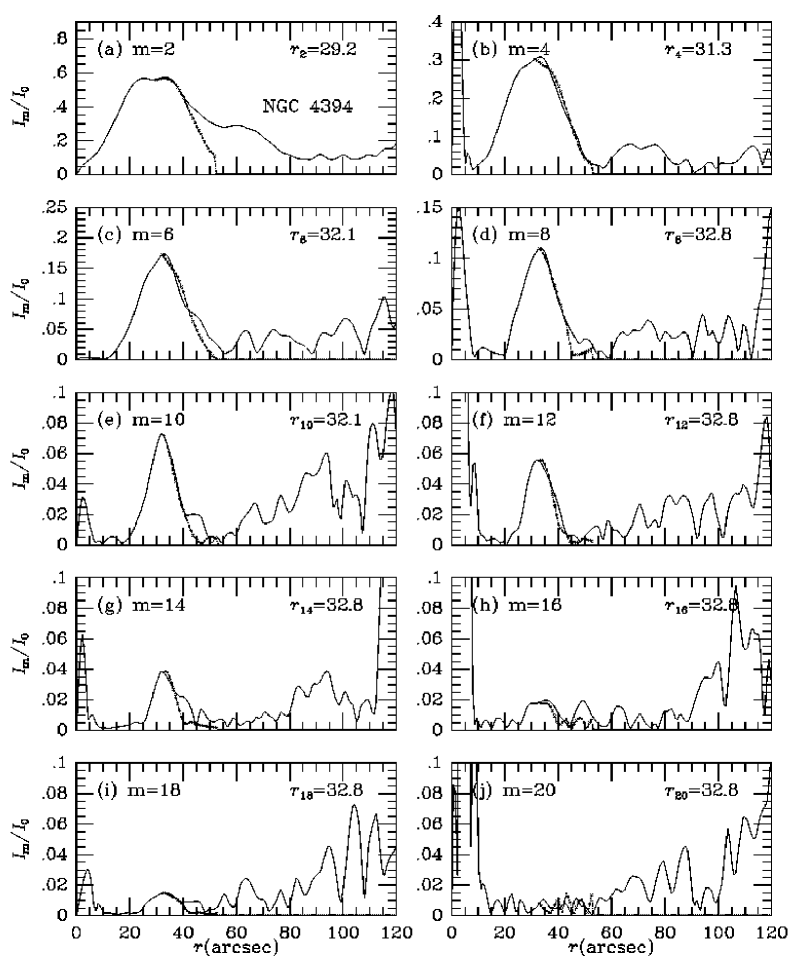
To illustrate these points, we use the galaxy NGC 4394 from the Ohio State University Bright Galaxy Survey (OSUBGS, Eskridge et al. 2002). Even in blue light, the spiral structure of this galaxy is weak, and in the OSUBGS -band image, it is quite subdued. Thus, NGC 4394 can serve as our model case of mostly a bar imbedded in a disk, and we can examine how the relative Fourier amplitudes behave with radius. Figure 1 shows the even relative Fourier amplitudes to =20 for NGC 4394 versus radius based on a deprojected version of the OSUBGS -band image where the bulge has been properly treated with a two-dimensional decomposition (Laurikainen et al. 2003). Each Fourier term shows a well-defined maximum in the bar region. When the relative Fourier intensities are extrapolated past this maximum in the same manner as they rose to that maximum, the extrapolations are seen to be in fairly good agreement with the observed relative intensities. There is weak spiral structure near and outside the ends of the bar, but it contributes little to the higher order terms. Detailed examination of the radius, , of the peak in each plot shows that it increases to slightly larger values with increasing , as expected from point 3 above. The idea, according to Ohta, Hamabe, & Wakamatsu (1990), is that the narrow ends of the bar occur at the largest radii, and will be most evident as a result in the higher-order terms at those larger radii. Finally, the phases of the terms (not shown) are relatively constant throughout the bar. Thus, NGC 4394 demonstrates that our assumption of approximate symmetry for the even Fourier terms as a function of radius for a bar is a fair one.
The symmetry assumption is less evidently correct for the =2 term in NGC 4394. Instead, this term shows a strong asymmetric decline past its maximum. The reason for this difference is that the main bar in NGC 4394 is imbedded in a weak extended oval that has no higher order terms than =2. There is also some weak spiral structure at the ends of the bar. For these reasons, the =2 term in NGC 4394 would have to be extrapolated as shown in Figure 1 to isolate the main bar.
The =10 term in NGC 4394 has a maximum about 13% of the maximum of the =2 term. Thus, it is not really negligible compared to =2, verifying point 2 above. For a very strong bar, such as that in NGC 1530, the =10 term is 19% of the maximum relative amplitude of the =2 term. One should never think naively of a bar as an =2 structure. Only a broad oval is likely to be a pure =2 structure.
Once the Fourier mappings of the bar are determined, the next step in the procedure is to sum the even (2) terms of the light distribution out to a specified radius, where we assume the bar goes to zero; there is also usually an inner radius where the bar is assumed to go to zero. Both of these effects are seen clearly for NGC 4394 in Figure 1, where terms =4 and 6 approach zero near =10′′ and =55′′. Terms =8, 10, and 12 approach zero near =20′′. For most of the even terms in NGC 4394, there appears to be some amplitude inside 10′′ due in part in the finite pixel size (1.′′5). Each Fourier term is treated on an individual basis to allow the radius of the maximum, , to occur at a different position.
The maximum number of Fourier terms we use is based on analysis of NGC 1530, the most strongly barred galaxy in the WHT sample. Using the BB01 approach, NGC 1530 would have been bar class 7. To deduce how many Fourier terms might be needed for a bar/spiral separation analysis in this kind of case, we analyzed NGC 1530 by comparing gravitational torques derived from a full resolution image with those derived from Fourier-smoothed images which cut the terms at =10 and =20. We found that except for the effects of noise, the Fourier-smoothed image with terms to =20 adequately represented the bar and that including higher order terms is not essential. Cutting the analysis at =10 was not sufficient in that case. However, for many galaxies, only the lower-order terms would be needed for a separation analysis, and we allow for the option of cutting the number of terms when appropriate.
4 Illustration of Technique
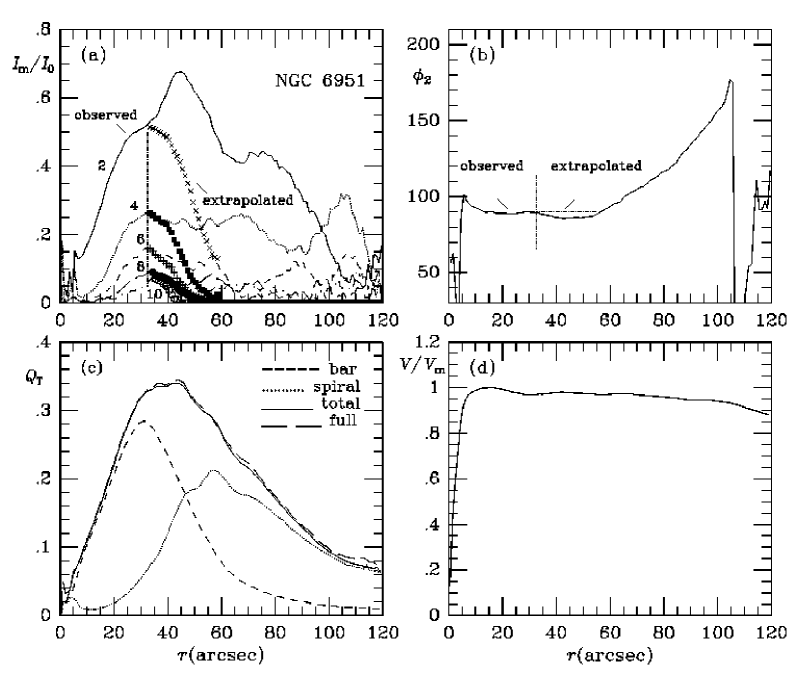
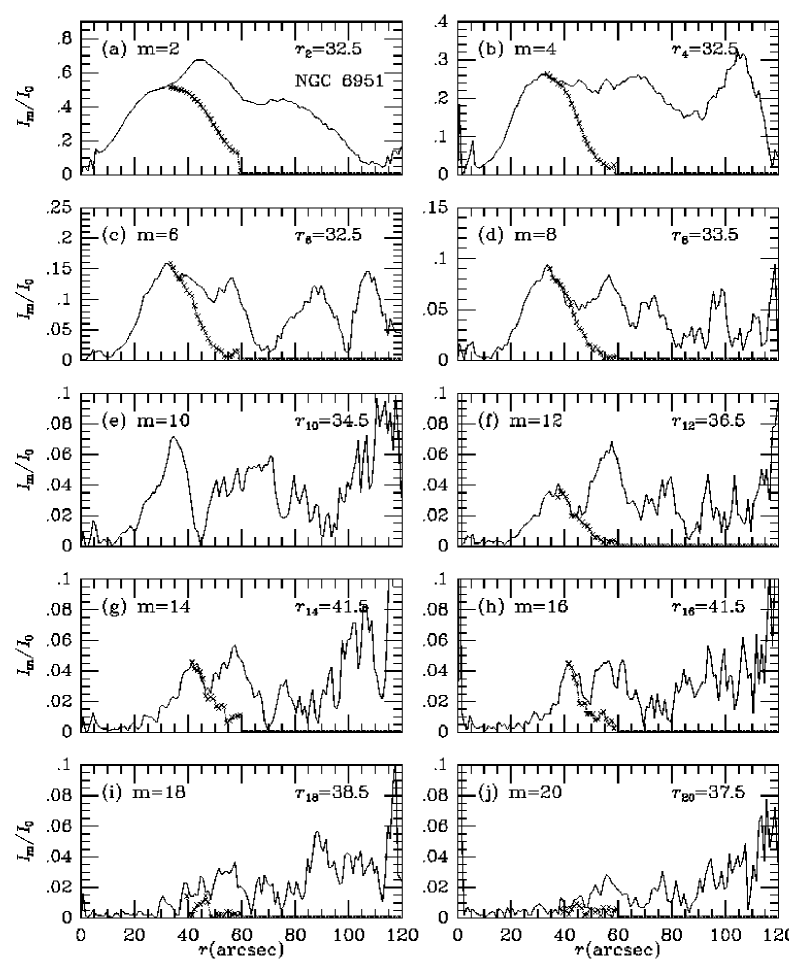
The method is illustrated for NGC 6951 in Figures 2, 3, 4, and 5. NGC 6951 is an ideal test case because it has a well-defined bar, and its spiral structure breaks directly from the ends of this bar. It is a very typical example. In Figure 2a, we show the relative Fourier intensity amplitues for the =2, 4, 6, 8, and 10 components. (Figure 3 shows the relative amplitudes to =20 on a larger scale, as for NGC 4394.) Between radii of 6′′ and 32′′, the bar dominates these amplitudes and we see a smooth rise in most of the terms. Beyond 32′′, the relative =2 amplitude rises to a higher maximum, and the =2 phase decreases slightly and then rises (see Figure 2b). We assume the bar does not end abruptly, but that in the absence of the spiral, the even relative Fourier amplitudes due to the bar decline in the same manner as they rose to the bar maximum, which we took to occur at = 32.′′5. This was chosen because shows a plateau near this radius, and the higher-order terms all show a maximum near or just outside this radius as well. It corresponds to a position approximately in the apparent middle of the bar. We require that the bar still be significant in = 2 at its apparent edge, and allow it drop in relative =2 amplitude sharply thereafter. This extrapolates the bar into the spiral zone (as indicated in Figure 2a). The impact of the choice of is examined in the next section.
For the higher order terms, Figure 3 shows clear maxima between 33′′ and 42′′ that are attributable mainly to the bar. These maxima do appear to shift outwards a little with increasing (especially for 6), as expected from point (3) above. For these terms, we simply reflect the even amplitudes around the apparent radius where the maxima occur, and scale them according to the mean intensity at each radius outside . For NGC 6951, these extrapolations are shown by the crosses in Figure 3.
Figure 3 also shows that Fourier terms to =18 are still detectable in the bar of NGC 6951. Including such terms provides a very good approximation to the total galaxy image. To verify this, we computed potentials from both the full image at maximum resolution, and a Fourier-smoothed image based on the sum of all even and odd terms up to =20. We found that the Fourier-smoothed =0-20 image gives virtually the same potential as the full image, with differences being mainly attributable to noise and the occasional bright star-forming region.
Interestingly, Figure 3 shows that the =10 term goes to zero at =45′′, while our extrapolations make the other terms go to zero at 55′′ to 60′′. This shows the limitations of our approach in the sense that the bar relative intensity profiles may not be as symmetric as we assume. None of the terms in NGC 4394 shows a similar disagreement with the other terms, so =10 may be unusual in NGC 6951. Our procedure in general is that if any term shows a significant portion of its decline past the maximum, we will use the decline as measured and extrapolate as little as possible. This is what is done for =10 in Figure 3. However, we have tested that our maximum relative torque results for NGC 6951 would be the same even if the =10 term were extrapolated as for the other terms. The impact of cutting all the even-order terms at =45′′ is considered in the next section.
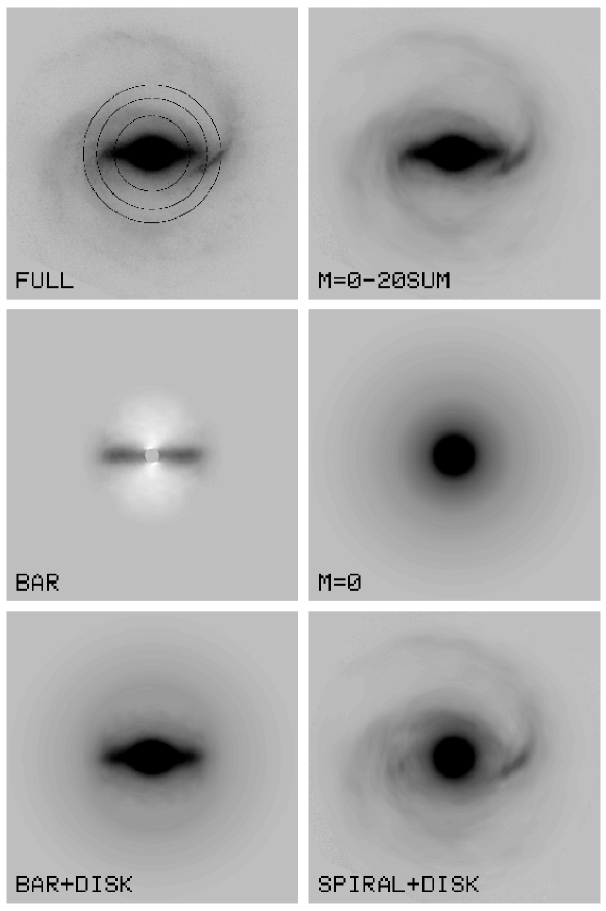
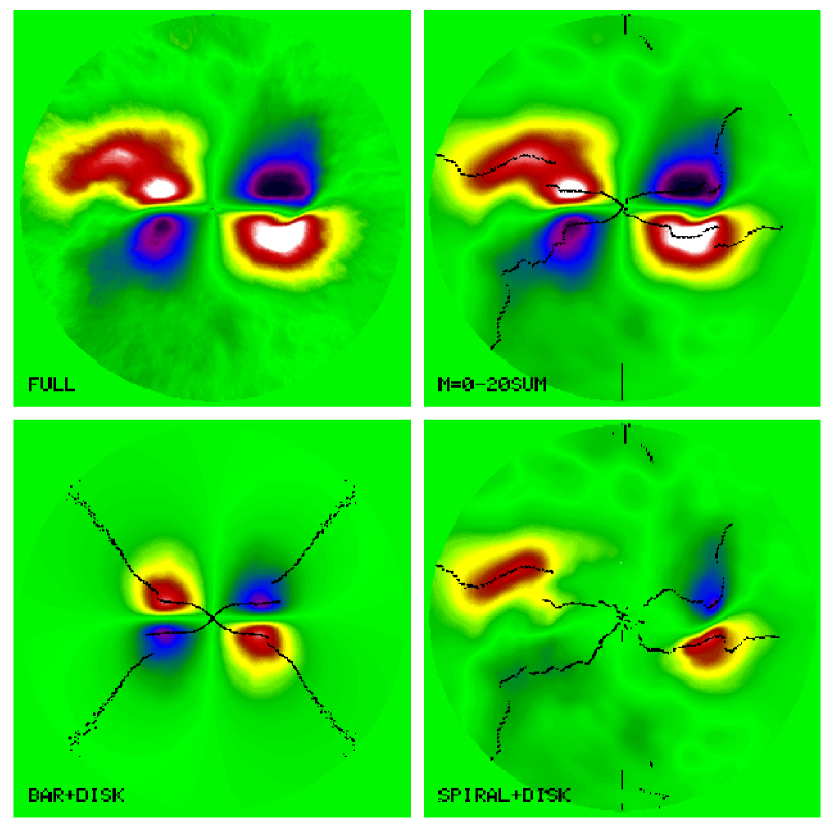
With extrapolations defined for each Fourier term, we computed the images shown in Figure 4. The “full” image is the original deprojected and rotated image, with the bar horizontal. This is the full resolution image and includes all noise. The “=0-20 sum” is the Fourier-smoothed version of the full image. It is based on 21 Fourier terms, including all even and odd terms. The “bar” image is the one that uses the extrapolations shown in Figure 3. It was computed by summing the 2 Fourier terms within the limits set for the bar, and has no net flux.111All 0 terms in a Fourier series, when integrated over all azimuths, have no net flux. The net flux in the bar would be the sum of all of its higher-order terms plus its =0 term. The net flux in the bar is brought back when we add the =0 image to the “bar” image. The fourth image is the =0 Fourier image, which shows the axisymmetric part of the light distribution.
The remaining images in Figure 4 show the separated bar and spiral images. The image “bar+disk” is the sum of the “bar” and =0 images. The image “spiral+disk” is the “=0-20 sum” minus the “bar” image. With this procedure, we place most of the noise and all of the odd Fourier terms into the “spiral+disk” image.
Figure 5 shows the force ratio maps , where is the tangential force and is the mean axisymmetric radial force, for the full, Fourier-smoothed, bar+disk, and spiral+disk images of NGC 6951. In the full image, one clearly sees the effects of both the spiral and the bar. A dominant “butterfly” pattern is present with extra structure due to the spiral. The Fourier-smoothed image looks very much the same, only with less noise. In the bar+disk ratio map, we see four symmetrically placed “maximum points” which lie near the ends of the bar, as noted in BB01. The spiral+disk image shows a less symmetric, rough butterfly pattern as well. Thus, our approach appears to have separated the bar and spiral, and we can see how each component contributes to the total ratio map.
Our next step is to use the ratio maps to derive single numbers that characterize the bar strength and the spiral strength. For this purpose, we derive the maximum value, , of the ratio of the tangential force to the mean radial force as a function of radius. These curves are interpolated bilinearly from the force ratio maps. Figure 5 shows that the structure in the force ratio maps alternates by quadrants with two maximum positive values and two maximum negative values at each radius. BB01 derived in each quadrant, and then averaged these four values to get a single number, , called the “bar strength” in the galaxy. Here we use a similar procedure, but as a function of radius. In Figure 5, the dotted curves show the maxima(minima) for each quadrant. For the bar+disk, a symmetric pattern for these maxima(minima) is mapped, as expected, while for the spiral a more complex mapping is found. Because the spiral is more complicated than the bar, we divided the ratio map into two 180∘ sections around a vertical line, and searched for the maxima and minima in each section. The sharp breaks in the spiral mapping are discontinuities in azimuth but not in radius, and are attributable to structure in the arms. At each radius, we averaged the values of to get the plots shown in Figure 2c. The dashed curve shows that the bar has a maximum force ratio at =31.′′5 (3.7 kpc), similar to the value chosen from the relative intensity amplitudes (smallest circle superposed on the full image in Figure 4). The spiral maximum in the dotted curve occurs at =57.′′5 (6.7 kpc, largest circle superposed on the full image). For comparison, the solid curve in Figure 2c shows the maxima from the total Fourier-smoothed image, while the crosses show the maxima from the full image. These curves agree well and show again that 21 Fourier terms are adequate for the analysis of NGC 6951.
Figure 2c shows that (bar)=(spiral) at 46.′′5. This corresponds to the middle circle superposed on the full image in Figure 4. The circle lies just outside the ends of the bar, and passes through the bright spiral arc on the right side of the bar.
From these curves we derive =0.2840.001 and =0.2120.035, where the uncertainties include only the internal scatter in maximum values. The small internal uncertainty in is due to the fact that only even Fourier terms were used to define the bar. The larger internal uncertainty in is due to the fact that all Fourier terms, even and odd, were used for the spiral. Additional uncertainties are discussed in the next section.
The maximum total relative gravitational torque is =0.340. Thus, our analysis shows that in this case, ignoring the effects of the spiral would lead us to overestimate the bar strength by about 20%. Nevertheless, the BB01 “bar class” remains at 3 in either case.
Figure 2d shows the predicted, normalized rotation curve for NGC 6951, based on the =0 term of the derived gravitational potential. The apparent flatness of the predicted curve for radii beyond =10′′ is consistent with observed rotation profiles along the photometric major axis obtained by Márquez & Moles (1993) and Pérez et al. (2000), and supports our assumption of a constant mass-to-light ratio, at least for this galaxy. The maximum rotation velocity in NGC 6951 is =230 km s-1 (Márquez & Moles 1993), favoring a maximal disk according to Kranz, Slyz, & Rix (2003).
5 Uncertainties in Method
BB01 discussed in detail the uncertainties in estimating gravitational torques from near-infrared images. One of the principal uncertainties is in the vertical scaleheight . Since this parameter can be measured directly only for edge-on galaxies, it has to be assumed. As shown by de Grijs (1998), , where is the isothermal scaleheight) depends on Hubble type, but within any type there is a significant scatter. At stage Sbc, individual values of this ratio range from 4 to 8. This range must include both a cosmic scatter component as well as fitting and observational uncertainties. In our estimated value of for NGC 6951, the scatter in the ratio leads to an uncertainty of 0.022, while for it leads to an uncertainty of 0.020. Thus, the uncertainty due to vertical scaleheight is at the 8-9% level for both and . This excludes the uncertainty in our derived value of for NGC 6951, which is sensitive to tke sky subtraction. This is discussed further below, but note again that some of the uncertainty in this parameter due to observational errors and decomposition uncertainties must be included in the spread in at each type.
Related to the issue of scaleheights is the possibility that the bar in NGC 6951 might be thicker than its disk, an effect thought to cause a boxy/peanut-shaped bulge structure in some edge-on disk galaxies (Bureau & Freeman 1999). However, Laurikainen & Salo (2002) showed that such a non-constant vertical scaleheight is unimportant in the evaluation of relative bar torques, finding that it affects by less than 5%. Since we cannot be sure what the vertical structure of the bar in NGC 6951 is like compared to its disk, we assume this could contribute an uncertainty of 0.05 for our estimate of .
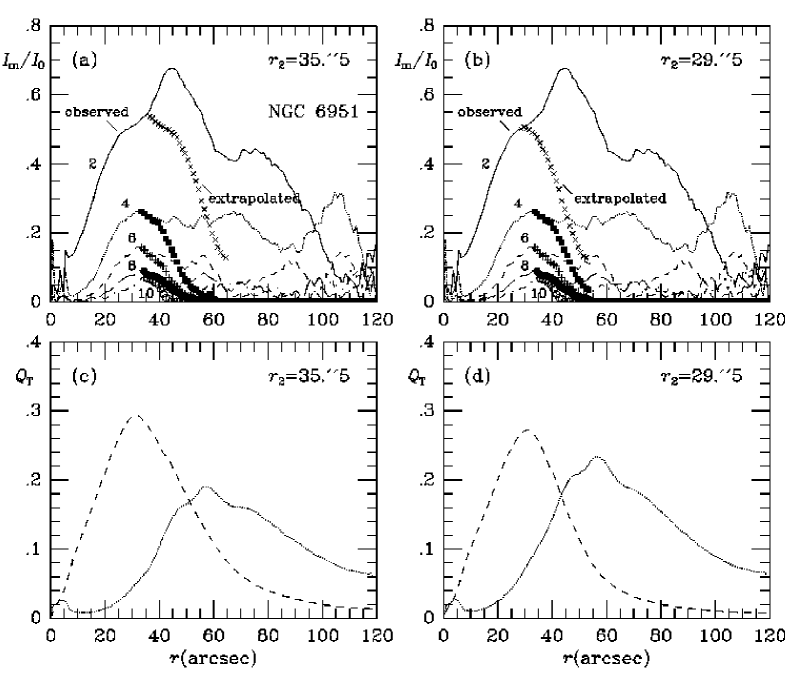
For bar/spiral separation, another possible major uncertainty will be the extrapolations of the bar Fourier amplitudes. The largest Fourier term in any bar will be the =2 term. We first investigate how the choice of the radius of the =2 maximum impacts our results. For our analysis of NGC 6951 in the previous section, we used 32.′′5 for this radius, and obtained, as already noted, =0.2840.001 and =0.2120.035. If we use 35.′′5 instead (Figure 6a and c), we obtain =0.293 and =0.190, while if we use 29.′′5 (Figure 6b and d), we obtain =0.272 and =0.234. Thus, the uncertainties in and due to the extrapolation will be correlated in the sense that if is too high, then will be too low and vice-versa. The choice of the radius of the =2 maximum appears to affect more than for NGC 6951. A 10% uncertainty in the radius of the bar maximum leads to 4% uncertainty in and 10% uncertainty in . Note that the greatly different =2 extrapolations have little or no impact on the radii of the bar and spiral maxima. Both extrapolations still give 31′′ and 57′′. However, the radius of the crossover point, where , is sensitive to the =2 extrapolation, ranging from 52′′ in Figure 6c to 43′′ in Figure 6d.
The second issue connected with the bar extrapolation is the symmetry assumption of the relative amplitudes. We have noted that the =10 term in NGC 6951 seems to violate this assumption and goes to zero at =45′′, while our assumed extrapolations for the other terms go to zero at larger radii. To test the impact of the symmetry assumption, we use the same extrapolations as before for all even 10, but cut all 2 at =45′′. This approximates the asymmetry of the =10 term for all even 2. Cutting the =2 term at the same radius appears to be too drastic, however, because it leaves a sharp edge in the separated bar and spiral images. Thus, we have left the extrapolation for =2 the same as before for this test. The cutoff for the higher-order terms changes the derived relative maximum torques to = 0.281 and = 0.220, amounting to 1% for and 4% for . This shows that, even if the terms actually do cut off at a radius smaller than implied by our extrapolations, we do not commit a serious error in and if we ignore it.
Other uncertainties discussed by BB01 included the flattening of the bulge, bulge deprojection stretch, uncertainties in the orientation parameters, sky subtraction uncertainties, and the constant assumption. NGC 6951 has a low enough inclination that bulge deprojection stretch has a negligible effect on the derived maximum torques, which occur for both the bar and spiral far outside the bulge-dominated area. Uncertainties due to orientation parameters can be significant (see Table 3 of BB01). Buta et al. (2003) show that, for a galaxy inclined about 40∘, the typical uncertainties in relative maximum torques is 0.030 for 5∘ uncertainty in inclination and 4∘ uncertainty in major axis position angle.
The favorable agreement between the observed and predicted rotation curves of NGC 6951 suggests that dark matter is not important in the inner parts of the galaxy, and that our assumption of a constant is probably correct in this case. In general, the best way to evaluate the effects of dark matter on relative maximum torque calculations will be to compare predicted near-infrared rotation curves with observed ones, if available.
Sky subtraction errors could impact our torque calculations, because the field of view of near-infrared images is usually limited and the sky level cannot always be precisely determined. For NGC 6951, we estimate a sky level uncertainty of 0.2 ADU in the intensity scale of the image. Such an uncertainty in the sky level will naturally affect our estimate of and hence also . We derive an uncertainty of 4′′ in for 0.2 ADU uncertainty in the sky, corresponding to an uncertainty in the vertical scaleheight of 78pc if =(1/6). This combined sky subtraction/vertical scaleheight uncertainty leads to an uncertainty of 0.010 in and 0.011 in . As might have been expected, the sky subtraction error impacts more than since the arms lie at larger radii, although the effect is only slight. The change is 3.5% for and 5% for .
Thus, allowing for the uncertainties in vertical scaleheight, bar extrapolation, sky subtraction, orientation parameter uncertainties, and the asymmetry in the spiral arms themselves, we derive =0.2840.040 and =0.2120.056 for NGC 6951.
Finally, there will always be individual cases that require special treatment, particularly if the bar has considerable asymmetry. In such cases, allowance for odd Fourier terms in the bar is needed, and we will describe in paper II an approach to dealing with them.
6 Conclusions
We have shown that straightforward Fourier techniques can be used to make a reasonable separation of a bar from a spiral. With such a separation, we can extend the BB01 gravitational bar torque method to spirals and define a spiral strength as well as a bar strength. In the case of NGC 6951, the maximum relative total gravitational torque is 0.34, while the individual bar and spiral strengths are 0.280.04 and 0.210.06, respectively. Thus, NGC 6951 is bar class 3 and spiral class 2, following Table 1 of BB01.
The general applicability of our separation method has not been fully evaluated since it has only been used for our sample of 15 WHT galaxies and two additional galaxies from other sources. However, as we will show in paper II, a reasonable separation was possible in each of those cases. We anticipate that the method will be applicable to most spirals, but that some galaxies will require special treatment. Objects having multiple bars, very weak bars in strong ovals, or very asymmetric bars are examples of such cases. We consider some of these cases in paper II.
We rename the maximum relative total gravitational torque parameter as , to remove any ambiguity about what it represents. In cases with strong bars and weaker spirals, the actual bar strength , while in cases with strong spirals and weaker bars, . In general, a separation analysis will be needed to investigate real bar torques. However, the derivation of alone is useful for some studies (e.g., investigations of the impact of gas accretion in galaxy disks; Block et al. 2003), and is the most straightforward parameter to derive. More details on the practical aspects of deriving for a large number of galaxies is provided by Laurikainen et al. (2003).
We thank H. Salo and E. Laurikainen for helpful discussions concerning refinements of the method, and for providing a revised lookup table for the vertical dimension in our analysis and for the deprojected OSUBGS -band image of NGC 4394. We also thank an anonymous referee for several helpful comments. RB acknowledges the support of NSF grant AST-0205143 to the University of Alabama and also the Anglo American Chairman’s fund during a visit to the University of the Witwatersrand in 2002 November. The research of DLB is supported by the Anglo American Chairman’s Fund, with deep gratitude expressed to CEO M. Keeton, Special Advisor H. Rix, and the Board of Trustees. DLB is also most appreciative to SASOL for funding the sabbatical period of his research. The William Herschel Telescope is operated on the island of La Palma by the Isaac Newton Group in the Spanish Observatorio del Roque de los Muchachos of the Instituto de Astrofísica de Canarias. Funding for the OSU Bright Galaxy Survey was provided by grants from the National Science Foundation (grants AST-9217716 and AST-9617006), with additional funding from the Ohio State University.
REFERENCES
Bureau, M. & Freeman, K. C. 1999, AJ, 118, 126
Buta, R. & Block, D. L. 2001, ApJ, 550, 243 (BB01)
Block, D. L., Puerari, I., Knapen, J. H., Elmegreen, B. G., Buta, R., Stedman, S., & Elmegreen, D. M. 2001, A&A, 375, 761
Block, D. L., Bournaud, F., Combes, F., Puerari, I., & Buta, R. 2002, A&A, 394, L35
Block, D. L., Buta, R., Knapen, J. H., Elmegreen, D. M., Elmegreen, B. G., Puerari, I., & Stedman, S. 2003, in preparation
Combes, F. & Sanders, R. H. 1981, A&A, 96, 164
de Grijs, R. 1998, MNRAS, 299, 595
Elmegreen, B. G. & Elmegreen, D. M. 1985, ApJ, 288, 438
Eskridge, P., Frogel, J. A., Pogge, R. W., et al. 2002, ApJS, 143, 73
Knapen, J. H., Beckman, J. E., Heller, C. H., Shlosman, I., & de Jong, R. S. 1995, ApJ, 454, 623
Kranz, T., Slyz, A., & Rix, H.-W. 2003, ApJ, 586, 143
Laurikainen, E. & Salo, H. 2002, MNRAS, 337, 1118
Laurikainen, E., Salo, H., & Rautiainen, P. 2002, MNRAS, 331, 880
Laurikainen, E., Salo, H., Buta, R., & Vasylyev, S. 2003, in preparation
Márquez, I. & Moles, M. 1993, AJ, 105, 2090
Ohta, K., Hamabe, M., & Wakamatsu, K. 1990, ApJ, 357, 71
Pérez, E., Márquez, I., Marrero, I., Durret, F., González Delgado, R. M., Masegosa, J., Maza, J., & Moles, M. 2000, A&A, 353, 893
Quillen, A. C., Frogel, J. A., & González, R. A. 1994, ApJ, 437, 162 (QFG)
Rhoads, J. E. 1998, AJ, 115, 472
Sellwood, J. A. 2000, in Dynamics of Galaxies: From the Early Universe to the Present, F. Combes, G. A. Mamon, & V. Charmandaris, eds., San Francisco, ASP Conf. Ser. 197, p. 3.
Tully, R. B. 1988, Nearby Galaxies Catalogue, Cambridge, Cambridge University Press
Yuan, C. & Kuo, C.-L. 1997, ApJ, 486, 750