The Stellar Cusp Around the Supermassive Black Hole in the Galactic Center
Abstract
We analyze deep near-IR adaptive optics imaging (taken with NAOS/CONICA on the VLT) 111 Based on observations obtained at the European Southern Observatory, Chile as well as new proper motion data of the nuclear star cluster of the Milky Way. The surface density distribution of faint (H, K) stars peaks within 0.2′′ of the black hole candidate SgrA⋆. The radial density distribution of this stellar ’cusp’ follows a power law of exponent . The K-band luminosity function of the overall nuclear stellar cluster (within of SgrA⋆) resembles that of the large scale, Galactic bulge, but shows an excess of stars at K. It fits population synthesis models of an old, metal rich stellar population with a contribution from young, early and late-type stars at the bright end. In contrast, the cusp within of SgrA⋆ appears to have a featureless luminosity function, suggesting that old, low mass horizontal branch/red clump stars are lacking. Likewise there appear to be fewer late type giants. The innermost cusp also contains a group of moderately bright, early type stars that are tightly bound to the black hole. We interpret these results as evidence that the stellar properties change significantly from the outer cluster ( a few arcsecs) to the dense innermost region around the black hole.
We find that most of the massive early type stars at distances 1-10” from SgrA⋆ are located in two rotating and geometrically thin disks. These disks are inclined at large angles and counter-rotate with respect to each other. Their stellar content is essentially the same, indicating that they formed at the same time. We conclude that of the possible formation scenarios for these massive stars the most probable one is that 5-8 million years ago two clouds fell into the center, collided, were shock compressed and then formed two rotating (accretion) disks orbiting the central black hole. For the OB-stars in the central arcsecond, on the other hand, a stellar merger model is the most appealing explanation. These stars may thus be ’super-blue-stragglers’, formed and ‘rejuvenated’ through mergers of lower mass stars in the very dense (pc environment of the cusp. The ‘collider model’ also accounts for the lack of giants within the central few arcseconds.
The star closest to SgrA⋆ in 2002, S2, exhibits a 3.8 excess. We propose that the mid-IR emission either comes from the accretion flow around the black hole itself, or from dust in the accretion flow that is heated by the ultra-violet emission of S2.
1 Introduction
Because of its proximity (distance 8 kpc, Reid 1993), the center of the Milky Way is a unique laboratory for studying the physical processes in galactic nuclei (e.g. Genzel, Hollenbach & Townes 1994, Morris & Serabyn 1996, Mezger, Duschl & Zylka 1996, Melia & Falcke 2001). In particular, the Galactic Center offers the unique opportunity for investigating stars and gas in the immediate vicinity of a supermassive black hole, at a level of detail that will not be accessible in any other galactic nucleus in the foreseeable future. In the present paper we present and analyze new high resolution, adaptive optics imaging and observations of stellar velocities in the nuclear cluster, relating to its spatial distribution, evolution and dynamics. Let us summarize what is known from observations during the past decade.
First, the overall surface density and surface brightness of stars increases with decreasing separation from the center near the compact radio source SgrA⋆ (diameter 10 light minutes, Doeleman et al. 2001), with a near-isothermal power law (stellar volume density ) from projected radii to about (Catchpole, Whitelock & Glass 1990). Within that radius the surface brightness continues to increase inward to ~1” but the stellar surface number density at moderately bright magnitudes (K 222 characteristic of main sequence stars earlier than B0, and giants later than K4) flattens, consistent with a half-peak surface brightness/density (core) radius of 0.34 0.2 pc (Genzel et al. 1996). The value of the core radius is uncertain. The lower limit comes from surface density counts of the brightest few hundred stars (Eckart et al. 1993). The upper limit comes from the surface brightness distribution of late type stars (Allen 1994), and measurements of the integrated light of faint stars in between the brightest stars (Rieke & Rieke 1994). The largest concentration of K stellar light and surface density is not centered on SgrA⋆, but on the IRS16 complex about 2′′ east of it. This offset has been interpreted as evidence that SgrA⋆ cannot be a massive black hole (e.g. Allen & Sanders 1986).
Second, there are several different stellar populations/components in the central parsec (for a review see Genzel 2001). The stellar mass and the near-IR light at K is dominated by red giants in the old (1-10 Gyr) component of the nuclear star cluster. A group of about a dozen luminous, blue supergiants (‘HeI emission line stars’) strongly affects the near-IR maps at the bright end (K), and probably indicates recent formation of massive stars within the last 2-7 Myrs (Forrest et al. 1987, Allen, Hyland & Hillier 1990, Krabbe et al. 1991, 1995, Tamblyn et al. 1996, Blum et al. 1996b, Paumard et al. 2001). A number of bright (K) asymptotic giant branch (AGB) stars sample an intermediate mass, intermediate age component (100 Myr, Lebofsky & Rieke 1987, Krabbe et al. 1995, Blum et al. 1996b). Finally there is a group of dust embedded stars with near-featureless near-IR spectra (Becklin et al. 1978, Krabbe et al. 1995, Genzel et al. 1996), many of which are associated with the gaseous mini-spiral (Lo & Claussen 1983). Their nature is uncertain. The near-IR luminosity function to K16 resembles that of the Galactic Bulge in Baade’s Window (Blum et al. 1996a, Davidge et al. 1997, Alexander & Sternberg 1999).
Third, the mean stellar velocities (or velocity dispersions) follow a Kepler law () from to , and provide compelling evidence for the presence of a central compact mass (Genzel et al. 1996, 97, 2000; Eckart and Genzel 1996, 97; Ghez et al. 1998). Overall the stellar velocities are consistent with an isotropic velocity field but the HeI emission line stars appear to be preferentially on tangential orbits (Genzel et al. 2000). Statistical modeling of the stellar velocity data (projected mass estimators, Jeans equation modeling, non-parametric modeling) imply that the 2 to 3.3 central dark mass is concentrated on scales less than ten light days (Eckart & Genzel 1996, 1997, Ghez et al. 1998, 2000, Genzel et al. 2000, Chakrabarti & Saha 2001, Eckart et al. 2002). Most recently, Schödel et al. (2002, 2003) and Ghez et al. (2003) found that the star closest to SgrA⋆ in 2002, S2, is on a highly elliptical Keplerian orbit around the radio source. The enclosed mass within the orbit’s peri-center approach of 17 light hours (in April 2002: at which point the star had a sky projected velocity of 5000 km/s) is (Schödel et al. 2003), which is within the uncertainties the same as the mass at distances of ten to several hundred light days. As a result the density of a hypothetical, non-black hole configuration has to have a central density of 2 pc-3 or greater. When combined with the 8 to 20 km/s upper limit to the proper motion of SgrA∗ (Backer & Sramek 1999, Reid et al. 1999, Reid et al. 2003b) and a theoretical analysis of the motion of a black hole in the central star cluster, the density limit increases to pc-3 (Schödel et al. 2003). The new orbital data now definitely exclude a dark cluster of astrophysical objects (e.g.neutron stars), or a ball of 10-60 keV fermions as possible configurations of the central mass concentration. The only non-black hole configuration is a ball of hypothetical, heavy bosons, which would not be stable, however. The gravitational potential in the central light year of the Galactic Center thus is almost certainly dominated by a massive black hole associated with SgrA⋆.
We would like to better determine the distribution, properties and dynamics of the different stellar components and understand their formation and evolution. We need to sample the numerous lower mass stars in the nuclear star cluster to determine the overall stellar density distribution and centroid. Theory predicts a number of effects that are unique to the environment of a black hole (for a review see Alexander 2002). There should be a density ‘singularity’ of the star cluster (a ‘stellar cusp’) centered on the hole (Bahcall & Wolf 1976, 1977, Young 1980). Because of the very dense environment close encounters and direct stellar collisions can occur and alter the stellar distribution, dynamics and population near the hole. Giant stars can be destroyed (Davies & Benz 1991, Rasio & Shapiro 1990, Davies et al. 1998, Alexander 1999) and exotic stars created (e.g. Thorne and Zytkow 1975). Given the extensive evidence for hot, massive stars in the central parsec we need to answer how they came into being in the very dense central environment. We also would like to detect SgrA⋆ itself in the near-/mid-IR, and place tighter constraints on the accretion flow properties (Melia & Falcke 2001). We will address all these issues in the present paper.
Previous data sets from the 3.5m ESO New Technology Telescope (NTT: Eckart & Genzel 1996, 1997, Genzel et al. 1997, 2000), the 3.6m Canada France Hawaii telescope (CFHT: Davidge et al. 1997), and from the 10m Keck telescope (Ghez et al. 1998, 2000) have FWHM resolutions of 0.15′′, 0.16′′ and 0.05′′ respectively, and reach to K16-17. Deeper imaging at the diffraction limited resolution of 8-10m class telescopes is critical for addressing the problems outlined above. For this purpose we have carried out deep near-infrared adaptive optics (AO) observations with the new NAOS/CONICA instrument on the ESO VLT (Lenzen et al. 1998, Rousset et al. 1998, Brandner et al. 2002). These observations provide diffraction limited images at H (1.65 and Ks (2.16 to and at L′(3.76 to . These improvements are largely due to the near-infrared wavefront sensor of NAOS (which can lock on the bright star IRS7 within a few arcsec of SgrA*) and due to the fact that the Galactic center passes through the zenith at Paranal. As a result NAOS/CONICA achieves diffraction limited imaging with stable and high (40-50%), K-band Strehl ratios. Proper motions and radial velocities for about 1000 stars are now available from a new analysis of the ESO-NTT proper motions and integral field spectroscopy between 1992 and 2003 (Ott et al. 2003). We combine the AO observations with the new data base of stellar proper motions and radial velocities, for a new analysis of the properties of the nuclear star cluster.
2 Observations and Data Reduction
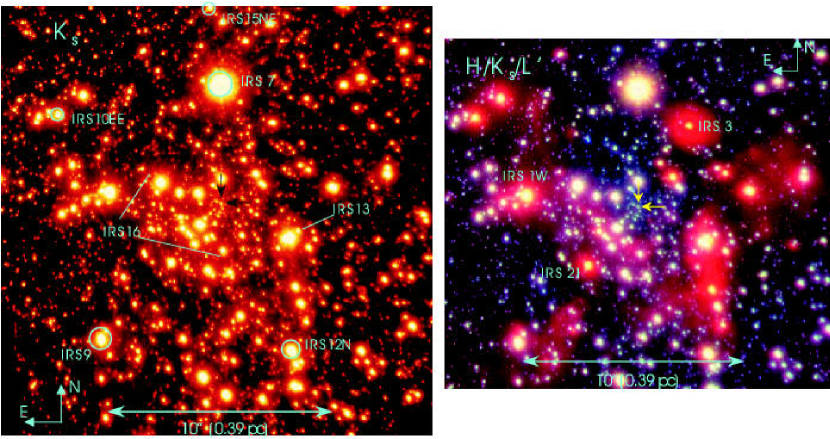
The observations presented in this paper were carried out during science verification with the NAOS/CONICA adaptive optics system/near-infrared camera at the unit telescope 4 (Yepun) of the ESO VLT in Paranal, Chile. H-band (1.65, Ks-band (2.16m) and -band (3.76m) imaging data were taken on August 29, 2002. Seeing was between 0.5 and 0.6′′. For H and Ks the infrared wavefront sensor of NAOS was used to close the feedback loop on the bright supergiant IRS 7 north of SgrA⋆. The detector pixel scale was 0.0132′′/pixel for H and Ks and 0.027/pixel for L′. The diffraction limited resolution was 40, 55 and 95 milliarcseconds (mas) in the H, Ks and L′ bands (FWHM). The oversampling helped to reduce the saturation of the numerous bright sources in the nuclear cluster. The detector integration time was 15 s. Four individual exposures were combined by a pipeline into one image of 60 s integration time. 25 such images were taken in the H band and 20 in the Ks-band. The individual images were flat-fielded, sky-subtracted and corrected for dead/bad pixels. The final frames were co-added with a simple shift-and-add (SSA) algorithm to final images of 1200 s (Ks band, Figure 1) and 1500 s (H band, Figure 2) total integration time. The Strehl ratio measured on individual sources near the guiding star is in the Ks-band and in the H band. Dithering between the exposures resulted in a field-of-view (FOV) larger than the provided by CONICA with the finest pixel scale. From the final mosaic we selected a region with the highest S/N-ratio, approximately centered on SgrA⋆. There are numerous () bright (K) stars in the FOV, which are strongly saturated in the Ks-band image. Saturation is less severe in the H-band image. For L’ the AO loop was closed with the visible light wavefront sensor on a star to the north-east of SgrA⋆ (at the time of the observations the dichroic allowing the simultaneous use of the infrared wavefront sensor and the L/M-bands was not available). A single imaging frame consists of 150 exposures of 0.2 s, coadded by a pipeline into a single frame with 30 s integration time. 76 such images were taken. After flat fielding, sky-subtraction and dead/bad pixel correction, the individual frames were combined into a final SSA image of 2280 s integration time, with a Strehl ratio of (see also Clénet et al. 2003). The right panel of Figure 1 shows a color composite of all three images.
In the following subsections we discuss in detail the analysis and methods we have developed and applied to carry out source counts, photometry and astrometry in our crowded, high dynamic range, adaptive optics images. Readers who wish to skip these technical details should continue with section 3.
2.1 Source identification and photometry
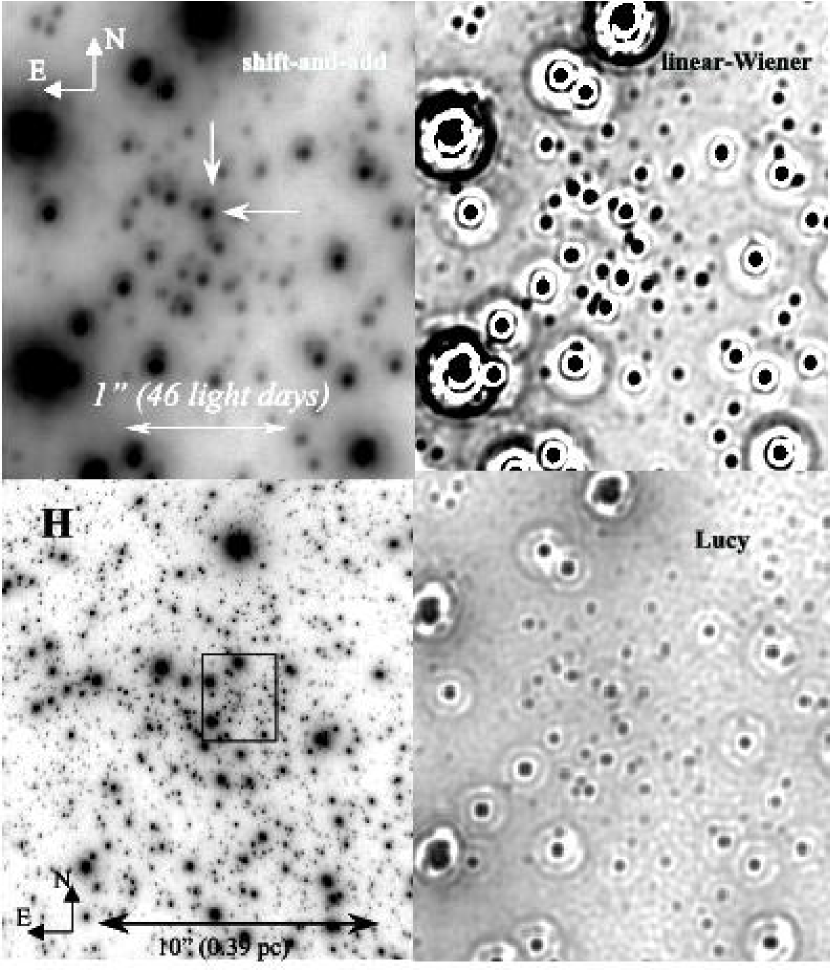
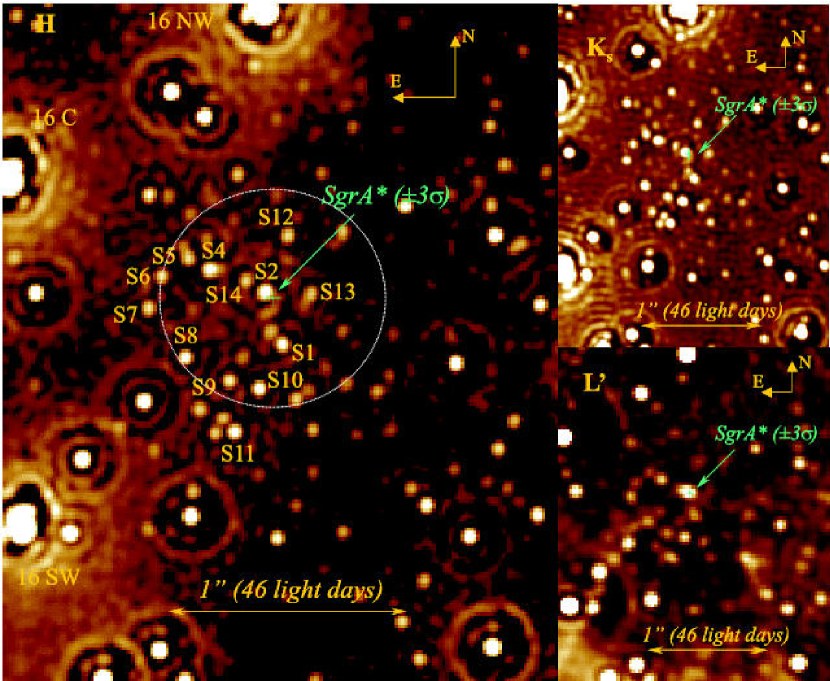
In order to facilitate the identification of sources in the extremely dense nuclear stellar cluster and to reduce the influence of the seeing halos of the numerous bright stars, we deconvolved the images prior to number counts and photometric analysis. A point-spread function (PSF) was extracted from the images by taking the median of several (more than 10 in the case of the Ks and H-band images) fairly isolated, bright, but not saturated stars. We deconvolved the images using two methods, a linear Wiener-filter technique (Ott, Eckart & Genzel 1999), and the Lucy-Richardson (LR: Lucy 1974) algorithm. The delta maps resulting from the LR deconvolution were re-convolved with a Gaussian PSF of the appropriate FWHM for the respective wavelengths. For comparison of the results of the different image processing techniques, Figure 2 shows the direct (SSA) image, and the Wiener-filtered/linearly deconvolved and the Lucy-deconvolved H-band images of the central around the compact radio source SgrA⋆. The agreement of sources identified with the different image analysis techniques is generally very good. Only within a few tenths of an arcsec of bright (mostly saturated) stars some deterioration is caused by artefacts such as ringing. In these regions, graininess of the seeing halo, ringing and streaks make source identification of stars 4 or more magnitudes fainter than the bright star unreliable. Figure 3 shows H-, Ks- and L′-band, Lucy-deconvolved images of the central region around SgrA⋆.
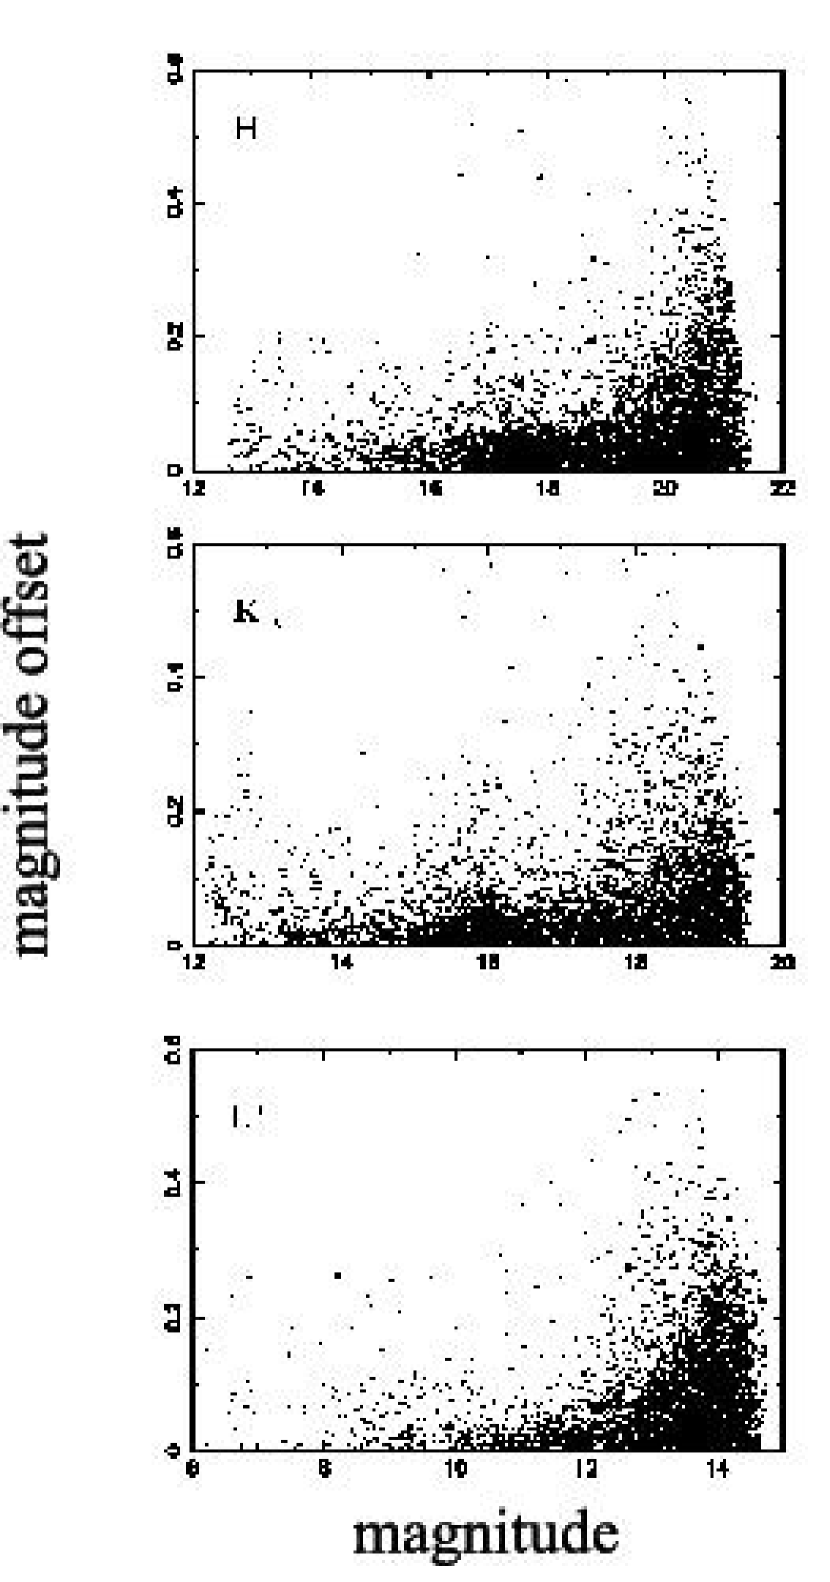
We identified point sources and carried out photometry with the FIND procedure from the IDL Astrolib library. The IDL FIND procedure convolves the image with a gaussian beam prior to searching for local maxima. We found that there is no ideal choice for this parameter. Depending on the exact value of the FWHM parameter, sources may be identified or missed in densely packed regions, while various spurious sources may be detected. We therefore decided to repeat the source detection (and completeness correction, see below) procedure three times, with different values of the FWHM parameter. For construction of the final source lists we compared the lists of sources from the LR and Wiener deconvolved images, eliminating sources that only showed up in one of the lists. For the remaining stars, their photometric values were averaged, with the error taken as the deviation of the two measurements from the average. The photometric errors for the different bands are shown in Figure 4. In regions not too close to bright stars, sources of 19th magnitude are above the background in the deconvolved Ks-band image, while the H -band image is about 1.5 magnitudes deeper. Spurious sources are detected in the seeing halos of bright stars. This problem was particularly important for the Ks-band, where numerous bright stars were strongly saturated. Deconvolution techniques also tend to create faint, spurious point sources. We therefore adopted a conservative approach by applying the constraint that genuine stellar sources must be present in both the H- and Ks-band image. We verified that this procedure effectively excluded spurious detections by comparing the maps of the identified stars with the actual images.
The final lists of sources comprise between 3200 and 4000 stars, depending on the choice of the FWHM parameter, with significantly different source counts only for sources with K18. After correction for incompleteness (see below), however, the number counts at all magnitudes agree very well. For the number counts of the luminosity function and of the surface number density presented in this paper, we chose the average of the counts resulting from the different choices of the FWHM parameter. For the errors, we combined quadratically the statistical counting (Poisson) error and the maximum deviation of the counts from their average, which corresponds to a 10% uncertainty at K. We calibrated the photometry in the H, Ks and L′ bands relative to sources in the cluster. The main limitation in identifying appropriate calibration stars resulted from finding stars that were not saturated, but bright enough to be included in the Blum et al. (1996a) list. Additionally, these stars should be fairly isolated because the Blum et al. (1996a) data were seeing limited. By considering these points we tried to minimize possible systematic errors in flux calibration. For the Ks-band image, we chose four isolated stars with magnitudes between 13 and 14 from the Ott et al. (2003) list ( IDs 412, 284, 265, and 239). For the H-band photometry we used the Blum et al. (1996) photometric value for IRS 33N (named IRS A11 in their list). We took IRS 33N and IRS 16CC (Blum et al. 1996a) to calibrate the L′-band data. Another point to keep in mind is that the Blum et al. (1996a) data are made for the K and L-bands, while the observations presented in this paper were made with L′ and Ks band filters. We estimate the resulting relative uncertainties of our photometry to be less than 0.1 mag at K18 (H19), while the absolute photometry is uncertain by 0.15 mag in H and Ks, and 0.3 mag at L′.
2.2 Incompleteness correction
We determined the incompleteness correction for the Ks-band images with the well known technique of first adding and then again recovering artificial stars. Taking the same PSF as used for deconvolution, we inserted artificial stars randomly into the original stellar field. The image containing the artificial stars was Wiener deconvolved, followed by source identification with the FIND procedure. We did not repeat this procedure with a LR deconvolution because of the enormous amount of computational time needed for this method. The artificial stars were spaced at intervals of , such that their individual PSFs did not interfere with each other. By repeating the same procedure many times with different positions for the artificial stars, we probed the image with artificial stars in a dense grid. We recorded in ’completeness maps’ the probability of recovering a source with a given magnitude at a given position. The completeness map for stars of 18th magnitude in the Ks-band image is shown in Fig.5. Its spatial structure of course reflects the distribution of bright stars in Fig.1. Table 1 gives the overall completeness as well as the average magnitude and standard deviation of the magnitude of the recovered artificial stars for each magnitude interval. We determined the completeness corrections for all three choices of the FIND FWHM parameter that were used to create the source lists.
2.3 Absolute astrometry
In order to obtain astrometric positions for the stars relative to Sgr A*, we aligned the infrared images, in which the stars are observed, with the astrometrically accurate radio images, in which SgrA⋆ is observed (Schödel et al. 2002, Reid et al. 2003a, Ott et al.2003). For this purpose we aligned our NAOS/CONICA images with an astrometric grid using all 5 to 7 SiO maser sources in the field of view whose positions are known through measurements with the VLA and the VLBA with accuracies of a few mas (Reid et al. 2003a, circled in Fig. 1). The SiO masers originate in the central 10 AU (1 mas) of the circumstellar envelopes of bright red giants and supergiants, which are also present on the infrared images. The position of the radio source SgrA⋆ on the infrared image, as determined by a transformation that also takes account of up to second order terms (Reid et al. (2003a)), has a 3 uncertainty of 30mas and is denoted by arrows in the images in Figures 1 and 2 and as small crosses in Figure 3. The astrometric position of SgrA⋆ is coincident within a few milliarcsec with the ‘gravitational force center’, as determined from the orbit of S2 (Schödel et al. 2002, 2003, Ghez et al. 2003).
2.4 Number counts and K- luminosity function
We computed surface number densities by counting the stars in annuli with increasing radius around Sgr A*. We then corrected these number counts by dividing by the appropriate incompleteness at that radius and magnitude. In order to avoid completeness corrections significantly larger than a factor of 2 in the innermost annuli, where completeness and number counts are low for faint stars, we only used stars with K-magnitudes brighter than 17 for this analysis. In a second analysis we counted stars within of Sgr A* by eye in the Lucy-Richardson deconvolved H-Band image. This region is devoid of bright stars and the H-band image has the advantage of lower confusion. From the source counts, we also constructed completeness corrected overall K-band luminosity functions (KLFs) for the circular regions within and within of Sgr A*.
2.5 Proper motion and narrow band data sets
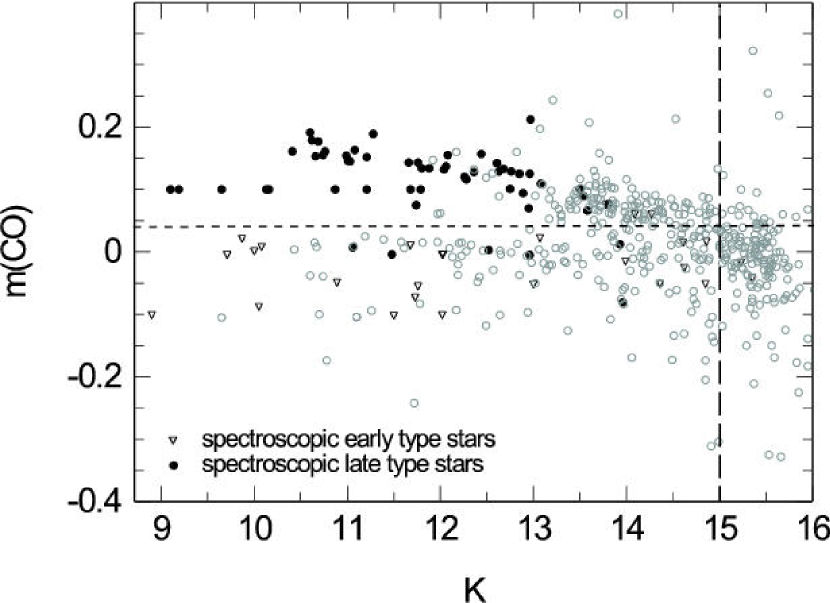
To study in more detail the dynamical, photometric and spectral properties of the nuclear star cluster we combined our NAOS/CONICA imaging and photometry with the new proper motion and radial velocity data base of Ott et al. (2003). Ott et al. (2003) constructed their sample from 10 years (1992-2002) of K-band speckle imaging data at the 3.5m ESO NTT, as well as several H/K integral field spectroscopy data sets. It contains 881 stars with proper motion errors 100 km/s, K16 and projected offsets from SgrA⋆ up to 12 To separate between early and late type stars in the broad-band maps at magnitudes fainter than the current K13 spectroscopic limit, Ott et al. used publicly available narrow-band maps taken as part of the Gemini North Galactic Center Demonstration Science Data Set. From these maps Ott et al. (2003) constructed a photometric, overtone CO-band index for each star in the GEMINI data set, and defined as
| (1) |
where and are the magnitudes in the narrow band filters at 2.29 m (CO v=0-2) and 2.26 m (continuum), both calibrated on the K-band magnitude scale. Figure 6 is a plot of as a function of K for those 706 stars of the Ott et al. sample with 100 km/s proper motion errors that also have GEMINI CO-indices. 86 of these stars also have near-IR spectroscopic identifications and radial velocities (Genzel et al. 1997, 2000, Paumard et al. 2001, Gezari et al. 2002, Ott et al. 2003). The spectroscopic early type stars (HI and HeI emission lines and lack of CO absorption bands) and late type stars (CO overtone absorption bands) are marked as filled triangles and filled circles, respectively. The -K plot shows that K early and late type stars can be separated with good confidence at . Fainter late type stars have weaker CO-indices, probably because they are early K-giants. For these fainter stars it is not possible to distinguish between early and late type stars on the basis of the GEMINI photometric index.
3 Results
3.1 Multi-band imaging of the stellar cluster
The NAOS/CONICA science verification H and Ks- images are mag deeper than the earlier NTT and Keck images, the H-image is the highest resolution image of the Galactic center region so far, and the L′ image is the first one of the Galactic center at resolution (for more details see Clénet et al. 2003). Figures 1, 2 and 3 show our basic H, Ks and L′ data sets. We have chosen a logarithmic color scale in all three figures to emphasize the large ( 13 mag) dynamic range and depth (H/K20) of our H and Ks- images. The faintest sources recognizable on the images are equivalent to 2 M⊙ A5/F0 main sequence stars. The images in Figure 1 demonstrate the complexity of the dense stellar environment in the central parsec. Bright blue supergiants (in the IRS16 and IRS13 complexes), as well as red supergiants (IRS 7) and asymptotic giant branch stars (IRS12N, 10EE and 15NE) dominate the H- and Ks-images. At L’ there is an additional group of dusty sources (IRS1W, 3, 21). Extended L’ emission comes from hot dust in the gaseous ‘mini-spiral’ streamers comprising the most prominent features of the SgrA West HII region.
The immediate vicinity of SgrA* lacks bright stars and dust. There is a concentration of K14 blue stars centered on the radio source (the ‘SgrA* cluster’). A number of these blue ’S’-stars (Fig.3) are now known from the proper motion studies to in fact reside in the central 25 light days. The orbital parameters for 6 of these stars indicate that their are bound to the central object with periods between 15 and a few hundred years (Schödel et al. 2002, 2003, Ghez et al. 2003).
3.2 Spatial distribution: stellar cusp
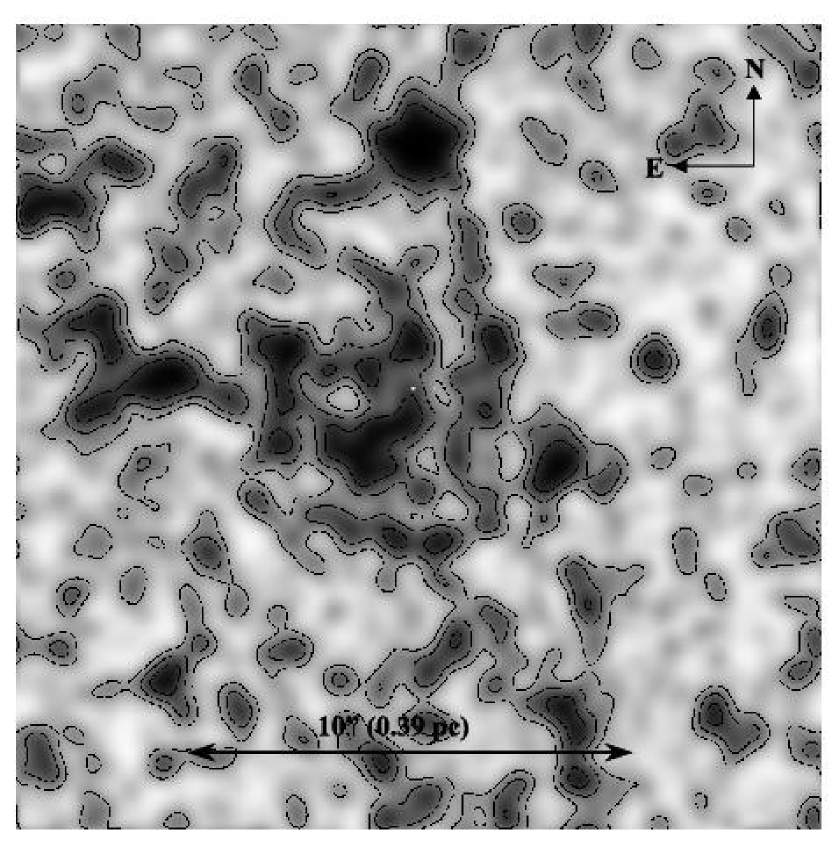
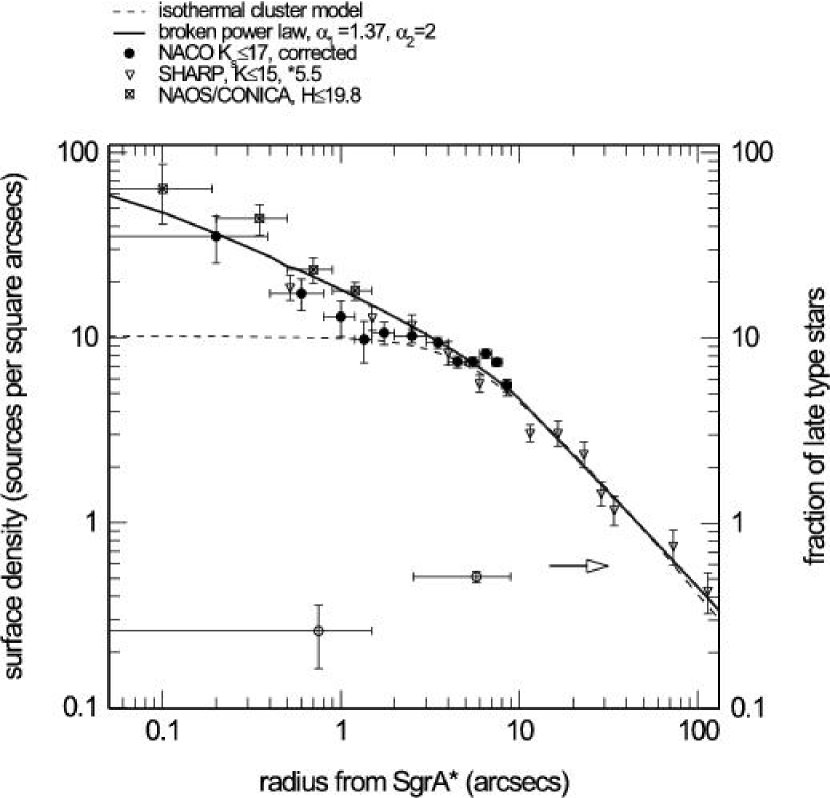
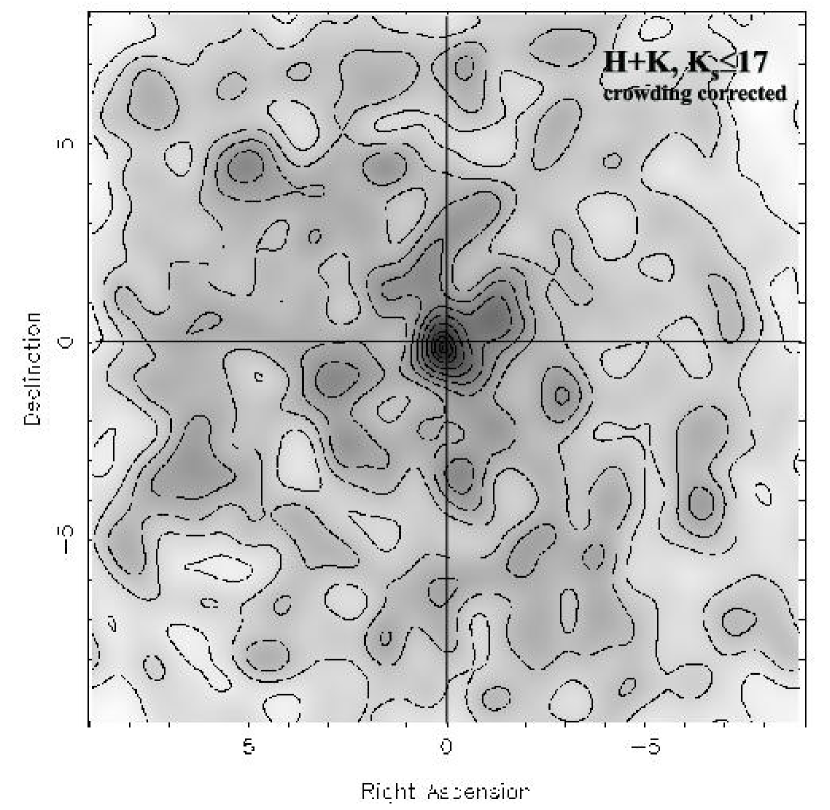
Figure 7 is a plot of the binned, stellar surface density distribution for stars as a function of projected separation from SgrA⋆. As described in section 2.2, we have corrected the observed K17 counts from Fig.1 for incompleteness. For the higher resolution H-band data we plot the observed H19.8 counts since the incompleteness correction in the central 1.5” is small and does not significantly vary with position. We also have determined distributions to fainter levels (K18), with very similar results. However, the incompleteness corrections at those fainter levels become large near the center and dominate the error budget. The most reliable results are obtained for the magnitude limits taken in Fig.7. For extrapolation to larger radii we combine the NAOS/CONICA data with shallower (K), but wider field NTT/SHARP number counts (Genzel et al. 2000), appropriately scaled for the best match with the deeper NAOS/CONICA data in the overlap region. As discussed in the Introduction, the stellar counts for projected distances 5-10” can be reasonably well fit by a flattened isothermal sphere of core radius 0.3 pc (Genzel et al. 1996 and references therein). Within a few arcseconds the new data clearly indicate an excess of faint stars above that of a flat core, already suggested by the earlier SHARP/NTT and Keck data (Eckart et al. 1995, Alexander 1999). The surface density of faint stars increases with decreasing separation from the radio source. The smoothed, two dimensional distribution of faint stars in the H and Ks-images (Fig. 8) visually confirms the existence of this ‘cusp’ and shows that it is centered on SgrA⋆ [()()], within an uncertainty of 0.2 This is in contrast to the near-IR light distribution (Fig.1), which is centered on the bright stars in the IRS16 complex. Our data thus resolve the 17 year old puzzle of why SgrA∗ is offset from the 2 emission peak (Allen & Sanders 1986). The offset is caused by the bright stars in the IRS16 complex, and is not a property of the majority of the faint stars in the overall nuclear cluster.
Following Alexander (1999) we have analyzed the surface number density distribution in Fig.7 with a broken power law, stellar density distribution, with the simultaneous constraint that the (stellar) dynamical mass is 3.2, 8.4 and at 1.9, 3.8 and 11 pc (subtracting from the mass distribution of Genzel et al. 1996 a central point mass). The resulting fit shown in Fig. 7 has the following parameters,
| (2) |
with at , and at . We have also generalized the Maximal Likelihood (ML) analysis of the cusp’s slope (Alexander 1999) to take into account the incompleteness corrections. Because the radius of the extracted NAOS/CONICA field (8”) is smaller than the break radius of 10” indicated by the NTT/SHARP data, an ML analysis of the NAOS/CONICA data alone cannot be used for a reliable determination of the parameters of the outer power-law. An analysis of 856 stars in the inner 4”, where the inner cusp dominates the total counts, indicates an inner power-law cusp with an exponent , in very good agreement with our analysis of the binned data above. With these parameters the cusp’s stellar density is pc-3 at , and pc-3 at . An alternate description of the data in Figure 7 may be a localized, Plummer-model like, cusp on SgrA⋆ superposed on a larger-scale, isothermal cluster, with a distinct break in between (Mouawad et al. 2003). The present data cannot discriminate between these two possibilities but the estimated stellar densities are similar. The stellar mass contained in the cusp is estimated to vary as .
The analysis we just presented depends critically on the assumption that the ratio of number counts to total stellar mass (mostly in fainter, not directly observed stars) does not vary with radius and environment in the Galactic Center. This assumption is almost certainly violated at some level, since we argue below that giant late type stars are destroyed and moderately massive stars are created by mergers of lower mass stars in the very dense inner region. However, we expect that these effects alter mostly the counts of the less numerous, brighter stars and not so much the fainter stars that dominate the counts. At the very least, the radial population changes make the values of the cusp density estimated above quite uncertain. Obviously, spectroscopic observations will be required for studying the properties of the fainter stars as a function of distance from SgrA*.
Keeping this caveat in mind, the observed stellar density distribution is consistent within the uncertainties with the predictions of theoretical models for a cluster of stars surrounding a massive central black hole. These models predict the formation of a power-law cusp. The expected radial slope of the power-law ranges between 0.5 and 2.5, depending on the cusp’s formation scenario and on the importance of inelastic stellar collisions. Relaxed, single mass stellar cusps have a steep slope of (Bahcall & Wolf 1976, 1977). Unrelaxed, initially isothermal clusters around an adiabatically growing hole have a shallower slope of (Young 1980). In multi-mass, lower density cusps ( pc-3) the models of Murphy et al. (1991) also predict a steep slope (), while higher density cusps ( pc-3) have flatter inner slopes due to the onset of stellar collisions (). The models also predict that a large fraction (80) of the cusp stars near the hole should be bound to it (, where Alexander 1999, 2002). Adiabatic solutions (e.g.Young 1980) that assume that the black hole grows on a time scale that is short compared to the stellar relaxation time scale, do not apply to the Galactic center, which is estimated to be relaxed (e.g.Alexander 1999) and where the growth time scale of the hole is long (10 Gyr).
3.3 K-band luminosity function: old star cluster with an admixture of young stars
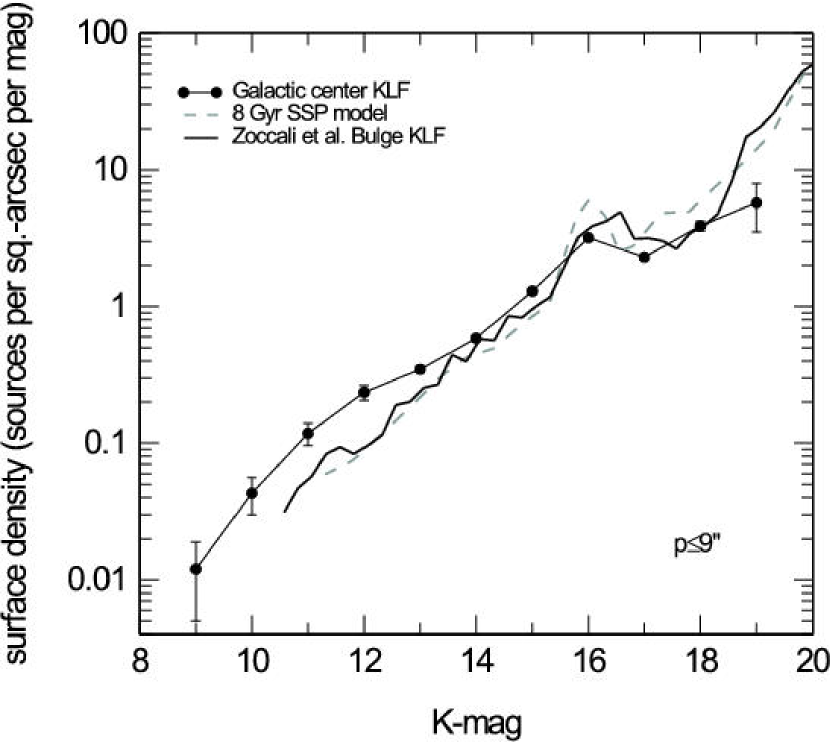
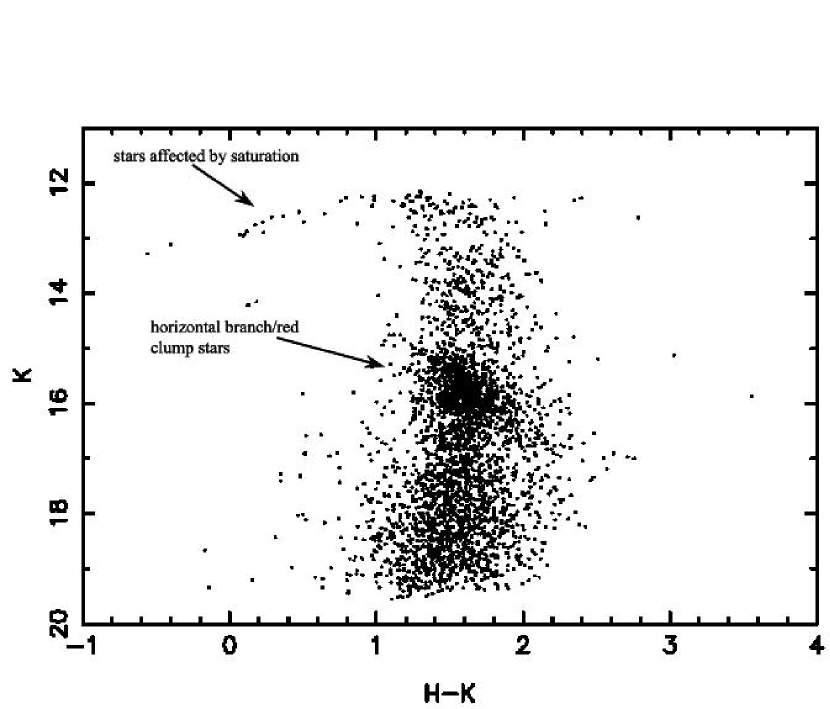
Figure 9 shows the K-band luminosity function (KLF) for the overall nuclear cluster (). Fig.10 is a color-magnitude plot of the same region. Figure 11 shows the KLF of the cusp region. In both regions we have corrected the counts for incompleteness with the artificial star technique described in section 2.2, taking into account the effects of this correction on the error bars. The NAOS/CONICA data are in excellent agreement with the previous Keck and NTT data at the brighter magnitudes, and extend the KLF to our completeness limit of K. The Galactic center KLF thus samples all giants and supergiants, as well as the main sequence to spectral type A5/F0 (2). Since the NAOS/CONICA counts are incomplete at the brightest magnitudes because of saturation effects, we have combined the NAOS/CONICA counts and the NTT counts to a common KLF shown in Figs. 9 and 11.
The overall KLF of the central 9′′ ( pc) region to first order is described by a power law (). In the range 14K19 the overall KLF is similar to, but somewhat flatter than the KLF of the Bulge of the Milky Way several degrees from the center (0.3: Alexander and Sternberg 1999, Tiede et al. 1999, Zoccali et al. 2002), and the KLF on 30pc scales around the center (Figer 2002). A 0.3 power-law is well matched by the theoretical KLF of old stellar populations, which reflects the rate of evolution of individual stars along the red giant and asypmtotic giant branches. The flatter slope of the Galactic center KLF compared to the Bulge is mostly caused by an excess of the counts at K, by a factor 1.4 to 2. In agreement with earlier discussions (Lebofsky & Rieke 1987, Blum et al. 1996b, Davidge et al. 1997), we attribute this bright-end excess to young, early and late type stars. In addition, the 9” KLF shows a prominent excess hump centered at K, a factor of 2 above the power law. This hump is prominent in the Bulge as well, and on 30 pc scales around the Galactic center when all distributions are adjusted to the same (Galactic center) extinction (A(K)=3.2, Rieke, Rieke & Paul 1989, Raab 2002). The excess can be attributed to old and metal rich, core He-burning horizontal branch (HB)/red clump (RC) stars (Tiede et al. 1995). These stars have characteristic masses of 0.5 to 0.8 . The red clump stars can also readily be seen in the color magnitude plot. The amplitude of the HB/RC excess relative to the numbers of giant stars making up the power law component suggests that the Galactic Bulge on average has close to solar metallicity (Tiede et al. 1995). In fact, an old ( 10 Gyr), single age (SSP) model with a bulge metallicity distribution deduced from the color-magnitude properties of the Bulge gives a fairly good representation of the hump (dashed curve in Figs. 9 and 11, from Zoccali et al. 2002). We thus conclude that the hump in the KLF at K16 is most likely caused by the presence in the innermost parsec of such old low mass, and metal rich stars. The overall KLF of the Galactic center thus is dominated by an old cluster with an admixture of bright young stars, in excellent agreement with the spectroscopic information collected over the past decade (see Introduction).
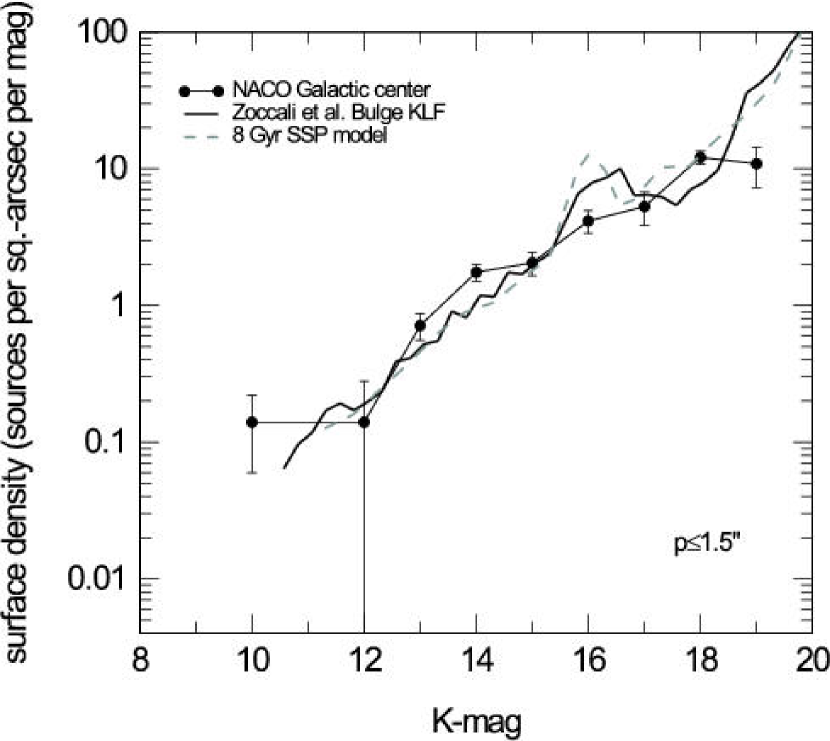
3.4 Population changes in the cusp
The KLF of the 1.5′′ cusp region (Fig. 11) appears to be a featureless power-law. It has a similar slope as the integral KLF () but the K16 HB/RC hump appears to be absent. Compared to the 9′′ and Bulge KLFs this deficit is significant at the 4 to 5 level. Relative to the 9′′ KLF, there may also be an excess of stars at 1315 (Fig.11). We conclude that the cusp probably lacks old low mass, HB/RC stars. The cusp probably also lack late type giants. The fraction of K15 late type stars, as determined from the narrow-band GEMINI indicator, drops from 50% at to 25% at (Fig.7). Considering again the effect of the fore- and background cluster stars, the intrinsic late type fraction in the cusp region proper must even be lower. Assuming a simple two-component model with a late type fraction of 50% in the outer region, the cusp’s content of K15 late type stars must intrinsically be 15%. However, because of the small numbers of late type stars in the very center (7 within 1.5′′) the statistical significance of this difference naturally is only 3. We conclude that the content and/or the properties of the stars in the cusp are different from those in the outer regions. The dense cusp may lack old, low mass stars. Alternatively and more likely, in the dense environment low mass stars ascending the red giant branch are stripped of their entire envelopes by physical collisions or close tidal encounters (see below and Appendix A). Losing their envelopes well before their helium cores reaches critical mass for helium ignitions, these stars would evolve directly to become helium white dwarfs, skipping the HB/RC phase. This could account for the absence of the HB/RC hump in the KLF and the lower fraction of red giants.
Taking the KLF of the cusp, we can estimate the number of stars as a function of K that are expected to reside within different radii from SgrA∗. We list these numbers in Table 2 for different magnitude (or mass) limits, for R=1”, 0.1” and 0.03”, and for two values of . The value of =0.21 is the slope determined from the observed KLF for K 18. A value of =0.35 fits the Bulge KLF (Alexander & Sternberg 1999), or a model of an old star cluster (Zoccali et al. 2002, Fig.11). To normalize to the observations, we use the value of 56 stars within p and K 17, as determined from the broken power-law fit in Fig.7.
The R=0.03” numbers are interesting since they give an impression of the number of stars with orbital periods 2 years and orbital velocities 3000 km/s that may be accessible to future interferometric observations of the SgrA∗ cusp. For the likely range of the faint-end KLF slope and for a realistic observational limit of K20, Table 2 suggests that one ought to expect one or several such stars to be present at any given time if they move on circular orbits. The present data suggest a large fraction of highly eccentric orbits (Schödel et al. 2003). In that case the number of fast moving stars would be significantly larger. In fact two such stars (S2 and S14) have already been observed (Schödel et al. 2002, 2003, Ghez et al. 2003). The prospects thus are good for using interferometry to sample stars closer to the central black hole than presently possible with AO on 10m-class telescopes.
The total number of unobserved, low mass stars (0.5-1 M⊙) extrapolated with the KLF-slope, in combination with the mass model of section 3.2 above, can also be used to compute the average stellar mass in the cusp. For this average mass is 33 M⊙ to a limiting magnitude of K21 (corresponding to 1 M⊙ main sequence stars), and 13 M⊙ to K23 (corresponding to 0.5 M⊙ main sequence stars). For the average masses to the same Ks limits are 8.9 and 1.8 M⊙. Assuming a Salpeter mass function (for lack of a better choice) with power law slope in density and with lower mass limits of m0.5 and 1 M⊙, the average stellar masses are 1.6 and 3.1 M⊙, respectively. For a shallower initial mass function of , the corresponding average stellar masses are 7 M⊙ (m M⊙) and 10 M⊙ (m M⊙). KLF slope, number counts and mass model thus are consistent with each other in either one of two regimes. If the cusp has a Salpeter IMF, then the faint-end KLF must have a slope significantly steeper than and extend to 0.5 M⊙, or lower masses. Alternatively, if the faint-end KLF slope remains near the value of =0.21 characteristic of the K18 data, then the IMF must be significantly shallower than a Salpeter IMF, thus containing more high mass stars. The latter explanation would be favored if indeed stellar mergers are effective, as argued in section 4.4. The difference in number counts at K19 between a =0.35 and a =0.21 KLF is about a factor of 2. Ultra-deep H-band NAOS/CONICA observations may be able to test whether such a steepening of the faint-end KLF does occur.
3.5
Young, massive stars in the central star cluster
There are several pieces of evidence that the cusp contains many young, massive stars. Moderate resolution, infrared spectroscopy is available for many bright stars with K and (Genzel et al. 1996, 2000, Paumard et al. 2001, Ott et al. 2003). The data, as summarized in Ott et al. (2003), show that 5 of 7 (6 of 11) stars at with K (K) are early type, hot emission line stars (‘HeI’ stars). The K early type stars at must be young. Their near-IR spectral properties indicate that they are blue supergiants (Of), luminous blue variables (LBVs) or late type, Wolf-Rayet (WN/C ) stars with ages of 2-7 Myrs and masses of 30 to 120 (Krabbe et al. 1995, Tamblyn et al. 1996, Najarro et al. 1997, Ott, Eckart & Genzel 1999, Paumard et al. 2001, Figer et al. 1998, 1999, Cotera et al. 1999, Figer 2002). There is a prominent concentration of these stars in the IRS16 and IRS13 complexes. Ott et al. (1999) found that the bright HeI emission line star IRS16 SW is an eclipsing binary of mass . The alternative possibility that the hot emission line stars are rejuvenated products of mergers from lower mass, old stars can be excluded for stars outside the central few tenths of an arcsecond (see Appendix A). The stellar density several arcseconds or more away from SgrA⋆ is definitely too low to account for mergers to produce stars more massive than 10 to 20 (Genzel et al. 1994, Lee 1994). Furthermore, the properties of the bright emission line stars are essentially identical to the massive stars in the Quintuplet and Arches clusters, 30 to 50 pc away from SgrA⋆, in much lower density environments (Figer et al. 1998, 1999, Cotera et al. 1999, Figer 2002)..
Within the ‘SgrA⋆ cluster’ (0.5′′) Gezari et al. (2002) and Ghez et al. (2003) have recently reported adaptive optics assisted spectroscopy of several stars with the Keck telescope. S2 exhibits HI Br absorption and clearly is a hot star with an equivalent main-sequence identification of O8/B0. S1 and the fainter star S0-16 do not exhibit CO absorption features, and thus are very likely early type stars, with equivalent main sequence identifications of B0 (S1) and B5 (S0-16) (Genzel et al. 1997, Eckart et al. 1999, Figer et al. 2000, Gezari et al. 2002). Based on narrow-band, speckle-spectro-photometry Genzel et al. (1997) concluded that S8 and S11 are early type stars as well. The ‘S’-stars near SgrA⋆ represent the possible K14 excess found in the KLF.
3.6 Two kinematic components of young stars
We next use the narrow-band colors and and proper motions of the Ott et al. (2003) sample to demonstrate that the somewhat fainter (K 15), spectro-photometrically identified early type stars in the central few arcsecs must also be young and can be separated into two, separate kinematic components. Consider the normalized angular momentum along the line of sight, , which we define as
| (3) |
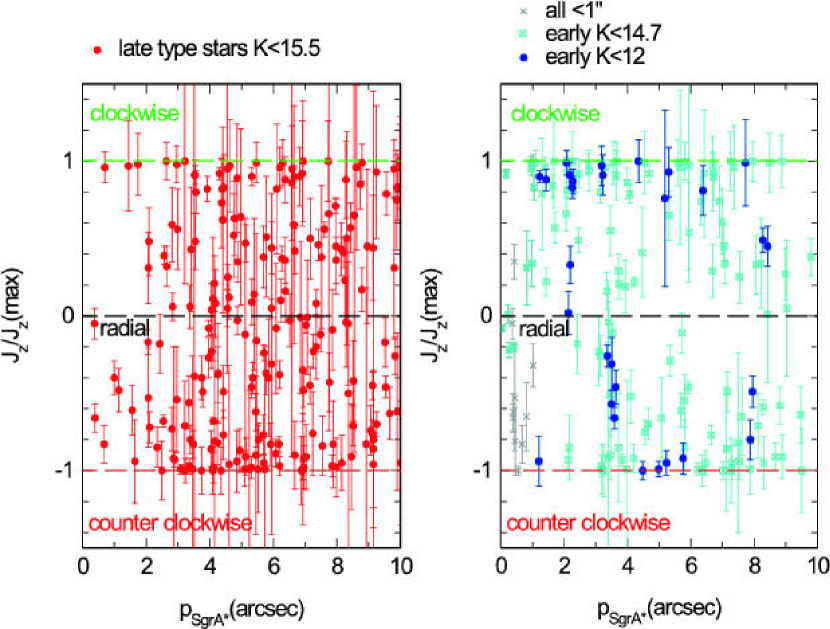
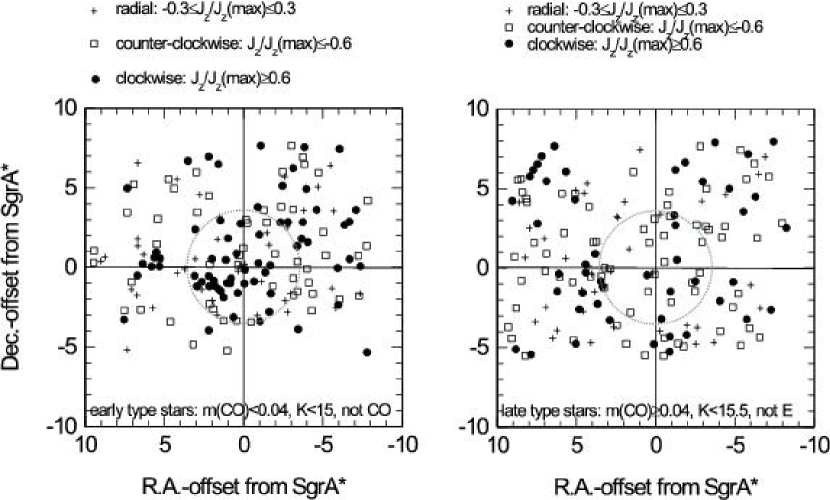
where and are the R.A.-, Dec.- and total proper motion velocities of a star at (x,y) on the sky and at projected radius . is , and , depending on whether the stellar orbit projected on the sky is mainly counter-clockwise tangential, radial or clockwise tangential with respect to the projected radius vector from the star to SgrA⋆. Note that stars moving tangentially in projection also must move tangentially in three dimensions. Stars moving radially in projection, however, may move radially in 3D, or tangentially, or a mixture of the two, depending on their location along the line of sight. Figure 12 shows the distribution of as a function of for late and early type stars, as identified from the narrow-band CO-index (Fig. 6). Figure 13 is a plot of the spatial distribution on the sky of early and late type stars with clockwise, counter-clockwise and radial orbits. For convenience, we divided here the normalized angular momentum range into 3 bins: clockwise tangential (), counter-clockwise tangential () and radial (-0.30.3). The isotropic late type stars serve as our comparison sample. They exhibit a random distribution of line-of-sight angular momenta (left panel of Fig. 12, right panel of Fig. 13). 21()% (22()%) and 36( )% (31() %) of the late type stars within (10′′) are on clockwise and counter-clockwise orbits. In contrast the early type stars show a preponderance of tangential and a lack of radial orbits (Fig. 12 right panel). Within the central 51() % and 18() % of the early type stars are on clockwise, and counter-clockwise, tangential orbits. Between 3 and 10” there are about equal numbers of clockwise and counter-clockwise tangential motions but still a lack of radial orbits. The preponderance of clockwise, tangential velocities near SgrA⋆ is also graphically apparent in the overdensity of filled circles within 3” from SgrA∗ in the left inset of Fig.13. In marked contrast to the random pattern of the late type stars broken up into the same three groups (Fig. 13, right panel), early type stars with clockwise, tangential orbits dominate within a few arcseconds of SgrA⋆, and bunch up in the IRS16 complex E/SE of SgrA⋆. This means that most of the early type stars in the central 10” are not relaxed, and belong to one of two kinematic components with opposite, line-of-sight angular momenta.
The line-of sight velocities also confirm that the late type stars are relaxed but early type stars are not. Apart from an average blue-shift in the central 10”, the late type stars show a random distribution of line-of-sight velocities (McGinn et al. 1989, Sellgren et al. 1990, Genzel et al.1996, Haller et al. 1996). In contrast, early type stars north of SgrA⋆ are almost all blue-shifted, while stars south of SgrA⋆ are almost all red-shifted Genzel et al. 1996, 2000, Paumard et al. 2001). This clearcut pattern is shown in the right inset of Fig.14 and is indicative of coherent rotation, with a direction opposite (counter) to that of the overall Galactic rotation.
3.7
Two coeval, rotating disks of young stars
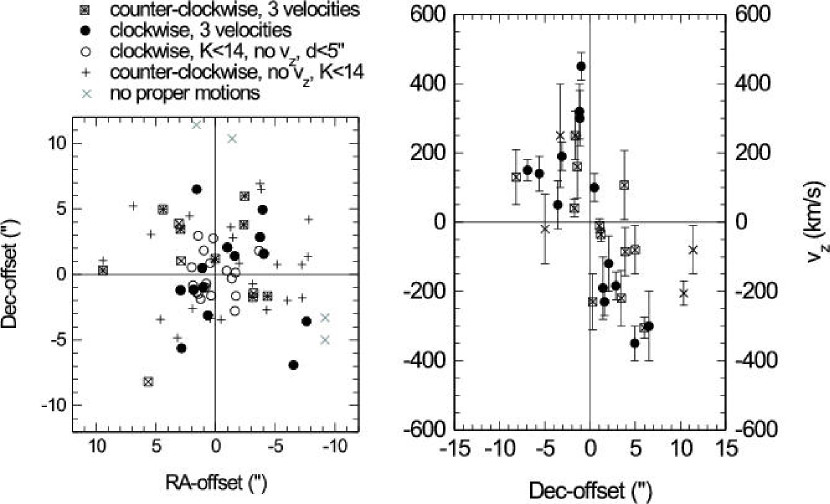
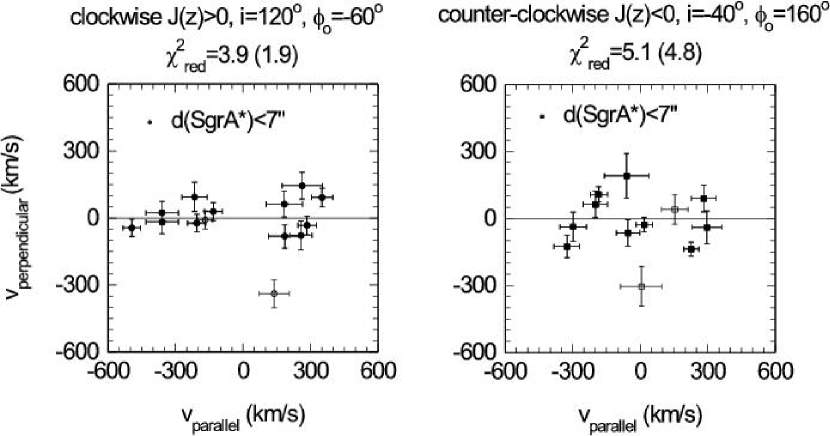
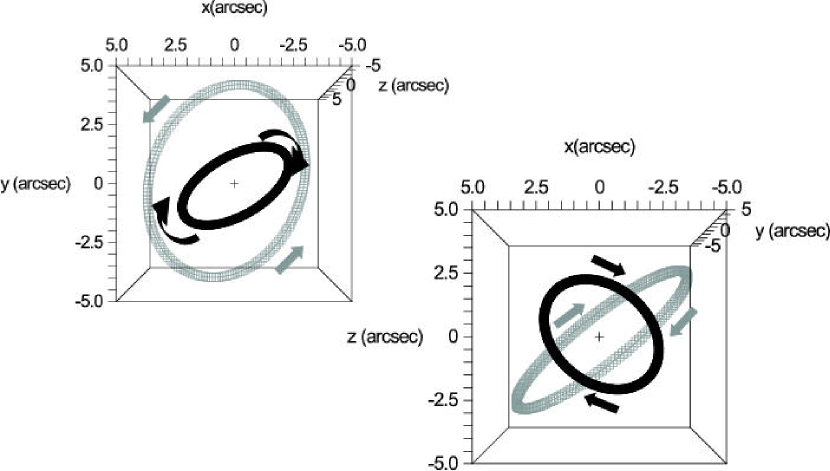
This global rotation pattern has previously been discussed by Genzel et al. (1996, 2000) and Paumard et al. (2001). Genzel et al.(2000) found that the 3D-velocity field could be matched by a rotating disk at inclination 140o (or 40o, depending on the definition of the angles) but noted that the fit was poor, and that ’ a better description …. probably is a dynamically hot and geometrically thick, rotating torus ….’. In the following we use the new data set of Ott et al. (2003) for a better determination of the disk parameters and for an investigation whether the two kinematic components of early type stars discussed in the last section can both be fit by rotating disks. For this purpose, we followed Levin and Boloborodov (2003) and first analyzed all 14 clockwise (JJz(max)0) early type stars with three velocities, as well as all 12 counter-clockwise (JJz(max)0) early type stars with all three velocities measured. We explored whether there exists a disk of inclination and projected major axis position angle (line of nodes) on the sky that fits the velocity field of all stars. We searched for a vector () (perpendicular to the disk) for which the observed velocities of the stars along are minimized. For the 14 clockwise stars we find that the best fitting plane ( and ) fits the data with 4 (Fig.15, left inset). Most of the deviation from a common plane is caused by one star located 9.8 SW of SgrA∗(AFNW). Our proper motions at such large distances strongly depend on the assumed values for the second order distortion terms in our astrometric solution. Since these terms are not as well constrained by the SiO maser stars in the field as the first order terms, there may be large systematic uncertainties for proper motions this far from the center. Taking only stars with separations 7” or smaller from SgrA*(filled circles in Fig.15, left inset) reduces the number of stars to 12, and to 2. The clockwise early type stars with three velocities thus can be described very well by a thin, rotating disk (at average distance of 2-4” from the center). The derived disk orientation agrees with that obtained by Levin and Boloborodov (2003) who used the earlier Genzel et al. (2000) proper motion/radial velocity set. A position angle of -40 to -60o is also consistent with the spatial elongation of the stars in the x/y plane (Fig.14, left inset, with the exception of AF and AFNW 9-10” SW). For the 12 counter-clockwise stars the best fitting plane ( and ) fits the data to 5 (Fig.15, right inset). Removing the two stars more than 7” away from SgrA* (open squares) reduces somewhat to 4.8. Again, a low inclination disk is consistent with the spatial distribution of the counter-clockwise stars in Fig.14 (left inset). A rotating thin disk model thus also fits the counter-clockwise stars but the deviations from the model are somewhat larger than for the clockwise stars. The characteristic radius of the counter-clockwise stars is 4-7”.
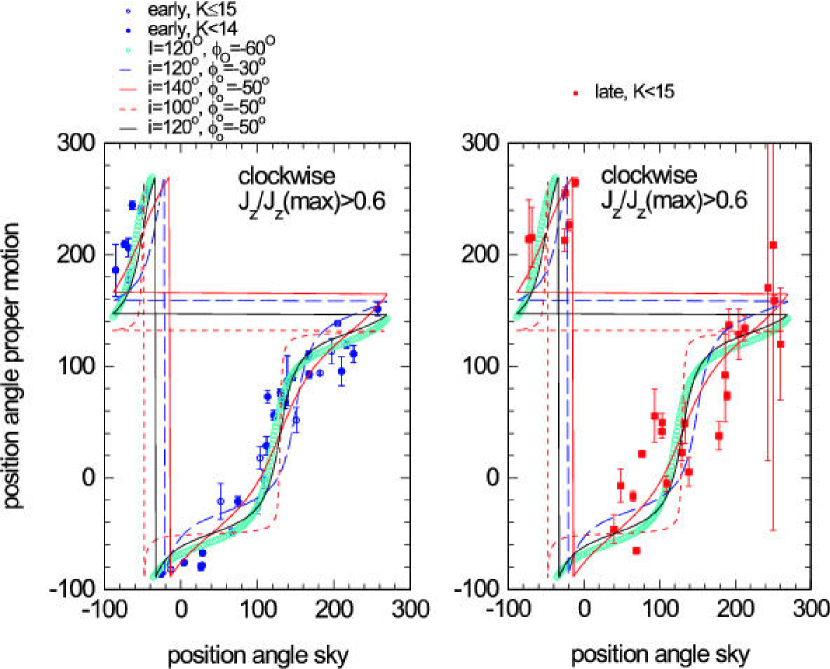
In the next step we explored whether also the many other clockwise and counter-clockwise stars with proper motions (but without 3 velocity components) can be fit by the same disk parameters. From coordinates and proper motions one can construct two angles, and (), which are independent of the radius in the disk but are functions of and . The thick curve in Fig.16 denotes the loci of stars in a disk with parameters derived above for the clockwise stars, while the other curves denote model disks with parameters within the uncertainties of the best fit. The filled and open circles denote the clockwise tangential stars (JJz(max)0.6) for p5” and K14 and 15, respectively. Clearly these fainter stars fit the input disk model (of the 14 stars with 3 velocities) very well. Likewise the counter-clockwise tangential stars fit the input disk model of the 12 stars with 3 velocities. In contrast late type stars selected in the same manner (JJz(max)0.6, K14, 15) do not fit a rotating thin disk model. They exhibit a large scatter around the best fit disk model (right inset of Fig.16). A similar check can also be done with the counter-clockwise stars. However, because of the small inclination, the data are not as well constrained as in the clockwise subset.
We conclude that the dynamics of most early type stars can be well fit by two rotating and geometrically fairly thin disks. Levin and Boloborodov (2003) conclude from their analysis that the (clockwise) disk may be geometrically infinitely thin. Our own analysis suggests that a finite thickness, or moderate warping of the disks probably is probably still consistent with the data, especially for the counter-clockwise stars. Figure 17 summarizes the orientation of the two derived disks. The two disks are at large angles relative to each other, effectively counter-rotate, but do share a common projection of its rotation vector that is opposite to that of Galactic rotation (Fig.14, right inset). The clockwise disk is more compact, with a characteristic radius of 2-4”, while the conter-clockwise disk has a characteristic radius of 4-7”.
The stellar content of the two disks is essentially identical. Of the 14 clockwise stars with spectroscopic identifications in Ott et al. (2003), there are 4 Of/LBV, 5 WNL (7-9), 1 WNE (5/6) and 4 WCL (8/9) stars. Of the 12 spectroscopic counter-clockwise stars, there are 2 Of/LBV, 3 WNL and 6 WCL and 1 WCE (5/6). The agreement of the different subtypes of blue supergiants and Wolf-Rayet stars is remarkable. The lifetimes of these different subtypes is no more than a few hundred thousand years and the WC phase occurs just before explosion as supernova (Maeder & Meynet 1994). Hence the two disks must have formed at the same time, within less than 1 Myr.
The early type (‘S’-) stars in the ‘SgrA⋆ cluster’ () show a different angular momentum distribution (Fig.12, right panel). Keeping in mind that a few of these stars may only be projected to lie in the central arcsecond, the ‘SgrA⋆ cluster’ stars do not show an excess of tangential orbits. On the contrary, a more detailed analysis shows an excess of radial orbits (Genzel et al. 2000, Schödel et al. 2003). 54 () % of the 35 observed stars in the ‘SgrA⋆ cluster’ are on radial orbits. These stars are probably observed near the apoapse of their orbit (roughly twice the semi-major axis), where they spend most of their time. It is therefore likely that the radial stars are tightly bound to the black hole, with semi-major axes of order 20 mpc. This statistical inference, together with the direct derivation of semi-major axes of 10 mpc for the 6 stars in the inner cusp whose orbits were solved (Schoedel et al 2003), suggests that the Sgr A* cluster as a whole is tightly bound to the black hole. The orbital planes of those stars, as far as they are constrained by the current data, are significantly different from the two disk planes of the early type stars at 1”. For instance S2 has a clockwise angular momentum, but its orbital plane is 70o off the plane of the clockwise early type stars discussed above. Levin and Beloborodov (2003) have commented that such large offsets may be explained by relativistic Lense-Thirring precession of a star originally in the same plane as the stars further out.
In summary, we find compelling evidence from different arguments - KLF, spectra/narrow-band photometry, dynamics - that the stellar cusp centered on the massive black hole candidate SgrA⋆ does not primarily consist of old, low mass stars with properties similar to those found in the Galactic Bulge. Late type giants and horizontal branch, red clump stars seem to be less frequent. The cusp contains a suprising number of unrelaxed and apparently young, massive stars, including the very short lived HeI emission line stars with masses 30-100 M⊙ that reside in two rotating disks. This result is not consistent with theoretical expectations for a steady-state cusp, which predict that such a cusp should be dynamically relaxed (Bahcall & Wolf 1976, 1977, Murphy et al. 1991). The properties of the nuclear region are not consistent with static equilibrium. Episodic star formation and stellar transformations are required.
3.8 Mid-IR excess of S2: probing the accretion flow onto SgrA⋆?
Table 2 lists the H/Ks/L′ photometry of S2/SgrA∗ and 11 other stars in the central SgrA⋆ cluster as derived from the new NAOS/CONICA photometry. At H and Ks the peak emission of S2/SgrA∗ is definitely centered on S2 (and off SgrA⋆), and we can only deduce upper limits to the magnitudes of SgrA⋆ (Figure 3, Table 2). The H-Ks color of S2 (1.30.1 mag) compares well to the average value of the 11 other, H stars within 0.7′′ of SgrA⋆(H-K=1.42 0.03). This color is consistent with that of blue stars ({H-Ks}(0)=-0.04) behind the standard Galactic center K-band extinction of mag (Rieke, Rieke & Paul 1989), and thus is consistent with their being early type stars, as discussed above. However, the Ks-L′ color of S2+SgrA∗ (2.90.1 mag) is 0.65 mag redder than the same eleven stars (Ks-L). S2+SgrA⋆ thus has a significant L′ excess relative to stars with the same H-K colors (see also Clenet et al. 2003). Extrapolating from the average color of the nearby stars, the excess flux density corresponds to 4.9 mJy. Correcting for a K-band extinction of 3.2 mag, or an L′ extinction of 2.1 mag (Raab 2002: A(H)=5.1, A(Ks)=3.2 and A(L′)=2.1), the dereddened L′-band excess flux density of S2+SgrA⋆ is about 33 mJy. Gezari et al. (2002) and Ghez et al. (2003) find that the K-band flux density and spectrum of S2 is consistent with a O8/O9 main sequence star, which would have a mass of 15-20 , a bolometric luminosity of and a temperature of 35,000 K. Such a main sequence star would not be expected to have a very dense, dusty wind which could account for the observed L′ emission. What then causes the L′ excess of S2?
One obvious possibility is that the excess is due to emission from SgrA∗ itself in which case we have the first detection of the mid-infrared emission from the accretion region in the immediate vicinity of the black hole. This explanation may be supported by the spatial distribution of the L′ emission. The peak of the L′ emission is closer to SgrA∗ and the L′ emission of S2/SgrA∗ appears to be spatially extended (lower right inset of Fig.3). The FWHM of S2+SgrA∗ on the L′ Lucy-map (Fig.3) is 9570 mas (EW NS), compared to 70x70 mas for unresolved stars. Current models of the accretion flow predict that the infrared emission predominantly comes from the tail of the radio/submm synchrotron emission (Melia & Falcke 2001, Narayan et al. 1995, Falcke & Biermann 1999, Markoff et al. 2001, Liu & Melia 2002, Hawley & Balbus 2002). The infrared spectral energy distribution is inverted and the L′-band data provide valuable constraints on the iinnermost parts of the accretion zone. Our deduced L excess flux density is significantly larger than the values predicted by the various theoretical, ‘quiescent state’ models (Markoff et al. 2001, Liu & Melia 2002). The model that comes closest (within a factor of a few) is the jet-disk model of Markoff et al. (2001). Enhanced mid-IR emission at about the observed level is theoretically predicted to occur during flares, such as observed at X-rays (Baganoff et al. 2001).
Alternatively the mid-IR emission may come from dust in the accretion flow onto the black hole that is heated by the hot and luminous O star S2. We show in Appendix B that dust in the accretion flow onto SgrA∗ can be heated to sufficently high temperature by the ultra-violet radiation from S2 and can account for the L excess if
| (4) |
Here is the mass accretion rate onto the black hole and is the abundance of dust in the flow, relative to that in the interstellar medium. This mass accretion rate is in good agreement with a recent estimate (10-7 yr-1) based on the 10% linear polarization of SgrA⋆ in the mm-range (Bower et al. 2002). The estimated mass accretion rate also agrees with recent theoretical models of the SgrA⋆ spectral energy distribution, including its X-ray emission (Liu & Melia 2002, Markoff et al. 2001), but is two to three orders of magnitude lower than earlier models based on advection flows (ADAFs: Narayan, Yi & Mahdevan 1995) or Bondi flows (Melia 1992).
A definite test whether the observed L’-band excess is caused by S2 heating the accretion flow or by (variable) emission from the black hole flow itself will come from multi-epoch observations that we have begun on the VLT in the spring of 2003. The ’UV-heating’ model predicts that the excess emission should continue to be centered on S2 but should become dimmer as the star moves away from Sgr A. The SgrA∗ model in turn predicts that the mid-IR excess emission should be centered on the radio source, probably be polarized and strongly vary with time. First observations taken in March 2003 appear to favor that the source of the excess emission is SgrA∗ itself.
4
Discussion: The origin of the early type stars in
the cusp
In this section we will discuss how the massive and apparently young stars discussed in the last section may have come to reside in the dense central environment around the central massive black hole. The key questions are whether they can have formed in situ, or whether otherwise they might have migrated there from further out. We will discuss different possibilities that have been proposed and discussed in the literature during the last decade. We believe that our new dynamical data make a good case that a cloud collision mechanism is the most likely possibility for the formation of massive stars at 1-10” from the center, while a collision-merger model of smaller stars may be the most likely model for the formation of the ’S’-stars in the innermost region around the black hole.
First, the blue supergiants and Wolf-Rayet stars 1-10” from the center, and even more clearly the ’S’-stars in the SgrA* cluster cannot have migrated through two-body processes to their present location from large radii. The relaxation time of stars of mass is given by (e.g.Alexander 2002)
| (5) |
where is the mass enclosed within radius (in units of 10′′ or 0.38 pc) in units of , is the stellar mass in units of 10 and is the number of stars. In the central 10′′ the relaxation time is approximately independent of radius (for a cusp of radial exponent =1.4). This needs to be compared to the (main sequence) stellar lifetime (Genzel et al. 1994, Cox 2000),
| (6) |
Clearly, stars more massive than about 2.5 cannot have formed outside the central region and then mass-segregated through two-body relaxation to the central few arcseconds.
4.1 Current star formation in the mini-spiral?
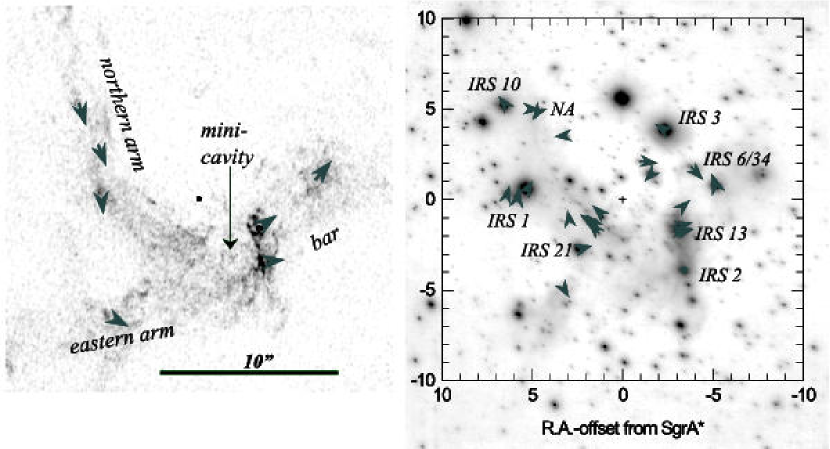
One possibility is that massive stars form continuously outside the dense central region and rapidly pass through the center on highly elliptical orbits. For instance, the northern arm of the mini-spiral appears to be on such a trajectory. The dusty sources associated with the gas might be candidates for young stars formed in and still embedded in their parental gas clouds. Becklin et al. (1978) were the first to propose that compact, mid-IR bright sources in the mini-spiral, such as IRS1, 2/13, 5 and 10 are compact HII regions surrounding intrinsically luminous (and hot) stars. Gezari et al. (1994) showed that these sources and also IRS21 are local dust temperature peaks in the mini-spiral and, therefore, must contain local luminosity sources. Based on the dust-excess, featureless near-IR spectra of the ‘mini-spiral sources’, Krabbe et al. (1995) and Ott et al. (1999) proposed that they might be young, recently formed stars embedded in the mini-spiral. IRS1, 5, 10 and 21 are, however, offset from the emission and temperature peaks of the diffuse dust in the mini-spiral ridge (Cotera et al. 1999). Tanner et al. (2002) carried out detailed Keck observations of the near- and mid-IR emission of IRS21 and proposed that this source is a luminous post-main sequence (Wolf Rayet) star. In the model of Tanner et al. IRS21 is just fortuitously near the gas/dust of the mini-spiral. Its extended dust emission is a bow shock created by the motion of the star into the mini-spiral. Comparison of the stellar proper motions of these mini-spiral sources with the proper motions of the gas derived from VLA images (Yusef-Zadeh et al. 1998, Zhao & Goss 1999) can distinguish between the ‘embedded young star’ and ‘older stars moving through gas/dust’ hypotheses. The results of this comparison are shown in Fig. 18.
The left panel of Fig. 18 shows a grey-scale 1.3cm radio image of the northern/eastern arms and the bar (Zhao & Goss 1998), along with some of the gas proper motion vectors deduced by Yusef-Zadeh et al. (1998). The bulk of the ionized gas in the northern arm, mini-cavity and bar is streaming south/south-west in a counter-clockwise pattern on the sky, and in the general sense of Galactic rotation (Lacy et al. 1991, Yusef-Zadeh et al. 1998). The gas streamers are in a plane, which is inclined 65o with respect to the line of sight (Lacy et al. 1991, Vollmer & Duschl 2000). The right panel shows the proper motion vectors of those stars in the Ott et al. sample that are not late type stars, are dusty, i.e. have a significant L′ excess (K-L′=2), and have K. These proper motions clearly demonstrate that most of the dusty mini-spiral L′ stars do not share the motion of the mini-spiral gas. As proposed by Tanner et al. (2002), they just happen to move through and interact with the mini-spiral gas/dust. IRS10 (W), several sources in the northern arm (NA), IRS1, IRS21, the IRS16 sources and sources in/near the bar (IRS 29/3/34) have proper motions that are inconsistent with the gas streaming vectors. In particular, the proper motion of IRS21 is fully consistent with the Tanner et al. (2002) bow shock model. One of the northern arm sources moving eastward into the northern arm in fact is associated with a bow-shock structure on the L′ map (source NA moving eastward in the right panel). In addition the spectrosopic data of Ott et al. (2003) indicate that several of the dusty sources indeed are late type, carbon-rich Wolf-Rayet (WC) stars. We thus conclude that there is little evidence for current star formation in the mini-spiral gas streamers. The only possible case for dusty stars moving along with the gas of the mini-spiral is the IRS13 complex. At the northern tip of the IRS13 complex is a group of compact L′ sources with a very large K-L′ excess, which may be candidates for deeply embedded and very young stars embedded in the bar (Eckart et al. 2003). The IRS13 complex may thus be a plausible candidate region for recent star formation in the gas streamers. It is not clear, however, whether IRS13/2 is actually part of the large scale, northern arm structure, or whether it is a separate dynamical feature in the bar (Vollmer & Duschl 2000).
If massive stars are forming frequently in dense gas streamers when outside the central parsec and then rapidly move through the central region, one would expect 100 times as many massive stars outside the central region as in the central parsec. Only a few such stars have so far been found in the central 10 pc, although complete surveys have been shallow (Figer 1995) and deeper searches were confined to known compact HII regions (Cotera et al. 1999). In the recent deeper spectroscopic work by Ott et al. (2003) no new emission line stars have been detected outside the known ’starburst region’ of diameter 25. With the possible exception of IRS13, a model in which massive stars are formed outside the dense central region and just pass through the center on highly elliptical orbits does not seem to be supported by the observations. Most of the bright dusty sources associated with the mini-spiral are not embedded ‘protostars’.
4.2 Infall of young, massive star clusters
To overcome the long time scales implied by two-body relaxation, Gerhard (2001) proposed that a young star cluster spiraled into the nucleus through dynamical friction, and made it to the central parsec before it was tidally disrupted there. Portegies Zwart, McMillan & Gerhard (2003), have shown by more detailed numerical simulations that the Gerhard scenario is feasible. It requires that such a cluster has to be very massive (104 ) and dense (and thus compact: 0.2-0.4 pc) to spiral into the center within the lifetime of its O-stars (a few Myrs), core collapse and arrive there before dissolving completely. The dynamical friction time scales inversely with the cluster mass so that a 105 -106 cluster can spiral into the center from parsec-scale distances in a few Myrs. The two known (non-nuclear) young star clusters in the central 30 pc, the Quintuplet and Arches clusters, have a diameter of pc and a mass of a few (extrapolating the observed stellar content to 1 ; Figer 2002). The N-body simulations by Portegies Zwart et al. (2003) show that a cluster of mass 6x10⁴ and diameter pc could make it into the central parsec within the available time from an initial radius of 4–5 pc, but not from further out. The in-spiraling cluster maintains its orbital angular momentum direction and the tidally disrupted final remnant of such a cluster resembles a thin rotating disk, similar to what we observe. However, the final radius reached by the dissolving cluster in the simulation by Portegies Zwart et al. (2003) is 1-2 pc, significantly larger than the characteristic radius of either one of the two rotating disks of young stars (0.1-0.4 pc). Further, there is presently no observational evidence for such dense ( cm-3), compact and massive molecular concentrations within a few parsec of the nucleus (Mezger et al. 1996). Several molecular clouds are located at distances pc from the center (Mezger et al. 1996). At that radius the tidal requirements are much reduced, although a cluster that formed efficiently from such a cloud must still have been very compact to rapidly core collapse und thus make it intact into the central region. Finally the fact that we see two such disks, with different angular momenta, requires that two massive clusters fell in at about the same time (and none later). This is statistically unlikely. We conclude that the ’infalling cluster’ scenario, while attractive, fails to match the specific properties of the two rotating disks of young stars in the Galactic center.
4.3 In situ formation from dense gas
The third possibility is that stars formed in situ from cloud collapse, following the infall of (a) dense gas cloud(s). Several molecular and ionized gas clouds are detected in the central parsec, several with large radial velocities, and a few even with the correct (and anti-Galactic) angular momentum (Jackson et al. 1993, Lacy et al. 1991, Genzel et al. 1996). The mass in the presently observed circum-nuclear molecular material is several 104 M⊙. This is amply sufficient to account for the massive star content in the 2-7 Myr starburst component 1-10” from the center (one to a few thousand solar masses, Krabbe et al. 1995). It may also be sufficient to account for formation of lower mass stars with a Salpeter-like, mass function if the star formation efficiency is sufficiently high. For self-gravity in interstellar clouds to overwhelm the tidal shear and create of stars in the 2-7 Myr starburst component, however, requires gas densities of 5 to 10 hydrogen atoms cm-3. This is several thousand times greater than the density of gas clumps currently found in the atomic and molecular gas clouds in the central 1-2 pc ( cm-3, Jackson et al. 1993, Genzel et al. 1994). For the ‘S’-stars bound to the black hole within the central arcsecond the required gas densities are even more extreme ( 1013.5 cm-3). Hence gas clumps naturally occuring in known circum-nuclear gas would have to be compressed very substantially before they can collapse to form stars. A cloud-cloud collision and shocks resulting from it, as well as the action on that gas by stellar winds in the central region may be possible agents for achieving such compressions (Morris 1993). Some evidence for large compression and the action of winds come from high resolution radio maps (Yusef-Zadeh et al. 1998) and the new NAOS/CONICA L′ images (Fig. 1, 18, Clénet et al. 2003). The L′ image exhibits sharp (diameter ) filaments, plausibly caused by the interaction of the mini-spiral streamers with the outflows and winds from the central few arcseconds.
There are no published simulations of such a cloud collision near a black hole but it is clear qualitatively that the cooling, post-shock material would have lost a lot of its original angular momentum and settle in a disk circulating around the hole. Subsequently the disk could loose additional angular momentum through magnetic friction (Hawley & Balbus 2001) or interaction with the stellar winds in the central parsec. Through that angular momentum transport the gas disk could then slowly contract and eventually become dense enough in its inner parts to form stars (e.g. Levin and Boloborodov 2003, Nayakshin et al. 2003).
We cannot quantitatively evaluate this scenario at the present time but conjecture that it has two natural and critical features matching our new observations. First a cloud collision is a sudden compression that may trigger a burst of star formation. Second the two colliding clouds would plausibly move in rather different directions and would be compressed at the same time, thus leading to coeval star formation in the post-shock gas of both clouds. If the splashing, shocked gas retains some memory of the original cloud momenta, the gas might settle in two, counter-rotating disks. We therefore think that the ’colliding clouds’ model is qualitatively very attractive for explaining the two counter-rotating and coeval massive star disks 1-10” from SgrA∗. Obviously a realistic hydrodynamical simulation of such a cloud collision in the gravitational potential of a massive black hole should be carried out for testing the notion that a cloud collision can lead to two separate rotating disks. If that turns out to not be the case, one would have to resort to a model in which two clouds happened to fall into the center at the same time, and then gradually lost angular momentum and contracted until they could form stars. This scenario suffers from the same problem of low statistical probability as for the two in-spiraling star clusters.
4.4 The ‘S’-stars near SgrA⋆: super-blue stragglers?
Another possibility is that the massive stars are continuously formed through mergers of lower mass stars. In this case the massive early type stars may be old stars that have been rejuvenated in the very dense environment of the cusp (Morris 1993, Genzel et al. 1994, Lee 1994, Alexander 2002). The probability for massive stars to be formed in this way can be qualitatively assessed by comparing the collision time scale between stars of different masses with their lifetime. Since the collisional time scale increases but the stellar lifetime decreases with mass, the maximum stellar mass formed in a merger tree occurs roughly when the two time scales are equal. As shown analytically in Appendix A, 10 stars can plausibly be formed in this way in the innermost cusp, within a few tenths of an arcsecond of SgrA⋆, if the merger efficiency in high velocity collisions is high and if angular momentum of the rapidly rotating merger is efficiently removed. The ‘S’-stars in the ‘SgrA⋆ cluster’ may thus be collisional products. They may be ’super-blue stragglers’. similar to but much more massive than those found in globular clusters (Bailyn 1995). However, the more massive ‘HeI’ emission line stars (30-100 ) 1-12′′ from SgrA⋆ clearly cannot have been formed this way, in agreement with the more detailed Fokker-Planck calculations of Lee (1994).
Another predicted effect of stellar collisions in the cusp is the destruction of late type giants (Alexander 1999, 2002). We show in Appendix A that within the central 1′′ near-central collisions occur between late type giants and solar mass stars within a giant’s lifetime. If such collisions permanently destroy the giant’s envelope, one would expect that the density of late type giants decreases in the central few arcsecs. We have shown above (Figs. 7) that the fraction of K giants in fact appears lower within the central , which is in agreement with the collider model and the earlier conclusions of Alexander (1999).
5
Conclusions
We have presented a new analysis of the properties of the star cluster in the central 10” of our Milky Way, based on deep, near-IR adaptive optics imaging with NAOS/CONICA on the ESO VLT, and a new data base of stellar proper motions. Our main results can be summarized as follows.
-
1.
The faint stars form a power-law cusp centered on the massive black hole SgrA∗. Our observations resolve the long-standing paradox of why the infrared light distribution peaks away from the position of SgrA∗. The stellar density in the central arcsecond exceeds 3107M⊙pc-3. Stellar collisions are expected to be frequent.
-
2.
The shape of the K-band luminosity function of the central par is consistent with the properties of an old, metal rich star cluster, with an admixture of massive young stars.
-
3.
K-band luminosity function, faint number counts and late type star fraction in the central few arcseconds suggest that stellar content and properties change significantly in the dense innermost cusp. To the K15 magnitude limit reached by spectra and proper motions, the cusp is dominated by massive, early type stars.
-
4.
The K15 early type stars, similar to the brightest ’HeI emission line stars’ studied over the past decade, are dynamically unrelaxed and thus must be young. Most of the early type stars in the central 10 arcseconds appear to reside in two fairly thin, rotating disks. These disks orbit the black hole, are inclined at large angles and counter-rotate with respect to each other. The two star disks have essentially the same stellar content and thus must have formed coevally, within less than 1 Myr.
-
5.
Of the various proposals how the massive stars have made it into the central 1-10” our new observations, and in particular the pattern of two coeval rotating disks of massive stars, now appear to favor in situ formation following the collision of gas clouds. We propose that two dense and moderately massive (a few 103 to 104 M⊙) interstellar clouds fell into the central parsec and collided there about 5-8 million years ago. The shock-compressed gas then settled in two, counter-rotating disks which probably subsequently lost further angular momentum, moved inwards and finally became gravitationally unstable and formed stars.
-
6.
In contrast to the massive stars at =1-10”, the early type stars in the ’SgrA∗ cluster’ (the ’S’-stars) in our opinion are most likely formed as a result of collisions and mergers of lower mass stars, in analogy to the blue straggler phenomenon in globular clusters.
-
7.
The star closest to the black hole in 2002, S2, exhibits a mid-infrared excess. We propose that this excess is caused either by infrared emission from the accretion region around SgrA∗ itself, or by the interaction of the star’s UV light with dust in the accretion flow onto the black hole. In the latter case, the lower limit to the accretion rate 10-40 mas (1400-5700 Schwarzschild radii) from the hole is about 10-7 M⊙ yr-1.
Appendix A Build-up of massive stars by collisions and mergers
Following Alexander (1999), the time scale for the collision of a star of mass with another star of mass (), with stellar radii and , at an average radius R(arcsec) from SgrA⋆ can be expressed as
| (A1) |
where the normal geometric cross section (g) and gravitational focusing (f) terms have been modified by average correction factors and to account for orbit averaging. The factor describes how off-center the collision is relative to the center of star 1 ( is central, is grazing). We assume that the stellar density distribution is described by
| (A2) |
where is the average stellar mass for a Salpeter mass function between 0.5 and 20 R1 is the separation from SgrA∗ in arcseconds. To normalize the last equation, we have taken a broken power law density distribution () with an exponent inside and 2 outside, and with the mass normalization discussed in section 3.2 (Genzel et al. 1996). The density of collision partner then can be expressed as , where is the fraction of stars in mass bin . The one dimensional velocity dispersion scales with radius from the black hole of mass M∙=3x10 as (Alexander 1999)
| (A3) |
For main sequence stars of mass we take the standard radius-mass relationship (Cox 2000)
| (A4) |
For Alexander (1999) finds 2.08 and , which reflects the fact that of the cusp stars are bound to the black hole and thus, that they spend significant time at where the collisions are more frequent. For collisions to be effective, they have to occur within the lifetime of the star . We take the mass dependence of the main sequence lifetime to be (Genzel et al. 1994)
| (A5) |
Collisions are effective for forming a star of mass from the merger of and if
| (A6) |
For grazing collisions of two main sequence stars the collision time is
| (A7) |
For the radius within which then is about . If the merging efficiency is high for grazing collisions (c.f. references in Genzel et al. 1994), is then also the radius within which many 1 stars continuously merge to 2 stars. The ‘S’-sources require collisions and merging of more massive stars, however. For ( merger product) is about , or for . Obviously a more realistic calculation of the entire merger tree is desirable but our estimate already suggests that the merger model predicts a significant number of 10 stars to occur within the SgrA⋆ cluster zone. Our estimates obviously require that the merging efficiency is high and that the angular momentum of the -initially- rapidly rotating merger remnant is removed quickly. Very little is known theoretically about the merging efficiencies in high velocity collision domain that characterizes the Galactic center but naively one would expect that they should be low. However recent SPH simulations of stellar collisions at high velocities by one of us (T.A.) suggest that merging efficiencies may be surprisingly large under a fairly wide range of conditions. How angular momentum is transported away in stellar mergers is not understood quantitatively (Sills & Bailyn 1999, Sills et al. 2001). Qualitatively it is thought that some sort of magnetic breaking, either through a wind/outflow, or through a locked circumstellar disk is efficient (Sills et al. 2001). Blue stragglers are obviously formed in significant numbers in globular clusters, indicating that nature has found a way to solve the angular momentum problem (Bailyn 1995). In the one case where a rotation velocity is measured (Shara, Saffer & Livio 1997), the rotation is moderately fast (vrotsin (i)=155 km/s) but significantly below breakup. The deduced rotation velocity of S2 (224 km/s) is also not unusual for a normal late O star (Ghez et al. 2003).
Another predicted effect of the collision model in the cusp (Alexander & Livio 2001; Alexander & Kumar 2001; Alexander 2002; Alexander & Morris 2003) is the destruction of late type giants . Again we apply the above equations with , and assume that near-central collisions () between a giant and a low mass, dwarf star result in the permanent destruction of the giant’s envelope (Davies et al. 1998, Alexander 1999). Bright red giants (M1 to K5: K) have a lifetime of about 10% of and a radius of 20-80 (Cox 2000). The collision time then is
| (A8) |
and 1 occurs within for a 50 giant. In this regime scales approximately with so that destruction occurs at even greater radii for the even larger AGB stars and if the envelope is destroyed at more off-center collisions. We have shown above (Fig. 7) that the fraction of K giants decreases within the central , in good agreement with the collider model and the earlier conclusions of Alexander (1999).
Appendix B Heating of dust in the accretion flow by UV radiation from S2
We show here that the mid-IR excess emission of S2/SgrA∗ may come from dust in the accretion flow (onto the black hole) that is heated by the hot and luminous O star S2. The UV dust optical depth of this flow can be estimated from
| (B1) |
Here is the mass accretion rate onto SgrA⋆, R ( pc) is the distance of S2 from SgrA is the mean molecular weight (3.4x10⁻²⁴ g), is the velocity of the accretion flow, is the radius of the dust column from S2, and is the fraction of dust (relative to the normal interstellar medium) that is not destroyed due to the accretion shock in the hot accretion flow near S2. The temperature the dust particles attain is given from the heating-cooling balance,
| (B2) |
For dust particles with wavelength dependent extinction efficiency and normal interstellar dust parameters, , , and cm (Scoville & Kwan 1976). For simplicity we assume further that the emission at is dominated by those dust particles whose temperature at is equal to the Wien temperature . For a late O star the UV luminosity is about half of the bolometric luminosity, such that cm. The emitted flux density of this hot dust cloud around the O/B star then is
| (B3) |
for an assumed 8 kpc distance to the Galactic Center. Comparison to the observed flux density implies . For km/s we find
| (B4) |
Dust destruction in fast shocks is mostly due to sputtering. It strongly depends on the pre-shock gas density and leads to a deficiency of small grains (Dwek, Foster & Vancura 1996). For the gas densities in the pre-accretion shock region in the Galactic Center (between 0.1 to 10 cm-3 at R=1”) we estimate from the models of Dwek et al. that 15 to 70% of the dust is destroyed.
References
- 1 Alexander, T. 1999, ApJ, 527, 835
- 2 Alexander, T., 2002, in The Galactic Black Hole, eds. H. Falcke & F. W. Hehl, (Institute of Physics), ch. 9
- 3 Alexander, T. & Kumar, P. 2001, ApJ, 549, 948
- 4 Alexander, T., & Livio, M. 2001, ApJ, 560, L143
- 5 Alexander, T., & Morris, M., 2003, ApJL, submitted
- 6 Alexander, T., & Sternberg, A., 1999, ApJ, 520, 137
- 7 Allen, D.A & Sanders, R.H. 1986, Nature, 319, 191
- 8 Allen, D.A., Hyland, A.R. & Hillier, D.J. 1990, MNRAS, 244, 706
- 9 Allen, D. A., 1994, in The Nuclei of Normal Galaxies, eds. R.Genzel & A.I.Harris, Kluwer:Dordrecht, NATO ASI 445, 293
- 10 Backer, D.C. & Sramek, R.A., 1999, ApJ, 524, 805
- 11 Baganoff, F.K., et al., 2001, Nature 413, 45
- 12 Bahcall, J. N., & Wolf, R. A., 1976, ApJ, 209, 214
- 13 Bahcall, J. N., & Wolf, R. A., 1977, ApJ, 216, 883
- 14 Bailyn, C. D., 1995, ARA&A, 33, 133
- 15 Becklin, E.E., Mathews, K., Neugebauer, G. & Willner, S.P. 1978, ApJ, 219, 121
- 16 Blum, R. D., Sellgren, K., & DePoy, D. L. 1996a, ApJ, 470, 864
- 17 Blum, R.D., Sellgren, K. & DePoy, D.L. 1996b, AJ, 112, 1988
- 18 Bower, G. et al. 2003, in press
- 19 Brandner, W. et al., NAOS+CONICA at YEPUN, 2002, The ESO Messenger, 107, 1
- 20 Catchpole, R. M., Whitelock, P. A. & Glass, I. S., 1990, MNRAS, 247, 479
- 21 Chakrabarty, D. & Saha, P. 2001, AJ, 122, 232
- 22 Clenet, Y., Rouan, D., Gendron, E., Montri, J., Rigaut, F., Lena, P. & Lacombe, F. 2001, A&A, 376, 124
- 23 Clénet, Y., Rouan, D. et al. 2003, Astr.Ap. submitted
- 24 Cotera, A.S., Simpson, J.P., Erickson, E.F., Colgan, S.W.J., Burton, M.G. & Allen, D.A. 1999, ApJ, 510, 747
- 25 Cox, A.N. (ed.), 2000, Allen’s Astrophysical Quantities, Springer:Berlin, ch.15
- 26 Davidge, T.J., Simons, D.A., Rigaut, F., Doyon, R. & Crampton, D. 1997, AJ, 114, 2586
- 27 Davies, M.B. & Benz, W. 1991, ApJ, 381, 449
- 28 Davies, M.B., Blackwell, R., Bailey, V.C., & Sigurdsson, S. 1998, MNRAS, 301, 745
- 29 Doeleman, S.S. et al. 2001, A.J. 121, 2610
- 30 Dwek, E., Foster, S.M. & Vancura, O. 1996, ApJ, 457, 244
- 31 Eckart, A., Genzel, R., Hofmann, R., Sams, B.J. & Tacconi-Garman, L.E. 1993, ApJ, 407, L77
- 32 Eckart, A. & Genzel, R., 1996, Nature, 383, 415
- 33 Eckart, A., & Genzel, R., 1997, MNRAS, 284, 576
- 34 Eckart, A., Ott, T., & Genzel, R., 1999, A&A, 352, 22
- 35 Eckart, A., Genzel, R., Ott, T. & Schoedel, R., 2002, MNRAS, 331, 917
- 36 Eckart, A. et al. 2003, in prep.
- 37 Eckart, A. , Genzel, R., Hofmann, R., Sams, B. J. & Tacconi-Garman, L. E., 1995, ApJ, 445, L2
- 38 Falcke, H. & Biermann, P.L. 1999, A&A, 342, 49
- 39 Figer, D.F. 1995, Ph.D. Thesis, University of California, Los Angeles
- 40 Figer, D.F., Najarro, F., Morris, M., McLean, I.S., Geballe, T.R., Ghez, A. & Langer, N. 1998, ApJ, 506, 384
- 41 Figer, D.F., Kim, S.S., Morris, M., Serabyn, E., Rich, R.M. & McLean, I.S. 1999, ApJ, 525, 750
- 42 Figer, D. F., et al., 2000, ApJ, 533, L49
- 43 Figer, D.F. 2002, Proc.IAU 212 in press (astro-ph 0207300)
- 44 Forrest, W.J., Shure, M.A., Pipher, J.L. & Woodward, C.A. 1987, in The Galactic Center, AIP Conf.Proc.155, ed.D.Amer.Inst.of Phys.: New York, 153
- 45 Genzel, R. 2001, in Dynamics of Star Clusters and the Milky Way, ASP Conf.Ser. 228, eds. S.Deiters, B.Fuchs, R.Spurzem, A.Just & R.Wielen, Astr.Soc.of the Pacific:San Francisco, 291
- 46 Genzel, R., Hollenbach, D., & Townes, C. H., 1994, Rep. Prog. Phys., 57, 417
- 47 Genzel, R., Thatte, N., Krabbe, A., Kroker H. & Tacconi-Garman, L. E. 1996, ApJ, 472, 153
- 48 Genzel, R., Eckart, A., Ott, T. & Eisenhauer, F. 1997, MNRAS, 291, 21
- 49 Genzel, R., Pichon, C., Eckart, A., Gerhard, O. & Ott, T., 2000, MNRAS, 317, 348
- 50 Gerhard, O., 2001, ApJ, 546, L39
- 51 Gezari, D., Dwek, E.& Varosi, F. 1994, in The Nuclei of Normal Galaxies, eds. R.Genzel & A.I.Harris, Kluwer:Dordrecht, NATO ASI 445, 343
- 52 Gezari, S., Ghez, A. M., Becklin, E. E. , Larkin, J., McLean, I. S., Morris, M. 2002, ApJ, 576, 790
- 53 Ghez, A. M., Klein, B. L., Morris, M., & Becklin, E. E. 1998, ApJ, 509, 678
- 54 Ghez, A. M., Morris, M., Becklin, E. E., Tanner, A. & Kremenek T., 2000, Nature, 407, 349
- 55 Ghez, A. et al. 2003, Ap.J 586, L127
- 56 Haller, J.W., Rieke, M.J., Rieke, G.H., Tamblyn, P., Close, L. & Melia, F. 1996, ApJ, 456, 194
- 57 Hawley, S. & Balbus, S.A. 2002, ApJ, 573, 738
- 58 Hornstein, S.D., Ghez, A., Tanner, A., Morris, M., Becklin, E.E. & Wizinovich, P. 2002, ApJ in press (astro-ph 0208239)
- 59 Jackson, J.M., Geis, N., Genzel, R., Harris, A.I., Madden, S., Poglitsch, A., Stacey, G.J. & Townes, C.H. 1993, ApJ, 402, 173
- 60 Krabbe, A., Genzel, R., Drapatz, S. & Rotaciuc, V. 1991, ApJm 382, L19
- 61 Krabbe, A., et al., 1995, ApJ, 447, L95
- 62 Lacy, J.H., Achtermann, J.M. & Serabyn, E. 1991, ApJ, 380, 71
- 63 Lebofsky, M.J. & Rieke, G.H. 1987, in The Galactic Center, AIP 155, ed. D.Backer, Amer.Inst.Phys: New York, 79
- 64 Lee, H.M. 1994, in The Nuclei of Normal Galaxies, eds. R.Genzel & A.I.Harris, Kluwer:Dordrecht, NATO ASI 445, 335
- 65 Lenzen, R., Hofmann, R., Bizenberger, P. & Tusche, A. 1998, Proc.SPIE IR Astr.Instr. (ed.A.M.Fowler), 3354, 606
- 66 Levin, Y. & Beloborodov, A.M. 2003. Ap.J. in press (astro-ph 0303436)
- 67 Liu, S. & Melia, F. 2002, ApJ, 566, L77
- 68 Lo, K.Y. & Claussen, M.J. 1983, Nature, 306, 647
- 69 Lucy, L.B. 1974, AJ, 79, 745
- 70 Maeder, A. & Meynet, G. 1994, Astr.Ap.287, 803
- 71 Markoff, S., Falcke, H., Yuan, F. & Biermann, P.L. 2001, A&A, 372, L25
- 72 McGinn, M.T., Sellgren, K., Becklin, E.E. & Hall, D.N.B., 1989, ApJ, 338, 824
- 73 Melia, F. 1992, ApJ, 387, L25
- 74 Melia, F. & Falcke, H. 2001, ARAA, 39, 309
- 75 Mezger, P.G., Duschl, W.J. & Zylka, R. 1996, Astr.&Ap.Rev.7, 289
- 76 Morris, M., 1993, ApJ, 408, 496
- 77 Morris, M., & Serabyn, E., 1996, ARA&A, 34, 645
- 78 Mouawad, N. & Eckart, A. 2003, in preparation
- 79 Murphy, B. W., Cohn, H. N., Durisen, R. H., 1991, ApJ, 370, 60
- 80 Najarro, F., Krabbe, A., Genzel, R., Lutz, D., Kudritzki, R. P. & Hillier, D. J., 1997, A&A, 325, 700
- 81 Narayan, R., Yi, I. & Mahadevan, R. 1995, Nature, 374, 623
- 82 Nayakshin, S., Cuadra, J. & Sunyaev, R. 2003, Astr.Ap. in press (astro-ph 0304126)
- 83 Ott, T., Eckart, A. & Genzel, R., 1999, ApJ, 523, 248
- 84 Ott, T., Genzel, R., Eckart, A. & Schoedel, R., 2003, in preparation
- 85 Paumard, T., Maillard, J. P., Morris, M. & Rigaut, F., 2001, A&A, 366, 466
- 86 Portegies Zwart, S.F., McMillan, S.L.W. & Gerhard, O. 2003, Ap.J.(Lett.) in press
- 87 Raab, W. 2002, Ph.D. Thesis, Ludwig-Maximilians Universität München
- 88 Rasio, F.A. & Shapiro, S.L. 1990, ApJ, 354, 201
- 89 Reid, M. J. 1993, ARA&A, 31, 345
- 90 Reid, M.J., Readhead, A.C.S., Vermeulen, R.C. & Treuhaft, R., 1999, ApJ, 524, 816
- 91 Reid, M. J., Menten, K.M, Genzel, R., Itt, T., Schödel, R. & Eckart, A. 2003a, ApJ 587, 208
- 92 Reid, M.J., Menten, K.M., Gnezel, R., Ott, T., Schödel, R. & Brunthaler, A. 2003b, Astr.Nachr. 324, S1, 3
- 93 Rieke, G.H., Rieke, M.J. & Paul, A.E. 1989, ApJ, 536, 752
- 94 Rieke, G.H & Rieke, M.J. 1994, in The Nuclei of Normal Galaxies, eds. R.Genzel & A.I.Harris, Kluwer:Dordrecht, NATO ASI 445, 283
- 95 Rousset, G. et al. 1998, Proc.SPIE Adapt.Opt.Tech., eds. D.Bonaccini & Tyson, R.K., 3353, 508
- 96 Schoedel, R.et al., 2002, Nature, 419, 694
- 97 Schoedel, R., Ott, T., Genzel, R. et al., 2003, ApJ submitted
- 98 Scoville, N.Z. & Kwan, J. 1976, ApJ, 206, 718
- 99 Sellgren, K., McGinn, M.T., Becklin, E.E. & Hall, D.N.B. 1990, ApJ, 359, 112
- 100 Shara, M., Saffer, R. & Livio, M. 1997, ApJ, 489, L59
- 101 Sills, A., & Bailyn, C. D., 1999, ApJ, 513, 428
- 102 Sills, A., Faber, J.A., Lombardi, J.C.Jr., Rasio, F.A. & Warre, A.R. 2001, ApJ, 548, 323
- 103 Tamblyn, P., Rieke, G. H., Hanson, M. M., Close, L. M., McCarthy, D. W. & Rieke, M. J., 1996, ApJ, 456, 206
- 104 Tanner, A., Ghez, A., Morris, M., Becklin, E.E., Cotera, A., Ressler, M, Werner, M.W.& Wizinovich, P.2002, ApJ, 575, 860
- 105 Thorne, K.S. & Zytkov, A.N. 1975, ApJ, 199, 19
- 106 Tiede, G. P., Frogel, J. A., & Terndrup, D. M., 1995, AJ, 110, 2788
- 107 Vollmer, B. & Duschl, W. 2000, New Astr. 4, 581
- 108 Young, P., 1980, ApJ, 242, 1232
- 109 Yusef-Zadeh, F., Roberts, D.A. & Biretta, J. 1998, ApJ, 499, L159
- 110 Zhao, J.H. & Goss, W.M. 1998, ApJ 499, L163
- 111 Zhao, J.H. & Goss, W.M. 1999, in The central Parsecs of the Galaxy, ASP Conf. 186, eds. H.Falcke, A.Cotera, W.J.Duschl, F.Melia & M.J.Rieke, Astr.Soc.Pacif.: San Francisco, 224
- 112 Zoccali, M., et al., 2002, A&A, in prep.
| Completeness [%] | |||
|---|---|---|---|
| 13 | 13.05 | 0.03 | 99 |
| 14 | 14.04 | 0.05 | 98 |
| 15 | 15.04 | 0.07 | 95 |
| 16 | 16.04 | 0.09 | 88 |
| 17 | 17.04 | 0.11 | 79 |
| 18 | 18.01 | 0.17 | 63 |
| 19 | 18.91 | 0.22 | 32 |
| 20 | 19.76 | 0.23 | 4 |
| magnitude limit | =0.21: | |||||
|---|---|---|---|---|---|---|
| K 18.5: A0V/3.5 | 114 | 3 | 0.4 | 189 | 4 | 0.6 |
| K 19.5: A5V/2.2 | 185 | 4 | 0.7 | 423 | 10 | 1.4 |
| K 21: G1/2V/1.0 | 383 | 9 | 1.3 | 1416 | 33 | 5 |
| K 23: M0V/0.5 | 1000 | 24 | 3.4 | 7100 | 166 | 23 |
| source | H-Ks | Ks-L’ | |||||||||
|---|---|---|---|---|---|---|---|---|---|---|---|
| SgrA⋆ | 0 | 0 | 18.4 | 0.3 | 16.6 | 0.3 | 11.7 | 0.5 | |||
| S2+SgrA⋆ | 0.02 | 0.04 | 15.36 | 0.1 | 14.01 | 0.1 | 11.12 | 0.1 | 1.3 | 2.9 | |
| S1 | -0.05 | -0.18 | 16.1 | 0.1 | 14.79 | 0.12 | 12.86 | 0.2 | 1.3 | 1.9 | |
| S4 | 0.25 | 0.13 | 15.74 | 0.1 | 14.42 | 0.1 | 12.60 | 0.13 | 1.3 | 1.8 | |
| S12 | -0.08 | 0.27 | 16.88 | 0.1 | 15.58 | 0.1 | 13.99 | 0.15 | 1.3 | 1.6 | |
| S9 | 0.17 | -0.34 | 16.55 | 0.1 | 15.17 | 0.12 | 12.95 | 0.1 | 1.4 | 2.2 | |
| S10 | 0.050 | -0.37 | 15.78 | 0.1 | 14.23 | 0.1 | 12.14 | 0.1 | 1.5 | 2.1 | |
| S8 | 0.36 | -0.24 | 15.89 | 0.1 | 14.52 | 0.1 | 12.63 | 0.12 | 1.4 | 1.9 | |
| S5 | 0.46 | 0.10 | 16.92 | 0.1 | 15.44 | 0.12 | 13.29 | 0.2 | 1.5 | 2.2 | |
| S7 | 0.51 | -0.03 | 16.70 | 0.11 | 15.34 | 0.14 | 12.63 | 0.13 | 1.4 | 2.7 | |
| S11 | 0.15 | -0.55 | 15.78 | 0.1 | 14.43 | 0.1 | 12.43 | 0.12 | 1.4 | 2.0 | |
| IRS16SWNW | 0.53 | -0.43 | 14.88 | 0.1 | 13.41 | 0.1 | 11.65 | 0.1 | 1.5 | 1.8 | |
| 0.51 | 0.45 | 16.37 | 0.1 | 15.13 | 0.1 | 13.20 | 0.11 | 1.2 | 1.9 |