11email: aage@astro.su.se 22institutetext: Onsala Space Observatory, SE-439 92 Onsala, Sweden 33institutetext: Laboratoire d’Astronomie Spatiale, BP 8, FR-13376 Marseille CEDEX 12, France 44institutetext: Department of Physics, University of Waterloo, Waterloo, ON N2L 3G1, Canada 55institutetext: LERMA & FRE 2460 du CNRS, Observatoire de Paris, 61, ave de l’Observatoire,, FR-75014 Paris, France 66institutetext: LERMA & FRE 2460 du CNRS, Ecole Normale Supérieure, 24 rue Lhomond, FR-75005 Paris, France 77institutetext: Herzberg Institute of Astrophysics, 5071 West Saanich Road, Victoria, BC V9E 2E7, Canada 88institutetext: Swedish Space Corporation, P. O. Box 4207, SE-171 04 Solna, Sweden 99institutetext: Department of Physics and Astronomy, McMaster University, Hamilton, ON L8S 4M1, Canada 1010institutetext: Observatory, P. O. Box 14, University of Helsinki, FI-00014 Helsinki, Finland 1111institutetext: Department of Physics and Astronomy, University of Calgary, Calgary, AB T2N 1N4, Canada 1212institutetext: LESIA, Observatoire de Paris, Section de Meudon, 5, Place Jules Janssen, FR-92195 Meudon CEDEX, France 1313institutetext: Metsähovi Radio Observatory, Helsinki University of Technology, Otakaari 5A, FI-02150 Espoo, Finland 1414institutetext: Department of Astronomy and Physics, Saint Mary’s University, Halifax, NS B3H 3C3, Canada 1515institutetext: Swedish National Space Board, Box 4006, SE-171 04 Solna, Sweden 1616institutetext: CESR, 9 Avenue du Colonel Roche, B.P. 4346, FR-31029 Toulouse, France
Odin observations of H2O in the Galactic Centre††thanks: Based on observations with Odin, a Swedish-led satellite project funded jointly by the Swedish National Space Board (SNSB), the Canadian Space Agency (CSA), the National Technology Agency of Finland (Tekes) and Centre National d’Etude Spatiale (CNES). The Swedish Space Corporation was the industrial prime contractor and is also responsible for the satellite operation.
The Odin satellite has been used to detect emission and absorption in the 557-GHz HO line in the Galactic Centre towards the Sgr Circumnuclear Disk (CND), and the Sgr A +20 km s-1 and +50 km s-1 molecular clouds. Strong broad H2O emission lines have been detected in all three objects. Narrow H2O absorption lines are present at all three positions and originate along the lines of sight in the 3-kpc Spiral Arm, the 30 km s-1 Spiral Arm and the Local Sgr Spiral Arm. Broad H2O absorption lines near km s-1 are also observed, originating in the Expanding Molecular Ring. A new molecular feature (the “High Positive Velocity Gas” - HPVG) has been identified in the positive velocity range of +120 to +220 km s-1, seen definitely in absorption against the stronger dust continuum emission from the +20 km s-1 and +50 km s-1 clouds and possibly in emission towards the position of Sgr CND. The 548-GHz HO isotope line towards the CND is not detected at the 0.02 K (rms) level.
Key Words.:
Galaxy: center – ISM: individual objects: Sgr A – ISM: molecules – ISM: cloudsAage Sandqvist,
1 Introduction
The central region of the Galaxy has been extensively studied at wavelengths between the near infrared and the radio portions of the spectrum (see reviews by Morris & Serabyn mor96 (1996); Mezger et al. mez96 (1996)) as well as at -ray and X-ray wavelengths. The molecular clouds dominate the interstellar medium in the inner 500 pc ( pc) of the Galaxy and the density of molecular clouds is far higher in this region than in any other part of the Galaxy. Although it represents less than 0.2% of the Galactic disk by volume, nearly 10% of the total Galactic molecular mass is found here. A dominant feature in this region is the inclined Expanding Molecular Ring (EMR, e.g. Güsten gus89 (1989)). Another feature closer to the Centre is Sgr B2 which is the most prominent and massive concentration of molecular gas (GMC) and star formation in the entire Galaxy. Neufeld et al. (neu00 (2000)) have observed both HO and HO towards this source using the Submillimetre Wave Astronomy Satellite (SWAS). A dust ridge connects Sgr B2 to the regions closer to the Centre (Lis & Carlstrom lis94 (1994)). The very central Sgr A Complex consists of a nonthermal shell component, Sgr A East, and a thermal component, Sgr A West. The source Sgr A West, with its “mini-spiral arms”, consists of infalling gas (Killeen & Lo kil89 (1989)) and contains in its innermost regions the unique nonthermal radio source Sgr A*, which is the manifestation of a M⊙ black hole in the centre of the Milky Way system (Eckart & Genzel eck96 (1996), Schödel et al. sch02 (2002)).
The molecular complex associated with Sgr A consists predominantly of a molecular belt comprising the “+50 km s-1 cloud” (M–0.02–0.07), the “+20 km s-1 cloud” (M–0.13–0.08), and the Circumnuclear Disk (CND) which surrounds Sgr A West and has a rotational velocity of the order of 100 km s-1 in the same direction as the rotation of the Galaxy. These warm and high-density Galactic Centre molecular clouds are intimately entwined and interact with the continuum complex described above (Sandqvist san89 (1989) - H2CO; Zylka et al. zyl90 (1990), zyl96 (1996); Serabyn et al. ser94 (1994), Ojha et al. ojh01 (2001) - C i; Lindqvist et al. lin95 (1995) - C18O, HNCO; Pak et al. pak96 (1996) - H2). All these structures, together with many more, are parts of a mechanism complex involving shocks, magnetic fields and strong UV radiation fields, and may thus function as prime candidates for H2O observations with the Odin satellite.
2 Observations
Odin is a submillimetre/millimetre wave spectroscopy astronomy and aeronomy satellite, launched on 20 February 2001 from Svobodny, Russia in far-eastern Siberia. It has a 1.1-m high-precision telescope with a beam efficiency of about 90% and beamwidths of and at submm and mm wavelengths, respectively. Its pointing uncertainty is ″. There are four cryo-cooled submm receivers tunable in the frequency range of 486 – 580 GHz with a single sideband temperature of K. A cryo-cooled HEMT receiver is tuned to 119 GHz and has a single sideband temperature of K.The backend spectrometers consist of an acousto-optical spectrometer (AOS) with a total bandwidth of 1040 MHz and two auto-correlators with bandwiths in the range of 100 – 800 MHz, corresponding to velocity resolutions of 0.08 – 1.0 km s-1. The satellite is described in detail by Frisk et al. (fri03 (2003)) and the receiver calibration by Olberg et al. (olb03 (2003)).
Three positions towards Sgr A have so far been observed with Odin, namely Sgr with the CND, the +20 km s-1 molecular cloud and the +50 km s-1 molecular cloud. The coordinates of the observed positions are given in Table 1. Observations have been made in the spectral lines of 119-GHz O2, 487-GHz O2, 492-GHz C i, 548-GHz HO, 557-GHz HO, and 576-GHz () CO. However, only the data for HO and HO have been fully calibrated and reduced so far and they are presented in Sect. 3. The data for the other spectral lines will be presented in a subsequent paper.
| (1950.0) | (1950.0) | |
|---|---|---|
| Sgr Circumnuclear Disk | 17h42m29s.3 | 18″ |
| Sgr A +20 km s-1 Cloud | 17h42m29s.3 | 18″ |
| Sgr A +50 km s-1 Cloud | 17h42m41s.0 | 00″ |
Two observing methods have been employed with Odin. One method is Dicke-switching against one of two sky horns with beamwidths of 4°.4, displaced 42° from the main beam. Sgr CND was observed this way in the HO line during October 2001. In order to improve the baselines, full-orbit observations were made of an empty reference OFF-position at (1950.0)=1726s.8, (1950.0)= 04″ every second orbit (observing period of 60 minutes). The total ON-position time for the HO line observations was eight orbits (480 minutes). The other observing method was total-power position-switching to the above reference position with a duty cycle of 120 seconds. This was used for HO observations of the +20 km s-1 (18 orbits) and the +50 km s-1 (27 orbits) clouds and for HO observations of the Sgr CND-region (58 orbits) during April/May 2002. The AOS was used for all the H2O observations, which results in a velocity resolution of 0.54 km s-1 and a total velocity coverage of 560 km s-1 in the line profiles.
3 Results


Strong emission and absorption lines have been observed in the HO line at all three Sgr A positions. However, no spectral line features can be detected in the HO line down to the rms noise limit of K. The three 557-GHz HO line profiles observed towards Sgr CND, the +20 km s-1 cloud and the +50 km s-1 cloud, are presented in Figs. 1a-c, and the smooth featureless ( K rms) profile of the 548-GHz HO line towards Sgr CND is shown in Fig. 1d. This last profile gives an indication of the high quality of the baselines in our broad-band observations, which is important when judging the reality of the many emission and absorption features in the HO profiles. The intensity scale has not been corrected for the main beam efficiency ( 0.9) in these four profiles. Furthermore, no baselines have been subtracted. The intensity thus includes the presence of the background continuum emission, although the uncertainty of this level is not yet determined. The relative continuum intensities for the HO observations conform qualitatively to the continuum level expected from an interpolation to the H2O frequency of the 800 and 350 m maps by Lis & Carlstrom (lis94 (1994)) and Dowell et al. (dow99 (1999)), respectively. However, it seems that the continuum level obtained with the Dicke-switching method (Fig. 1a) agrees better with the interpolated results (see also Sect. 4) than the position-switching method (Figs. 1b-d). For the sake of comparison with other spectral lines, we have chosen the data from the SEST C18O (1 – 0) survey of the Galactic Centre by Lindqvist et al. (lin95 (1995)). The C18O profiles resulting for the three H2O positions from a convolution of the SEST map spectra to a resolution of (corresponding to the Odin beam size) are shown in Fig. 2.
4 Discussion
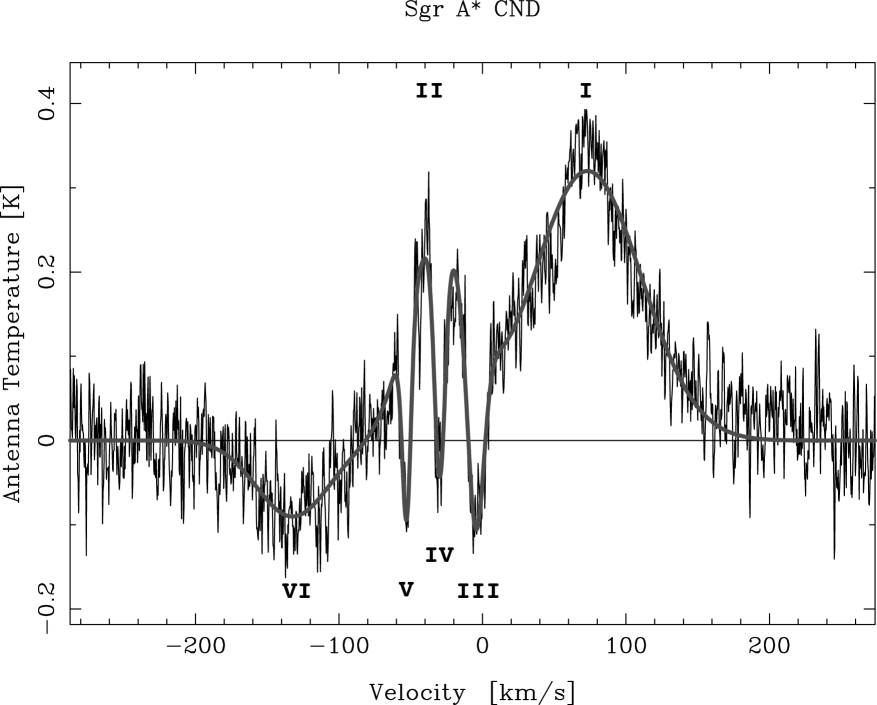
A Gaussian analysis has been performed on the Sgr CND HO profile using four absorption components and two emission components (Fig. 3). The continuum emission was first subtracted out by fitting a linear baseline to the outermost channels on either side of the profile. The Gaussian analysis results are given in Table 2.
| Velocity | Halfwidth | Source | ||
|---|---|---|---|---|
| ( km s-1) | (K) | ( km s-1) | ||
| I | 88.5 | CND | ||
| II | 47.9 | CND | ||
| III | 13.4 | Local Sgr Arm | ||
| IV | 11.0 | km s-1 Arm | ||
| V | 8.1 | 3-kpc Arm | ||
| VI | 60.0 | EMR |
The first two components, I and II, both seen in emission, are believed to originate in the rapidly rotating CND. The northeastern part of the CND is receding and the southwestern part approaching, which gives the asymmetric, somewhat double-peaked line profile structure. The 2.1-arcmin beam of Odin encloses fully the CND and the resulting velocity structure of the profile is reminiscent of that seen in many other molecular lines (see e.g. HCO+ () - Linke et al. lin81 (1981); HCO+ () - Sandqvist et al. san85 (1985); H2CO () and CS () - Sandqvist san89 (1989); CO () - White whi96 (1996)).
Three narrow H2O absorption components, seen at velocities near –5, –30 and –53 km s-1, are observed at all three positions and are well-known Galactic spiral arm features, which were first identified in early 21-cm H i observations. They originate along the line of sight crossing the so-called Local Sgr, –30 km s-1 and 3-kpc spiral arm structures.
From the two submillimetre continuum maps discussed in Sect. 3, we find that the 350m:800m flux ratios (on a 30″ scale) for all three positions are about 17 - 18 (corresponding to a spectral index of about 3.5). From the 800 m map we estimate the flux densities on a scale to be 160, 300, and 250 Jy, for the Sgr CND, +20 and +50 km s-1 cloud positions, respectively. At 557 GHz (538 m) and with a conversion factor of 4100 Jy/K (based on a theoretical for Odin) we estimate continuum levels of 0.16, 0.29, and 0.24 K in our three positions. In the +20 km s-1 cloud profile the deepest absorption is about 0.4 K which is significantly deeper than our estimated continuum level of 0.29 K.
The three distinct and rather narrow absorption features (III, IV and V) are present in the spectra at all three positions (see Figs. 1a-c). The absorption feature (III) at –5 km s-1 appears to be the strongest and, judged by the estimated continuum levels, this feature has an optical depth of at least one. The absorbing gas in these three features lies in front of the thermal (and non-thermal) continuum sources as well as H2O gas seen in emission. Since it is not known how the foreground gas is distributed with respect to the continuum sources and the H2O gas seen in emission and since our estimates of the continuum levels are uncertain, we shall refrain from calculating the optical depths of the absorption features. However, when estimating the (lower) limits of the water column density we shall assume that the optical depths are .
We can estimate the H2 column densities using the C18O-profiles in Fig. 2 and calculating the integrated intensities over the regions corresponding to the three narrow H2O absorptions. The H2 column densities have been calculated by assuming optically thin emission, an excitation temperature of 15 K and a C18O abundance of with respect to H2 (Frerking et al. fre82 (1982)). The lower H2O column density limits, using the appropriate line width for each absorption feature and an excitation temperature of 15 K, have been calculated from the assumption that the optical depths are 1. The corresponding H2O abundance limits are then obtained by using the H2 column density estimates from the C18O data. The results are summarized in Table 3.
| Position | Feature | (C18O) | (C18O) | (H2) | [H2O] | [H2O] |
|---|---|---|---|---|---|---|
| (K km s-1) | (cm-2) | (cm-2) | (cm-2) | |||
| Sgr CND | III | 2.10 | ||||
| IV | 0.18 | |||||
| V | 0.65 | |||||
| +20 km s-1 Cloud | III | 1.00 | ||||
| IV | 0.34 | |||||
| V | 0.96 | |||||
| +50 km s-1 Cloud | III | 1.10 | ||||
| IV | 0.64 | |||||
| V | 0.81 |
A broad H2O absoption component (VI), seen at velocities near –132 km s-1, is also observed in all three positions. This feature has its origin in the near side of the Expanding Molecular Ring (EMR). The EMR is a massive 180 pc molecular ring surrounding the Galactic Centre and it has been observed in many atomic and molecular species (e.g. Morris & Serabyn mor96 (1996)). The near side is seen in broad absorption lines towards the Sgr A Complex at velocities of km s-1, while the far side is seen only in emission lines, which towards the Sgr A Complex have velocities near +170 km s-1.
Now let us turn our attention to the H2O profiles observed towards the +20 and +50 km s-1 clouds, presented in Figs. 1b and c. In addition to the four absorption features discussed above, the profiles are marked by the characteristic emission component from these molecular clouds at velocities near +20 km s-1 and +50 km s-1, respectively. Furthermore, a new molecular feature in the Galactic Centre can now been identified. It is detected as broad HO absorption in the velocity range of +120 to +220 km s-1 (see Figs. 1b and c). We shall call this feature the High Positive Velocity Gas (HPVG). This feature is not seen in the Sgr CND profile (Fig. 1a), which we interpret as being due to the background continuum emission seen at this position being somewhat lower than towards the dust continuum peak emission from the Sgr A +20 and +50 km s-1 molecular clouds (see the 800 and 350 m continuum maps of Lis & Carlstrom lis94 (1994) and Dowell et al. dow99 (1999), respectively). However, a careful study of the H2O profile in Fig. 1a (and Fig. 3) may show an extended very weak emission wing in this HPVG velocity range, so there may be still HPVG present even towards the Sgr CND region, although here the background continuum is too weak to cause visible absorption. Alternatively, the high positive velocity wing of the CND emission may mask any HPVG absorption.
Evidence for the existence of the HPVG in the Sgr A region, seen in other spectral lines, is scarce. The HPVG should not be confused with the molecular gas in the far side of the EMR whose velocity falls inside the same range but whose emission lines are narrower. Also, the HPVG is seen in absorption which places it in front of the Galactic Centre continuum sources and thus it cannot be part of the far side of the EMR. Moneti et al. (mon01 (2001)) have used the Infrared Space Observatory (ISO) to obtain mid- and far-infrared H2O profiles towards Sgr A. These profiles do indeed show some absorption components at velocities corresponding to that of the HPVG. Some evidence for the HPVG may also be present in VLA OH absorption observations towards the Sgr A Complex by Karlsson et al. (kar03 (2003)).
Additional evidence for the HPVG is also apparent in the data of a new high-resolution H i absorption survey of the Galactic Centre region performed with the VLA by Dwarakanath, Zhao, Goss and Lang (2003, in preparation). They have kindly convolved their data with the Odin beam at our positions and find that (1) towards the +20 km s-1 cloud there is an H i absorption with an optical depth of at +100 km s-1, decreasing to around +130 km s-1 and a second absorption component centred around +150 km s-1 with an optical depth of and a width of km s-1, and (2) towards the +50 km s-1 cloud in the velocity range of +100 to +200 km s-1 there is an H i absorption with the optical depth decreasing monotonically from at +100 km s-1 to at +200 km s-1.
Although 58 Odin orbits were dedicated to observing the HO line towards the Sgr CND position, no spectral line was detected (see Fig. 1d). Our non-detection of HO towards Sgr CND provides an upper limit on the H2O abundance in the narrow absorption features. Given the rms noise of 23 mK in the HO spectrum and the estimated continuum level of 0.16 K we find that a 10 km s-1 wide absorption feature of optical depth 0.08 should have been detected at the 3 level. Using this limit and adopting a 16O/18O ratio of 500 for this local absorbing cloud (Wilson & Rood wil94 (1994)) and an excitation temperature of 15 K, we obtain an H2O column density of cm-2. Hence, for the Local Sgr Arm absorption, the 3 upper limit of the H2O abundance becomes , using the H2 column density of in Table 3, while the lower limit was found to be . The average H2O abundance estimated for the foreground gas towards Sgr B2 by Neufeld et al. (neu00 (2000)) is , which is about an order of magnitude higher than our range towards Sgr A. On the other hand, our range is in better agreement with H2O abundances found in giant molecular cloud cores by Snell et al. (sne00 (2000)) and in a local diffuse molecular cloud by Neufeld et al. (neu02 (2002)).
In September/October of 2002, Odin again observed the Galactic Centre region in the HO line, this time pointing at the +20 and +50 km s-1 cloud positions. These observations have not yet been calibrated and reduced. They will be reported in a future paper.
Acknowledgements.
We should like to thank K. Dwarakanath, J.-H. Zhao, M. Goss and C. Lang for permission to use some of their VLA Sgr A Complex H i absorption line results before publication and K. Dwarakanath for making the Odin-compatible analysis of their H i data.References
- (1) Dowell C.D., Lis D.C., Serabyn E., Gardner M., Kovacs A., Yamashita S. 1999, SHARC 350 m Mapping of the Galactic Center from the Caltech Submillimetr Observatory, in ASP Conf. Ser. 186, The Central Parsec of the Galaxy, eds. H. Falcke, W.J. Cotera, W.J. Duschl, F. Melia, M.J. Rieke, 453
- (2) Eckart A., Genzel R. 1996, Nature 383, 415
- (3) Frerking M.A., Langer W.D., Wilson R.W. 1982, ApJ 262, 590
- (4) Frisk U., Hagström M., Ala-Laurinaho J. et al. 2003, A&A (this issue)
- (5) Güsten R. 1989, Gas and Dust in the Inner Few Degrees of the Galaxy, in IAU Symp. 136, The Center of the Galaxy, ed. M. Morris (Kluwer, Dordrecht), 89
- (6) Karlsson R., Sjouwerman L.O., Sandqvist Aa., Whiteoak J.B. 2003, A&A (preprint)
- (7) Killeen N.E.B., Lo K.Y. 1989, High Quality VLA Imaging of Sgr A West at 6 cm, in IAU Symp. 136, The Center of the Galaxy, ed. M. Morris (Kluwer, Dordrecht), 453
- (8) Lindqvist M., Sandqvist Aa., Winnberg A., Johansson L.E.B., Nyman L-Å. 1995, A&AS 113, 257
- (9) Linke R., Stark A.A., Frerking M.A. 1981, ApJ 243, 147
- (10) Lis D.C., Carlstrom J.E. 1994, ApJ 424, 189
- (11) Mezger P.G., Duschl W.J., Zylka R. 1996, A&AR 4, 289
- (12) Moneti A., Cernicharo J., Pardo J.R. 2001, ApJ 549, L203
- (13) Morris M., Serabyn E. 1996, ARAA 34, 645
- (14) Neufeld D.A., Ashby M.L.N., Bergin G. et al. 2000, ApJ 539, L111
- (15) Neufeld D.A., Kaufman M.J., Goldsmith P.F., Hollenbach D.J., Plume R. 2002, ApJ 580, 278
- (16) Ojha R., Stark A.A., Hsieh H.H. et al. 2001, ApJ 548, 253
- (17) Olberg M., Frisk U., Lecacheux A. et al. 2003, A&A, (this issue)
- (18) Pak S., Jaffe D.T., Keller L.D. 1996, ApJ 457, L43
- (19) Sandqvist Aa. 1989, A&A 223, 293
- (20) Sandqvist Aa., Wootten A., Loren R.B. 1985, A&A 152, L25
- (21) Schödel R., Ott T., Genzel R. et al. 2002, Nature 419, 694
- (22) Serabyn E., Keene J., Lis D.C., Phillips T.G. 1994, ApJ 424, L95
- (23) Snell R.L., Howe J.E., Ashby M.L.N. et al. 2000, ApJ 539, L101
- (24) White G. 1996, Molecular Line Maps of the Galactic Centre Circumnuclear Disc, in ASP Conf. Ser. 102, The Galactic Center, 4th ESO/CTIO Workshop, ed. R. Gredel, 171
- (25) Wilson T.L., Rood R. 1994, ARA&A 32, 191
- (26) Zylka R. 1996, Kinematics of the Sgr A Cloud Complex, in in ASP Conf. Ser. 102, The Galactic Center, 4th ESO/CTIO Workshop, ed. R. Gredel, 77
- (27) Zylka R., Mezger P.G, Wink J.E., 1990, A&A 234, 133