Ratio of color and effective temperatures in X-ray burst spectra
Abstract
We present model atmospheres and theoretical spectra for X-ray bursters. Our models include the effects of Compton scattering on free electrons. The atmospheres have compositions that are mixtures of hydrogen, helium, and iron. For our models the ratio of color temperature, , to effective temperature, , is in the range 1.2 - 1.8. This ratio depends on , surface gravity, and iron abundance. For fixed and surface gravity, models with non-zero iron abundance exhibit values of that are slightly lower than pure hydrogen-helium models.
1 Introduction
Discovery of the first X-ray burster was reported by Grindlay et al. (1976)[1] and by Belian et al. (1976)[2]. We believe that these objects are low mass binary stars which contain the accreting neutron star. Since we do not observe X-ray pulsations, the magnetic field of the neutron star is lower than Gs. Weak magnetic field of such intensity allows for the existence of accretion disc. Basic features of X-ray burst are: fast rise 1 s and decay time 3 – 100 s, luminosity near the peak about erg/s and energy per burst ergs (cf. review article by Joss & Rappaport 1984[3]). The idea that energy source of a burst is the thermonuclear flash was proposed by Woosley and Taam (1976)[4] and Maraschi & Cavaliere (1977)[5]. This model quite well explains many global features of X-ray bursters.
Initially neutron star spectra were assumed to be blackbody spectra, but this assumption is not valid when the atmosphere was dominated by scattering on free electrons. In such case spectra of outgoing photons are shifted towards higher energy and the maximum is shifted in the same direction both for the coherent Thomson, and noncoherent Compton scattering. In electron scattering stellar atmosphere, photons are created by thermal processes below the photosphere, in so called thermalization layer. In this layer local temperature T is much higher than the effective temperature , therefore maximum of the Planck function occurs in higher energy than the maximum of . Consequently, the blackbody temperature as obtained from fitting of continuum spectra, can be much larger than the true . Temperature is usually referred to as the color temperature .
In principle, the ratio can reach arbitrary large values in Thomson scattering stellar atmospheres, provided that true absorption in that atmospheres decreases to zero (Madej 1974 [6]). Compton scattering in stellar atmospheres reduces by unknown factor, but still this ratio remains larger than unity. Model atmosphere computations with account of Compton scattering, and exact determination, are very difficult.
Ebisuzaki, Hanawa & Sugimoto (1984)[7] estimated by use the simple opacity formulae. Model atmospheres computations by London, Taam & Howard (1986)[8] showed, that this ratio was in the range from 1.2 to 1.7 and depended on few parameters: , surface gravity log g and iron abundance. London, Taam & Howard (1986) [8] concluded that the solar iron abundance does not influence significantly the ratio . On the other hand, Ebisuzaki & Nomoto (1986)[9] claimed that absorption by iron decrease this ratio.
2 Model equations
Our model equations describe transfer of radiation subject to constraints of hydrostatic and radiative equilibrium. We assume the equation of state of ideal gas in local thermodynamical equilibrium (LTE). The equation of transfer includes f-f absorption from all ions, b-f absorption from iron ions, and Compton scattering terms. The equation of transfer is as follows:
where: is the Planck function, the mean intensity,
is the ratio of true absorption to coefficient of total opacity,
the
monochromatic optical depth, and
denotes cosine of zenithal angle.
Details of the above equation of transfer, and Compton scattering redistribution
functions and , and linearization
procedure, are described in earlier
papers (see Madej 1991 [10]; Madej & Różańska 2000a[11],
b[12]; Madej, Joss &
Różańska 2003[13]).
3 Computations
We calculated our models with the following assumptions: equation of state in LTE, hydrostatic and radiative equilibrium, plane-parallel geometry, non rotating star. Our equations allow for large photon-electron energy exchange at the time of Compton scattering. Details of the computer code and linearization scheme were extensively described in earlier papers quoted in previous section.
We calculated grid of models each of them computed on the 144 standard optical depth points (12 points per the decade) from to and 901 wavelength points. We computed few models of hot neutron star atmospheres with effective temperatures =1, 2, 3 K, and surface gravities from the critical gravity up to in cgs units. Models assume H and He in solar number abundance and iron with number abundance (approximately solar value) and 100 times greater.
4 Results
We claim that our computations can measure both the ratio and its slight changes influenced by small differences of , and iron abundance. We obtain models of burster atmospheres where the constancy of the bolometric flux is almost everywhere better than 1%, and only in few optical depth points approches 2%.
Tables 1 and 2 show values of computed over wide range of parameters , and iron abundance. We can see that for models with pure H-He atmospheres, these ratios are higher than for atmospheres with nonzero iron abundance, of course for the same and . For higher metal abundance these ratios decrease. This is because increase of metal abundance diminish the importance of Compton scattering, and ratio is than determined by the redistribution of outgoing flux by nongray metal absorption.
Left part of the tables present models with and , and right part , and
What is interesting, for the lowest K these ratios exhibit local mimimum in some intermediate . Tendencies, which we observe are due to iron opacity and the Compton scattering. For the lowest surface gravity Compton scattering dominates over thermal absorption, therefore shift of the peak spectra is the highest. In the presence of iron, thermal absorption is greater than in case of H-He atmospheres. Consequently, the is lower for atmospheres containing iron.
In Figure 1 we show the outgoing photon spectra for various parameters. We compare blackbody spectra with the spectra of H-He atmosphere and with the atmosphere containing iron in Figure 1a. We can see that the blackbody spectra (solid line) have the peak in lower energy and the BB spectrum is softer than the spectrum of the model X-ray burster. In lower photon energies we obtain excess of the outgoing flux as compared to the blackbody spectra both for H-He models and atmospheres containing some amount of iron. Figures 1c and 1d present spectra of atmospheres with iron abundance 100 times greater than the solar abundance, and with the solar iron abundance, respectively. For the latter iron abundance we note, that the iron ionisation edge appear in emission for two lowest . Profiles of iron absorption lines (fundamental series of H-like, and He-like ions) can be very complicated (see Fig. 1b). In some models we obtain inverse emission in iron line cores, which strictly correspond to temperature inversion reproduced in our model atmospheres with Compton scattering.
We stress here, that we did not obtain values of larger than 2.0 in any of our model atmospheres of X-ray burst sources.
References
- [1] Grindlay J. et al. 1976 ApJ, 205, L127
- [2] Belian R.D. et al. 1976 ApJ, 206, L135
- [3] Joss P.C. & Rappaport S.A. 1984 Ann. Rev. Astron. Astrophys. 22, 537
- [4] Woosley S.E. & Taam R.E. 1976 Nature, 263, 101
-
[5]
Maraschi L. & Cavaliere A. 1977 In Highlights in Astronomy
ed. E.A. Müller 4(1):127
Dordecht: Reidel - [6] Madej J. 1974 Acta Astronomica, 24, 327
- [7] Ebisuzaki T., Hanawa T. & Sugimoto D. 1984 PASJ, 36, 551
- [8] London R.A., Taam R. & Howard M.W. 1986 ApJ, 306, 170
- [9] Ebisuzaki T. & Nomoto K. 1986 ApJ, 305, 170
- [10] Madej J. 1991 ApJ, 376, 161
- [11] Madej J. & Różańska A. 2000a A&A, 356, 654
- [12] Madej J. & Różańska A. 2000b A&A, 365, 1055
- [13] Madej J., Joss P.C. & Różańska A. 2003 ApJ, in preparation
ACKNOWLEDGEMENTS
We acknowledge support of the grant No. 2 P03D 021 22 from the Polish Committee for Scientific Research.
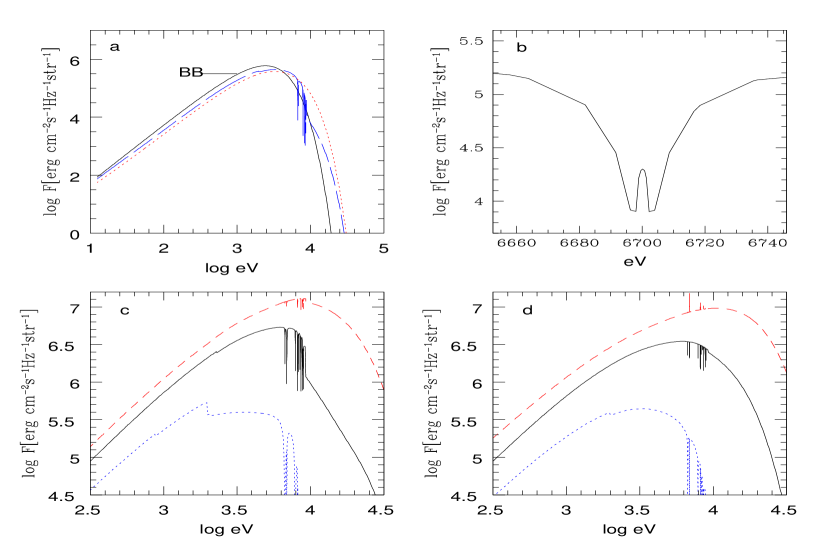
a) solid line - blackbody spectrum with K; dotted line - pure H-He , K; dashed line , , K;
b) resonant line profile of helium-like iron;
c) dotted line , K; solid , K; dashed , K;
d) dotted line , K; solid , K; dashed , K.