Ultraviolet Spectra of CV Accretion Disks with Non-Steady Laws
Abstract
An extensive grid of synthetic mid- and far-ultraviolet spectra for accretion disks in cataclysmic variables has been presented by Wade and Hubeny (1998). In those models, the disk was assumed to be in steady-state, that is is specified completely by the mass and radius of the accreting white dwarf star and the mass transfer rate which is constant throughout the disk. In these models, except as modified by a cutoff term near the white dwarf.
Actual disks may vary from the steady-state prescription for , however, e.g. owing to outburst cycles in dwarf novae ( not constant with radius) or irradiation (in which case in the outer disk is raised above ). To show how the spectra of such disks might differ from the steady case, we present a study of the ultraviolet (UV) spectra of models in which power-law temperature profiles with are specified. Otherwise, the construction of the models is the same as in the Wade & Hubeny grid, to allow comparison. We discuss both the UV spectral energy distributions and the appearance of the UV line spectra. We also briefly discuss the eclipse light curves of the non-standard models. Comparison of these models with UV observations of novalike variables suggests that better agreement may be possible with such modified profiles.
1 Introduction
In most types of cataclysmic variable (CV) stars matter accretes onto the white dwarf via an accretion disk. In some classes of CVs, e.g. the novalike systems or dwarf novae in outburst, the accretion disk can dominate the flux in the ultraviolet (UV) part of the spectrum. Several studies of the UV spectra of uneclipsed CV disks have shown that we do not have a confident understanding of how the photospheric spectrum is formed. The disks in novalike variables (such as the prototype UX UMa and also V603 Aql and RW Sex) should be close to “steady-state” where
where is distance from the white dwarf and is the radius of the white dwarf. The reference temperature depends on the mass of the white dwarf , its radius, and the mass accretion rate :
where and are the usual physical constants (Pringle 1981).
Modelling attempts that take into account the detailed vertical structure and local emitted spectra from the disk surface have so far shown considerable discrepancies between predicted and observed energy distributions or structures, especially at short wavelength (e.g. Wade 1988; Long et al. 1994; Knigge et al. 1997; Robinson, Wood, & Wade 1999). A general feature of the failing of these models is that they predict ultraviolet (UV) spectra that are too “blue” compared with the observations.
To try to improve agreement between models and observation, the computation of the local emitted spectra can be made more sophisticated in various ways. Alternatively, additional source of UV radiation have been proposed to be important in some cases (e.g. optically thin emission from the base of a disk wind, Knigge et al. 1998). However, it is also worth considering whether the standard formula given above should be modified. This may be because the disk is non-stationary (e.g., a dwarf nova near outburst maximum may not have relaxed to a steady or quasi-steady state), or because additional local heating besides the viscous dissipation inside the disk may alter the energy radiated locally at the disk surface (an example would be strong irradiation of the outer disk by the central star, as considered by, e.g., Vrtilek et al. 1990 in the context of low-mass X-ray binaries), or for various other reasons.
In attempting to unravel the true structure of accretion disks, studies of the emergent line spectrum should reveal much, because each absorption line is formed in a relatively narrow range of temperatures (corresponding to a narrow range of radii within the disk), and thus has a characteristic Doppler width from projected disk rotation at the characteristic radius. (See Wade, Diaz & Hubeny 1996 for illustrative examples.) An aspect of any study that considers an altered profile should therefore be to consider its effect on the line spectrum from the disk.

Wade & Hubeny (1998, hereafter WH98) presented a grid of detailed models for accretion disks in CVs. The WH98 models are computed self-consistently in the plane-parallel approximation, assuming LTE and vertical hydrostatic equilibrium, by solving simultaneously the radiative transfer, hydrostatic equilibrium, and energy balance equations. Line transitions of elements from H to Ni are accounted for in the computation of the local spectra of individual disk annuli. Limb-darkening (Diaz, Wade, & Hubeny 1996), Doppler broadening, and blending of lines are fully accounted for in the computation of the integrated disk spectra.
In this work we construct accretion disk models for cataclysmic variables (based on the WH98 grid and its component local spectra), in which the temperature profiles are allowed to deviate in a prescribed way from the standard prescription111In what follows, we usually suppress the subscript on , but by we always mean the effective temperature.. We consider profiles that take a power-law form in the outer disk, with . This does not exhaust the possibilities of modified disks, but the choice is motivated by simplicity, and the intriguing and puzzling indication (explored below) that such disks may in some sense better describe the observations of novalike variables.
We discuss in the sections below our computational method and results, including the UV spectral energy distributions, the appearance of the UV line spectra, and briefly the UV light curves of eclipsing systems.
2 Method
The computation of a WH98 model spectrum involves four stages, which we summarize briefly (see WH98 for the detailed discussion). First, the disk is divided up into concentric annuli, which are treated as independent plane-parallel radiating slabs. The vertical structure of each ring is computed with the program TLUSDISK (Hubeny 1990a, 1990b). Second, the program SYNSPEC (Hubeny, Lanz, & Jeffrey 1994) is used to solve the radiative transfer equation to compute the local rest-frame spectrum for each ring. This computation includes typically thousands of lines selected from the lists of Kurucz (Kurucz 1991; Kurucz & Bell 1995). Third, the program DISKSYN5a is used to combine the rest frame intensities and generate the integrated disk spectrum. DISKSYN5a divides each ring into a large number of azimuthal sectors, and sums the individual elements with the appropriate area weighting and Doppler shifting (owing to the projected orbital motion of the gas within the disk). Finally, the program ROTINS is used to convolve the integrated disk spectrum with a Gaussian instrumental broadening function and re-sample the result uniformly in wavelength.
In the present study, modified temperature profiles are generated that have in the outer disk, and that match smoothly onto the steady-state profile at a tangent point. The modified models therefore share the standard model’s behavior in the inner disk and depart smoothly from it further out. The dimensionless radius of the tangent point, , is given by
(valid for ). Table 1 lists and other useful quantities for a selection of values of . Figure 1 illustrates a family of modified profiles for a particular model () from WH98. Note that is just the steady-state case (as ). We emphasize that our particular class of models is chosen because it allows a convenient parametrization for exploratory purposes that has the standard model as a limiting case. Other classes of models can be contemplated (e.g., a single power-law behavior of throughout the entire disk) that would give qualitatively similar results, as well as model types that might give considerably different behavior. Since observed disks seems to differ from the standard model disks by being “redder”, our considered class of models is possibly representative of the character of plausible changes in T(r) structure.
We consider modifications of the standard (i.e., steady-state) WH98 models that have , namely models , , , , and . The radius of the central white dwarf for these models is cm; this is also taken to be the inner edge of the accretion disk. For discussion of eclipse light curves in the UV, we make use of models based on WH98 models and , which have and cm. Table 2 summarizes some properties of these models. For each of these standard WH98 models we generated modified models for , 0.6, 0.5, 0.4, and 0.3.
The construction of the final model spectra is the same as for the WH98 grid, except for the modified temperature profile of the disk and the specification of the outer radius of the disk. We prescribe the outer edge of the disk in two ways. In the first case the outer edge of the disk is where falls below about 10,000 K, as in WH98. Since we consider only the far- and mid-ultraviolet fluxes, the restriction to temperatures greater than about 10,000 K results in flux errors of less than a few percent. In the second case, the outer edge of the disk is defined by the tidal truncation radius appropriate to cataclysmic variables. If , the outer disk edge would be at about for an orbital period of hours or at about for an orbital period of hours. (These limits were computed using Roche geometry and , where is measured in hours and is the mass of the secondary star in solar units.) Table 2 shows that truncation of the disk at a temperature well above 10,000 K is likely in the case of high mass transfer rates or low values of .
Once the modified radii are computed, the integrated disk spectrum is computed in exactly the same way as the standard WH98 models: local spectra are generated and summed together with appropriate area weighting, taking into account Doppler shifts (owing to orbital motions of the area elements within the disk) and limb darkening. We chose inclination angles of , , and (, 0.50, and 0.25) for illustration. The fluxes presented here are given for an assumed distance of 100 pc, and correctly account for limb darkening, but do not include a geometrical foreshortening factor .
Note that in these exploratory calculations, we have deviated from requiring that the local and photospheric gravity be mutually consistent: rather than compute new vertical structures and local spectra for each annulus, we have simply used the vertical structures and spectra from WH98, shifting each model annulus to a new radius according to its . The main results of this study of the ultraviolet spectrum should not be greatly affected by this shortcut.
3 Results
3.1 “Color-Magnitude” Diagrams

We show “color-magnitude” diagrams of the resulting disk spectra in Figures 2 and 3. We use near-monochromatic fluxes that are averages of over 10 Å intervals centered at 1455 Å and 1945 Å. These intervals are relatively line-free. Note that the flux ratio is very nearly independent of interstellar reddening (Seaton 1979). Figure 2 shows power-law disks that are viewed nearly face-on () and are not truncated (i.e. the disks extend until an effective temperature of about 10,000 K is reached). The solid lines connect sequences of models with the same maximum temperature and different . For , the disks are hotter at each radius in the outer disk than in the corresponding standard case, the disks extend further out in radius, and there is a larger proportion of the disk surface at relatively low temperatures. These disks are brighter and redder, that is, is more negative, displayed further to the right in Figure 2. The dashed box outlines the region occupied by models when limb darkening is taken into account222To make the meaning of this region more explicit, consider the point marked “t” in Figure 2. This is model t in the case of the standard disk and for . The edge of the dashed box descending to the right from this point is the track of this model as decreases to 0.250. The next vertex ascending to the right is model t with and . The vertex descending to the right from the point representing model jj (with and ) is model jj with and . For all the other models explicitly shown (with ), the corresponding points for and 0.250 lie within the dashed box, descending to the right from the case. Figure 3 is similar, with the dashed vertex at coordinates representing the critical case for model u for , and the vertex at representing the truncated model jj for . . (Models with and 0.25 are included in defining this box. As before, the calculated fluxes are scaled to a distance of pc. The purely geometrical foreshortening factor is not included.) At high inclinations, limb darkening lowers the disk surface brightness and reddens the disk. “Cooler” models such as model and models with have more pronounced limb darkening effects in the ultraviolet (see Diaz, Wade, & Hubeny [1996] for further discussion of limb darkening in accretion disk spectra.)

Figure 3 shows what happens when the model disks are truncated at a dimensionless radius of . The dashed box again outlines the region when high inclination angles are considered. In this case a disk becomes brighter and redder as declines from 0.75, as long as the entire disk with K fits within , as before. For less than some critical value , however, the disk is no longer allowed to grow in radius, but each part of the disk within continues to get hotter, so the disk gets brighter but bluer. At a fixed value of , truncated disks are fainter and bluer than non-truncated disks.
For truncation at , corresponding to shorter orbital periods, the result is that the disk is smaller, fainter, and bluer than the corresponding disk truncated at . Such disks are still brighter than the standard disks from which they were derived but may be either redder or bluer depending on and maximum temperature .

In both Figures 2 and 3, points are plotted which represent IUE observations of the novalike variables RW Sex and V603 Aql (cf. Verbunt 1987). The data have been corrected for extinction and reddening and scaled to pc and (i.e., geometrical foreshortening removed) for comparison with the models. For RW Sex, pc and are used; for V603 Aql, pc and , following Wade (1988). The orbital periods are 5.9 hours and 3.3 hours, respectively. The disk models for the standard cases are too blue to match the observed colors of RW Sex and V603 Aql. This point will be discussed further below.
WH98 discuss the contribution of the central white dwarf (WD) to the light from the disk (their Section 4.3). For the relatively hot disks that are considered here, the WD’s contribution does not make a qualitative difference to the discussion, owing to its small surface area in comparison with the outer disk, and has been omitted from our exploratory calculations. This is especially true for the non-standard disks of the kind considered here, which are more luminous than the standard disks. For realistic cases, the WD contribution to the models summarized in Figures 2 and 3 would be less than 1 or 1.5 (mJy at 100 pc). There will be a noticeable contribution to the (out of eclipse) flux of a CV only when the WD is hotter than the inner disk, and in those cases the total light will be somewhat bluer than a standard disk; in the interesting non-standard cases, the WD contribution is even less significant. Of course, the effect of the WD might be seen during deep eclipses of the disk, and this should be modeled in detailed studies of observed systems; this does not make a qualitative or important quantitative change to the conclusions of this study in any way. Similar considerations apply to the possible contribution from a boundary layer (BL) at the inner edge of the disk, but with even more force because the BL radiating area would be smaller than the WD surface area and the UV bolometric correction would be very large, placing most of the emission in the extreme UV or soft X-ray region.
3.2 Integrated Spectra
Figure 4 shows integrated spectra at for non-truncated disks derived from the standard WD98 model . The disks with flatter temperature distributions (i.e. smaller ) are brighter. Fluxes are again for a distance of pc and do not include the foreshortening factor (which is however the same for all spectra shown). In addition to the overall flux level and color changes, specific line features that are formed in the outer (cooler) portions of the disk are enhanced relative to features that are formed in the inner disk. For example, compare the C IV doublet at Å, which is formed in the hotter regions of the disk, with the Si II doublet at Å. In the model spectrum with , the Si II feature is only slightly stronger than the C IV feature, whereas the Si II feature is noticeably stronger in the model spectrum with .
3.3 Extension to Eclipsing Systems
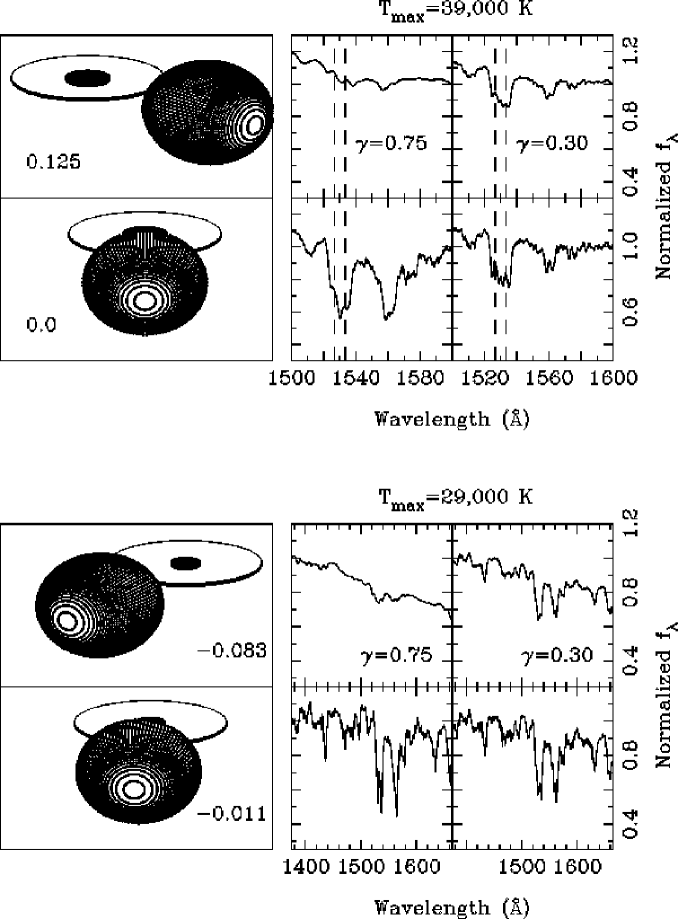
Wade & Orosz (1999) discuss the modifications to the WH98 models to deal with the case of a disk that is partially eclipsed by the mass-losing star. We used the Wade & Orosz codes to compute spectra and “light curves” through various partial eclipse phases for non-standard models derived from the WH98 models ( K) and ( K). Both models have a white dwarf mass of . For the illustrations we choose a secondary star mass of , an orbital period of 0.2 days, an inclination of , and an outer disk radius of . We chose two different spectral resolutions at which to sample the final model spectra: (FWHM = 0.062 Å sampled every 0.0155 Å) and (FWHM = 0.78 Å sampled every 0.195 Å). The former resolving power was delivered by the G160M grating of the Goddard High Resolution Spectrograph (GHRS) which flew on the Hubble Space Telescope, and the latter resolving power was delivered by the G140L GHRS grating.

Figure 5 shows the eclipse geometry and predicted spectra (in the restframe of the white dwarf) in the region of the Si II doublet (, 1533.45 Å) for models () and () at different phases, where mid-eclipse is phase 0.0 (for clarity each spectrum has been normalized at 1600 Å). We display only the rings in the disk that have K. The integrated disk spectra for the standard models () only show weak features outside of eclipse. As the hotter inner regions of the disk are eclipsed, lines that are formed in the outer regions of the disk (for example Si II) become apparent. As noted above, specific line features that are formed in the outer disk are enhanced relative to features that are formed in the inner disk in the models with flatter temperature profiles. Hence, the Si II feature in the uneclipsed disks with is relatively strong. Because the outer regions of the disk are relatively large in the models, the change in the line spectra of the models through eclipse is much less dramatic than in the corresponding standard model cases.
Figure 6 shows continuum light curves through eclipse for various models based on and (for a mass ratio and an inclination of ). Here the “continuum” represents the average flux between 1410 Å and 1530 Å in the spectra. The depth of the light curve at phase 0.0 depends on the value of . The disk in the standard model is totally eclipsed at phase 0.0 for our adopted geometry, whereas the flux at phase 0.0 for the model based on is roughly 35% of the out-of-eclipse level. Since the models with flatter temperature profiles have larger disks than the corresponding standard model, the eclipse light curves for models with low values of are much broader than those for the standard models. Hence one may use the shape and depth of the eclipse light curve to help distinguish between standard models and models with much flatter temperature profiles.
4 Discussion
There are several ways to compare the detailed model spectra with UV observations of disks in CVs. With the correct model, one should be able to match the overall flux, assuming the distance and inclination of the object in question are well enough known. One should also be able to match the overall spectral shape (the “color”) over some broad wavelength range. The predicted absorption line spectrum can be compared with high-quality observations for nearly face-on systems or for systems in partial eclipse (Wade & Orosz 1999). Finally, the predicted light curves for eclipsing systems can be compared with observations. In particular, the width and depth of the eclipse light curve are useful for distinguishing between various models.
As discussed by Wade (1988), it turns out that UV observations of novalike variables are very difficult or impossible to fit using steady-state disk models constructed from LTE stellar atmospheres. That is, one cannot match both the observed flux and color at the same time. This is still the case using the more self-consistent disk models of WH98. Indeed, this is obvious from Figures 2 and 3 (where the open–circle symbols represent the steady–state disk spectra, ). While the standard WH98 models and roughly reproduce the observed fluxes of RW Sex and V603 Aql, they fail badly in matching the colors. The present work suggests that “non-steady state” disks with a power-law distribution that is flatter than might fare better. For example, V603 Aql is on the sequence of power-law disks based on the WH98 model ( K) with .
There is one obvious problem associated with using non-standard profiles, either of the class described here or more generally, to model the disks in the novalike variables: what would be the reason that the steady-state law is not followed in these apparently steady-state disks? It is probably not reasonable to explain a non-standard temperature profile as being due to a mass transfer rate that is constant in time but varies with radius. This would result in sources or sinks of mass density within the disk, in contradiction to the apparent steady-state nature of these stars. (See, however, Knigge (1999), who discusses how a strong wind from the inner disk may act as a sink of mass, angular momentum, and energy.) Hence the non-standard temperature profile must be ascribed to some other cause. One possible suspect is irradiation of the disk by a hot central white dwarf or boundary layer. Vrtilek et al. (1990) showed how irradiation can lead under certain assumptions to in low-mass X-ray binaries, but note that in that case radiation from the central source (a neutron star) dominates the outer disk flux, since the potential well into which the disk matter is accreted is very deep. It is far from clear that irradiation in CVs (where the central star is a white dwarf), acting alone, will be strong enough to enforce such a flat temperature profile, and we do not claim to have shown that irradiation is the cause of a flattened profile333Indeed, we do not even make the claim, on the basis of the limited work described here, that a flattened profile is the basis of the discrepancy between standard disk models and observations of luminous CVs. We have only demonstrated consistency of such modified disks with observations of two test objects, in terms of UV colors and fluxes, along with pointing to other more sensitive tests involving spectra and eclipse light curves.. However, if irradiation is the cause of the non-standard temperature profile, then our models are incomplete—we have merely assigned the same local spectra (computed under the assumption of no irradiation) to different radii in the disk. A correct treatment of irradiation would include its effect in the vertical structure of the disk (cf. Hubeny 1990a) and the emerging spectrum would differ from merely a sum of hotter “normal” spectra. An irradiated disk spectrum might even resemble to some extent a sum of Planck spectra, which Wade (1988) showed did match colors and fluxes of novalike variables in the ultraviolet spectral range. Until detailed spectrum models incorporating a correct description of irradiation are developed, the “problem of the novalike variables” must be considered to still be unsolved.
5 Summary
We have presented a class of model spectra of accretion disks which have non-standard power-law temperature profiles (i.e., with ). When , the disks are brighter and redder than disks in the corresponding standard case, assuming the disks with the flatter temperature profiles extend outward until a temperature near 10,000 K is reached. Non-standard disks that are truncated as some smaller radius are still brighter than the standard disks from which they were derived but may be either redder or bluer depending on and the maximum temperature . For smaller values of (flatter temperature profiles), specific line features that are formed in the outer disk are enhanced in the integrated spectrum relative to features that are formed in the inner disk. For eclipsing systems we have illustrated how the eclipse light curves for these non-standard disks are broader and less deep than the light curves for the corresponding standard disks. Such patterns may be useful in diagnosing whether disks in CVs do in fact have non-standard laws, or whether the failure of standard model disks to fit the data lies elsewhere.
Finally, we point out that detailed standard disk models () of Wade & Hubeny (1998) cannot simultaneously match the observed UV fluxes and colors of the novalike variables RW Sex and V603 Aql. Wade (1988) reached a similar conclusion, using disk spectra synthesized from stellar atmosphere models. Our present exploratory work suggests that a disk with a much flatter temperature profile, with , provides a better match to both the flux and color of V603 Aql. However, the WH98 models as applied in this case are incomplete; since no mechanism is identified that results in the flatter temperature profile, we have simply constructed models as if there were a mass transfer rate that varies with radius (an apparently unphysical situation for the novalike variables). If the flat temperature profiles which seem to be favored by this exploratory analysis are in fact due to irradiation (although for energetic reasons this seems problematic), then further refinements to the models should include a detailed and consistent treatment of irradiation.
References
- Diaz, Wade, & Hubeny (1996) Diaz, M. P., Wade, R. A., & Hubeny, I. 1996, ApJ, 459, 236
- Hubeny (1990a) Hubeny, I. 1990a, ApJ, 351, 632
- Hubeny (1990b) Hubeny, I. 1990b, in IAU Colloquium 129, Structure and Emission Properties of Accretion Disks, ed. C. Bertout et al. (Gif sur Yvette: Editions Frontieres), 227
- Hubeny, Lanz, & Jeffrey (1994) Hubeny, I., Lanz, T., & Jeffery, C. S. 1994, St. Andrews Univ. Newsletter on Analysis of Astronomical Spectra, 20, 30
- Knigge et al. (1997) Knigge, C., Long, K. S., Blair, W. P., & Wade, R. A. 1997, ApJ, 476, 291
- Knigge et al. (1998) Knigge, C., Long, K. S., Wade, R. A., Baptista, R., Horne, K., Hubeny, I., & Rutten, R. G. M. 1998, ApJ, 499, 414
- Knigge (1999) Knigge, C. 1999, MNRAS, 309, 409
- Kurucz (1991) Kurucz, R. L. 1991, Stellar Atmospheres: Beyond Classical Models, ed. L. Crivellari et al. (Dordrecht: Kluwer), 441
- Kurucz & Bell (1995) Kurucz, R. L. & Bell, B. 1995, Kurucz CD-ROM No. 23 (Cambridge, MA: SAO)
- Long et al. (1994) Long, K. S., Wade, R. A., Blair, W. P., Davidsen, A. F., & Hubeny, I. 1994, ApJ, 426, 704
- Pringle (1981) Pringle, J. E. 1981, ARA&A, 19, 137
- Robinson, Wood, & Wade (1998) Robinson, E. L, Wood, J. H., & Wade, R. A. 1999, ApJ, 514, 952
- Seaton (1979) Seaton, M. J. 1979, MNRAS, 187, 73P
- Verbunt (1987) Verbunt, F. 1987, A&AS, 71, 339
- Vrtilek et al. (1990) Vrtilek, S. D., Raymond, J.C., Garcia, M. R., Verbunt, F., Hasinger, G. & Kürster, M. 1990, A&A, 235, 162
- Wade (1988) Wade, R. A. 1988, ApJ, 335, 394
- Wade, Diaz, & Hubeny (1996) Wade, R.A., Diaz, M. & Hubeny, I. 1996, Astrophysics in the Extreme Ultraviolet, ed. S. Bowyer & R. F. Malina (Dordrecht: Kluwer), 355
- Wade & Hubeny (1998) Wade, R. A., & Hubeny, I. 1998, ApJ, 509, 350 (WH98)
- Wade & Orosz (1999) Wade, R. A., & Orosz, J. A. 1999, ApJ, 525, 915
| 0.7 | 12.250 | 0.288 | 0.108 | 0.066 |
| 0.6 | 3.361 | 0.678 | 0.134 | 0.088 |
| 0.5 | 2.250 | 0.848 | 0.180 | 0.127 |
| 0.4 | 1.842 | 0.929 | 0.248 | 0.188 |
| 0.3 | 1.633 | 0.969 | 0.347 | 0.282 |
Note. — See text for definition of . The dimensionless radius is , where is the radial coordinate in the disk. is the maximum effective temperature of a steady-state disk, attained at .
| Model | aa and are shown for the case . Models discussed in the text are extended to K or are truncated at or , if K has not been reached at that radius. | aa and are shown for the case . Models discussed in the text are extended to K or are truncated at or , if K has not been reached at that radius. | |||
|---|---|---|---|---|---|
| Family | (K) | (K) | (K) | ||
| t | -10.0 | 29,330 | 9.40 | 10,180 | (8270) |
| u | -9.5 | 39,110 | 14.30 | 13,580 | 11,030 |
| v | -9.0 | 52,160 | 21.70 | 18,100 | 14,710 |
| dd | -8.5 | 69,560 | 28.80 | 24,140 | 19,620 |
| jj | -8.0 | 92,760 | 43.70 | 32,200 | 26,160 |
| k | -9.0 | 29,330 | 9.40 | 10,180 | (8270) |
| bb | -8.5 | 39,110 | 14.30 | 13,580 | 11,030 |
Note. — For model sequences , , , , and , and cm. For model sequences and , and cm. The steady-state mass transfer rate is in units of solar masses per year. , where is the radial coordinate in the disk. . All temperatures are effective temperatures. See WH88 for further details.