The cluster of galaxies Abell 376. ††thanks: based on observations made Haute-Provence and Pic du Midi Observatories (France)
We present a dynamical analysis of the galaxy cluster Abell 376 based on a set of 73 velocities, most of them measured at Pic du Midi and Haute-Provence observatories and completed with data from the literature. Data on individual galaxies are presented and the accuracy of the determined velocities is discussed as well as some properties of the cluster. We obtained an improved mean redshift value and velocity dispersion . Our analysis indicates that inside a radius of kpc (arcmin) the cluster is well relaxed without any remarkable feature and the X-ray emission traces fairly well the galaxy distribution. A possible substructure is seen at 20 arcmin from the centre towards the Southwest direction, but is not confirmed by the velocity field. This SW clump is, however, kinematically bound to the main structure of Abell 376. A dense condensation of galaxies is detected at 46 arcmin (projected distance Mpc) from the centre towards the Northwest and analysis of the apparent luminosity distribution of its galaxies suggests that this clump is part of the large scale structure of Abell 376. X-ray spectroscopic analysis of ASCA data resulted in a temperature keV and metal abundance . The velocity dispersion corresponding to this temperature using the – scaling relation is in agreement with the measured galaxies velocities.
Key Words.:
galaxies: distances and redshifts – galaxies: cluster: general – galaxies: clusters: Abell 376 – clusters: X-rays – clusters: subclustering1 Introduction
Redshift surveys in clusters of galaxies are needed to study their dynamical and evolutionary states, estimating parameters such as the mass, shape and distortion of the velocity field, presence of substructures or projected foreground/background galaxies and groups, strength of dynamical friction and two-body processes and, in general, the present stage of their dynamical evolution. This information is useful to test theoretical scenarios of galaxy formation and also of large structure formation and evolution.
In clusters, the mean velocity is a key factor in deriving distances, allowing the study of matter distribution over very large scales. Within clusters the analysis of the velocity field can lead to an estimate of the virial mass, constraining models of the dark matter content. Galaxy velocity measurements provide information complementary to that obtained through X-ray observations of clusters. Both form basic pieces of information for the understanding of clusters. However, a discrepancy between these estimators are often found (e.g. Mushotzky et al. 1995; Girardi et al. 1998; Wu et al. 1999). Virial mass estimates rely on the assumption of dynamical equilibrium. X-ray mass estimates also depend on the dynamical equilibrium hypothesis and on the still not well-constrained intra-cluster gas temperature gradient (e.g., De Grandi et al. 2002). Finally, mass estimates based on gravitational strong lensing are considered more reliable than the others (e.g., Mellier 1999) because they are completely independent of the dynamical status of the cluster. The drawback is that strong lensing can only probe the central region of clusters. The discrepancies with other methods may be due to non-equilibrium effects in the central region of the clusters (Allen, 1998).
An important source of departure from equilibrium (that may affect mass estimates) are substructures. Their very existence supports the current view that clusters grow hierarchically by accreting nearby groups and galaxies. Even the frequency and degree of clumpiness in the central regions of the clusters depends on the cosmology (e.g. Richstone et al. 1992). In many cases, substructures are loosely bound and can survive only a few crossing times in the hostile environment of rich clusters. However, they seem to be very common in present-day clusters. A recent estimate by Kolokotronis et al. (2000) indicates that at least 45% of rich clusters present optical substructures. Substructures are detected in both optical and X-ray images in 23% of the clusters. This last number may then be considered a lower limit on the fraction of real substructures in clusters and implies that one in four clusters may be out of equilibrium due to the presence of a substructure. The dynamical status of individual clusters should therefore be examined in detail before being used in other studies.
In this paper, we present a study of the dynamical status of the cluster Abell 376, from the analysis of the positions and velocities of its galaxies, as well as from the intra-cluster gas X-ray emission. Abell 376 has a I-II morphology in the Bautz-Morgan classification and a richness class R = 0 extending on 151 arcmin in diameter (Abell et al. 1989). It is a cD or D-galaxy dominated cluster; its brightest cluster member (BCG) was recently imaged by the HTS WFPC2 (Laine et al. 2003). It shows a smooth brightness profile with a central core, although it is not well fitted by the so-called Nuker-law (Lauer et al. 1995). Abell 376 was observed in X-rays by several satellites. It has a moderate cooling flow yr-1 (White et al. 1997).
A search in the NED database111The NASA/IPAC Extragalactic Database (NED) is operated by the Jet Propulsion Laboratory, California Institute of Technology, under contract with the National Aeronautics and Space Administration. indicates that only few radial velocities were known in the field of the cluster. A list of 13 velocities is published in Capelato et al. (1991) obtained at Haute-Provence observatory with the multiobject spectrograph SILFID for which we noticed a few years after that except the central E/D number 71 galaxy, there was misidentification in the correspondence object/fiber/spectrum, so that the velocities cannot be used and should be removed from any database. For this reason, we decided to reobserve some of the previous galaxies and not take into account our previous velocities. Here we examine some properties of the cluster Abell 376, using a set of 73 new and already published velocities. The observations of radial velocities reported here are part of a program to study the dynamical structure of clusters of galaxies, started some years ago and with several results already published (see e.g. Proust et al. 1992, 1995, 2000; Capelato et al. 1991, Sodré et al. 2001).
This paper is organized as follows. We present in Sect. 2 the details of the observations and data reduction. In Sect. 3 and 4 we discuss the distribution and the velocity analysis of the cluster galaxies respectively. In Sect. 5 we analyze the X-ray emission and gas distribution and in Sect. 6 the spectral and morphological classification of the cluster galaxies. In Sect. 7 we present mass estimates for the central region of the cluster, derived from optical and X-ray observations and the dynamical status of Abell 376. Finally, in Sect. 8 we summarize our conclusions. We adopt here, whenever necessary, Mpc-1, and
2 Observations and Data Reductions
The new velocities presented in this paper have been obtained with the 1.93m telescope at Haute-Provence Observatory and with the 2.0m telescope at Pic du Midi (France).
Observations with the 1.93m Haute-Provence Observatory telescope were carried out in November 1997 and 1998. We used the CARELEC spectrograph at the Cassegrain focus, equipped with a 150 lines/mm grating blazed at 5000 Å and coupled to an EEV CCD detector 2048x1024 pixels with pixel size of 13.5 m. A dispersion of 260 Å/mm was used, providing spectral coverage from 3600 to 7300 Å. Wavelength calibration was done using exposures of He-Ne lamps.
We completed the observations during an observing run at the 2.0m Bernard Lyot telescope at Pic du Midi observatory in January 1997 with the ISARD spectrograph in its long-slit mode with a dispersion of 233 Å/mm with the TEK chip of 1024x1024 pixels of 25m corresponding to 5.8 Å/pixel. Typically two exposures of 2700s each were taken for fields across the cluster. Wavelength calibration was done using Hg-Ne lamps before and after each exposure.
The data reduction was carried out with IRAF222IRAF is distributed by the National Optical Astronomy Observatories, which are operated by the Association of Universities for Research in Astronomy, Inc., under cooperative agreement with the National Science Foundation. using the LONG SLIT package. The spectra were rebinned with a scale of 1 Å/bin equally spaced in log wavelength. Radial velocities have been determined using the cross-correlation technique (Tonry and Davis 1979) implemented in the RVSAO package (Kurtz et al. 1991, Mink et al. 1995) with radial velocity standards obtained from observations of late-type stars and previously well-studied galaxies.
A total of 71 velocities has been obtained from our observations. Table 1333Table 1 is also available in electronic form at the CDS via anonymous ftp 130.79.128.5 lists positions and heliocentric velocities for 73 individual galaxies in the cluster including data from Wegner et al. (1991) and from Postman an Lauer (1995), with the following columns:
| Galaxy | Name | R.A. | Decl. | Type | Hel. Vel. | R | N |
|---|---|---|---|---|---|---|---|
| id. | (2000) | (2000) | |||||
| 2 | 02 46 24.7 | +36 28 24 | E | 39170 78 | 3.92 | o | |
| 3 | 02 46 24.3 | +36 28 21 | E | 39711 105 | 5.60 | o | |
| 5 | 02 45 30.1 | +36 28 33 | SB | 14222 62 | 6.71 | o | |
| 6 | 02 47 29.6 | +36 35 29 | E | 39809 76 | 4.13 | o1 | |
| 7 | 02 47 25.8 | +36 36 23 | S0/E | 32510 69 | 4.76 | o | |
| 8 | 02 47 24.6 | +36 34 49 | S0 | 14452 24 | 7.31 | o | |
| 9 | 02 46 48.5 | +36 32 47 | S0 | 14906 31 | 4.63 | o | |
| 11 | 02 46 37.2 | +36 33 25 | E | 14856 70 | 6.02 | o | |
| 17 | 02 44 43.9 | +36 35 46 | E/S0 | — | 5.56 | o | |
| 18 | 02 47 35.2 | +36 40 55 | S | 13660 68 | 6.69 | o | |
| 20 | 02 46 02.5 | +36 41 27 | S0 | 14314 45 | 6.65 | o | |
| 22 | 02 45 51.8 | +36 39 29 | S0 | 14828 31 | 12.44 | o | |
| 24 | 02 45 21.9 | +36 42 58 | S0 | 13419 130 | 2.85 | o | |
| 25 | GIN 139 | 02 45 13.7 | +36 41 41 | S0/E | 15010 33 | 5.92 | o |
| 15002 21 | l1 | ||||||
| 26 | GIN 140 | 02 45 12.4 | +36 42 44 | S0 | 13960 18 | l1 | |
| 27 | 02 45 10.3 | +36 41 39 | Sa/0 | 13437 41 | 8.79 | o | |
| 28 | GIN 141 | 02 45 03.9 | +36 42 36 | E | 14844 38 | 11.73 | o |
| 14822 24 | l1 | ||||||
| 31 | 02 47 46.6 | +36 43 55 | S0/a | 14286 60 | 7.85 | o | |
| 32 | 02 47 21.7 | +36 43 40 | S | 5130 79 | 3.56 | o | |
| 33 | 02 47 04.2 | +36 45 35 | S0 | 13655 49 | 6.86 | o | |
| 34 | 02 47 00.6 | +36 45 31 | E | 14994 45 | 7.57 | o | |
| 35 | 02 46 55.1 | +36 47 02 | S0 | 14774 69 | 4.11 | o | |
| 36 | 02 46 43.9 | +36 47 31 | S | 13032 49 | 7.39 | o | |
| 37 | 02 46 43.5 | +36 48 32 | E | 13074 67 | 6.75 | o | |
| 40 | LEDA074158 | 02 46 07.6 | +36 48 18 | S | 14621 65 | 8.08 | o |
| 41 | 02 46 10.9 | +36 47 01 | S0 | 15170 79 | 5.20 | o | |
| 42 | 02 45 46.7 | +36 47 45 | S | 12829 85 | 5.59 | o | |
| 43 | 02 45 18.0 | +36 45 51 | S | 41230 92 | 2.94 | o | |
| 44 | 02 45 33.7 | +36 46 40 | S0 | 13034 126 | 3.18 | o | |
| 45 | 02 45 13.1 | +36 46 28 | S0/a | 14356 77 | 4.97 | o | |
| 49 | 02 44 42.2 | +36 45 10 | S0 | 14338 74 | 4.69 | o | |
| 52 | 02 47 36.2 | +36 51 04 | S/I | 14357 39 | 7.85 | o | |
| 54 | 02 47 30.1 | +36 52 03 | S0 | 14329 30 | 8.02 | o | |
| 55 | 02 46 58.0 | +36 52 39 | S0/a | 15203 98 | 3.32 | p | |
| 57 | 02 46 50.1 | +36 53 21 | S | 15168 94 | 3.26 | p |
| Table 1. continued. | |||||||
| Galaxy | Name | R.A. | Decl. | Type | Hel. Vel. | R | N |
| id. | (2000) | (2000) | |||||
| 60 | 02 46 24.1 | +36 52 35 | S0 | 13911 86 | 6.75 | o | |
| 61 | 02 46 24.5 | +36 54 04 | S0 | 14143 78 | 6.41 | o | |
| 63 | 02 46 20.7 | +36 55 16 | S0 | 14058 89 | 6.70 | o | |
| 64 | 02 46 20.8 | +36 54 47 | S0 | 13837 74 | 7.16 | o | |
| 65 | 02 46 18.5 | +36 54 52 | S0 | 14100 54 | 11.90 | o | |
| 68 | 02 46 10.4 | +36 55 11 | E/S0 | 14652 45 | 6.79 | o | |
| 69 | 02 46 08.9 | +36 54 22 | E | 15066 72 | 6.05 | o | |
| 70 | 02 46 07.8 | +36 54 12 | E | 14547 93 | 5.64 | o | |
| 71 | MCG+6-07-04 | 02 46 04.0 | +36 54 18 | E/D | 14563 34 | 8.54 | o |
| UGC 02232 | 14549 39 | l1 | |||||
| (Central galaxy) | 14700 | l2 | |||||
| 72 | 02 46 03.3 | +36 53 03 | S0 | 16228 69 | 5.73 | o | |
| 73 | 02 45 54.2 | +36 49 59 | S0 | 15988 31 | 10.53 | o | |
| 75 | GIN 136 | 02 45 48.3 | +36 51 13 | E | 13620 33 | l1 | |
| 76 | GIN 137 | 02 45 43.8 | +36 51 17 | E | 13983 66 | 8.25 | o |
| LEDA074141 | 14142 48 | l1 | |||||
| 78 | 02 45 41.9 | +36 50 59 | S | 13661 49 | 4.66 | o | |
| 79 | 02 45 33.5 | +36 51 43 | S0 | — | o2 | ||
| 81 | 02 45 28.6 | +36 50 58 | S0 | 14256 89 | 3.58 | o | |
| 82 | 02 45 22.6 | +36 50 32 | S0/S | — | o3 | ||
| 83 | 02 45 16.5 | +36 50 45 | S0 | — | o4 | ||
| 84 | 02 45 17.7 | +36 55 05 | S0 | 13371 71 | 5.69 | o | |
| 85 | 02 45 14.4 | +36 53 10 | S0 | 14354 74 | 5.54 | o | |
| 86 | 02 44 50.0 | +36 55 06 | S | 13317 79 | 4.70 | o | |
| 89 | 02 47 29.2 | +36 57 44 | S/S0 | 12550 39 | 6.74 | o | |
| 91 | 02 46 57.6 | +37 01 11 | S0 | 16019 26 | 10.65 | o | |
| 92 | GIN 138 | 02 46 50.0 | +36 58 45 | S0 | 14798 27 | 12.98 | o |
| 14825 21 | l1 | ||||||
| 93 | 02 46 29.8 | +36 58 37 | E | 15764 34 | 9.17 | o | |
| 94 | 02 46 22.7 | +36 57 38 | S0 | 15969 34 | 12.83 | o | |
| 95 | 02 46 06.3 | +36 58 42 | S | 15012 28 | 10.74 | o | |
| 96 | 02 46 06.1 | +36 57 10 | E | 13552 37 | 10.18 | o | |
| 97 | 02 45 55.3 | +36 57 10 | S0 | 13974 37 | 8.46 | o | |
| 98 | 02 45 50.2 | +36 57 20 | S0 | 14861 36 | 9.81 | o | |
| 100 | 02 45 43.8 | +36 57 26 | S0 | 13831 89 | 5.46 | o | |
| 101 | 02 45 44.3 | +36 56 34 | S0 | 15196 77 | 6.17 | o | |
| 102 | 02 45 38.3 | +36 59 04 | S/S0 | 12722 46 | 9.30 | o | |
| 103 | 02 45 36.1 | +36 58 19 | S | 16162 86 | 9.02 | o | |
| 104 | 02 45 28.2 | +36 57 25 | S0 | 13789 71 | 4.30 | o | |
| 106 | 02 44 53.5 | +36 58 17 | S0/S | 14557 71 | 5.02 | o | |
| 111 | 02 45 09.7 | +37 05 44 | S | 13749 72 | 6.96 | o | |
Notes:
l1 from Wegner et al. (1999); l2 from Postman and Lauer 1995).
1 emission line: Oii ;
2 aligned star with a foreground galaxy ();
3 dominant M star;
4 dominant star;
-
1.
Dressler (1980) number;
-
2.
alternative name LEDA, UGC, GIN or MCG;
-
3.
right ascension (J2000);
-
4.
declination (J2000);
-
5.
morphological type from Dressler’s (1980) catalogue;
-
6.
heliocentric radial velocity with its error in ;
-
7.
R-value derived from Tonry & Davis (1979);
-
8.
telescope and notes, o: 1.93m OHP telescope + CARELEC spectrograph; p 2.0m Pic du Midi telescope + ISARD spectrograph.
Note that no velocity could be derived from objects number 17, 79, 82, 83 because of the presence of a foreground star. For galaxies already observed by Wegner et al. (1991) and/or Postman and Lauer (1995), velocity comparison was made separately for objects number 25, 28, 71, 76, and 92. We obtain , the standard deviation of the difference being . These results are consistent with the errors of Table 1. The velocities in the present study agree with those previously published within the level.
3 Galaxy distribution
We present in Figure 1 the adaptative density map of the projected distribution of galaxies brighter than obtained from the POSS I Revised APS Catalogue444The University of Minnesota Automated Plate Scanner; the -band is the characteristic band of the blue plates of the First Palomar Sky Survey (Minkowski & Abell 1963)., in a arcmin2 region centered on the position of the brightest cluster member of Abell 376, E/D galaxy number 71 of Table 1. This corresponds to a region of about Mpc2 at the distance of Abell 376 (, see below). The central square region, of about arcmin2,indicates the area where redshifts have been measured (see previous Section). The positions of the brightest galaxies have been superimposed to the density map.
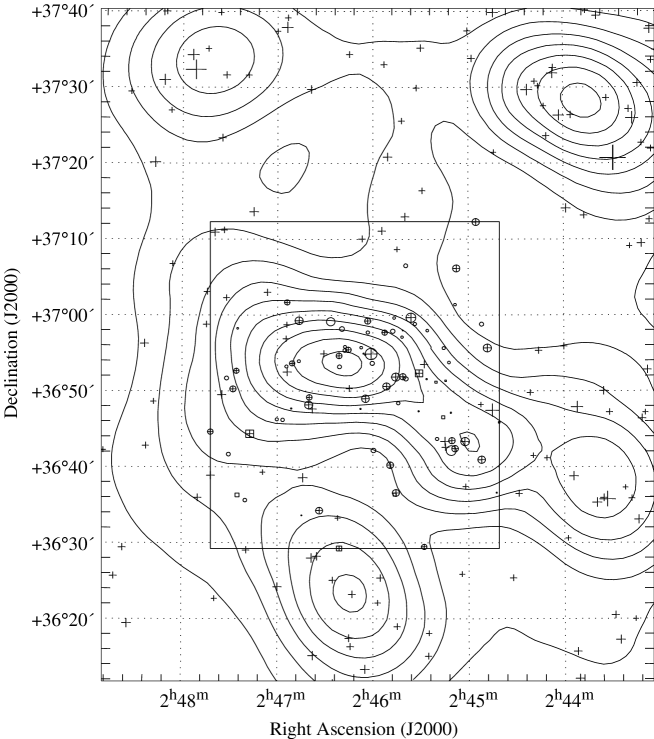
As it can be seen from this figure, the entire field is filled with structures among which Abell 376 stands as the central dominant one. The density map suggests that Abell 376 has a regular galaxy distribution, flattened in the NE-SW direction. A substructure is present at SW, which is centered on a clump of bright galaxies around galaxy number 28, classified as E by Dressler (1980). As discussed in the next section, this clump may be considered as kinematically belonging to Abell 376 cluster. This figure also indicates that the cluster radial extension may attain several Mpc.
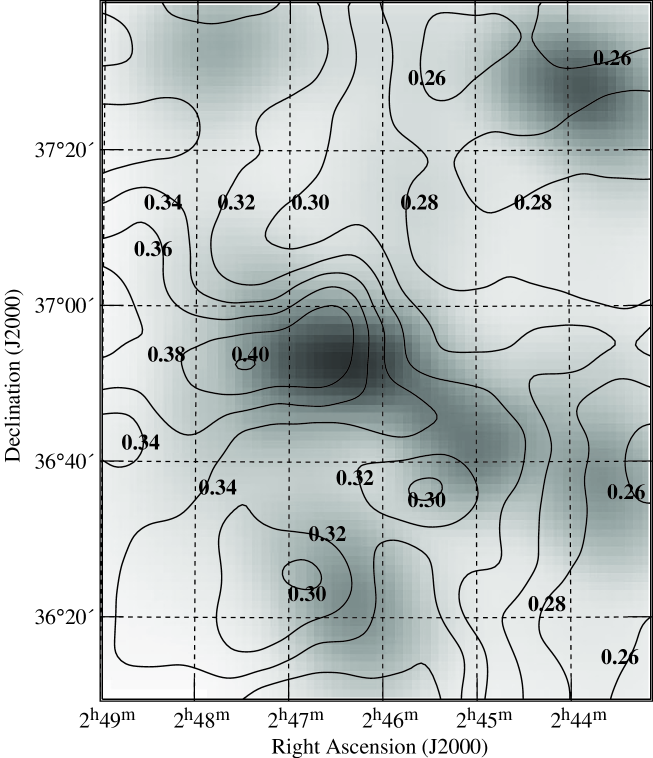
However since Abell 376 lies close to the galactic plane (), before trying to discuss its apparent projected galaxy distribution, we should be confident that the galactic extinction is not significantly affecting the magnitudes and counts. Figure 2 shows the map of galactic absorption estimated from Schlegel et al. (1998), with a resolution of 2.5 arcmin. The colour excess E() was transformed to the -magnitudes using the appropriate transmission curve from Larsen (1996), given in the APS site555http://aps.umn.edu/Docs/photometry.aps.html and the Table 6 from Schlegel et al. (1998). As it can be seen, although this map bears a vague resemblance with density the distribution of galaxies given in Figure 1, the absorption never attains values higher than and thus it should not significantly affect the apparent distribution of galaxies.
Considering only galaxies brighter than , the central peak of density is displaced by arcmin E, relative to the central E/D galaxy. However there is no such a displacement when considering galaxies brighter than (see also Figure 4). For , central densities amount to Mpc.
There is no redshift information about the dense NW condensation seen in Figure 1 since redshifts measurements are restricted in a square region around Abell 376. However a hint about its relative distance to Abell 376 may be given by comparing the apparent magnitude distribution of galaxies in Abell 376 with that of the NW condensation. This comparison is made in Figure 3, where we also show the magnitude distribution of galaxies with measured redshifts. As it can be seen, both histograms, for Abell 376 and for the NW condensation, show almost the same slope, suggesting that both are about the same distance and probably belong to the same superstructure.
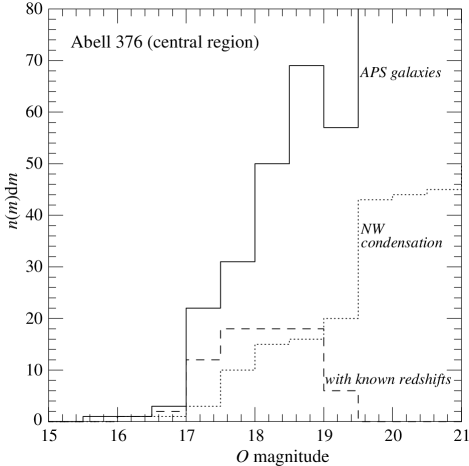
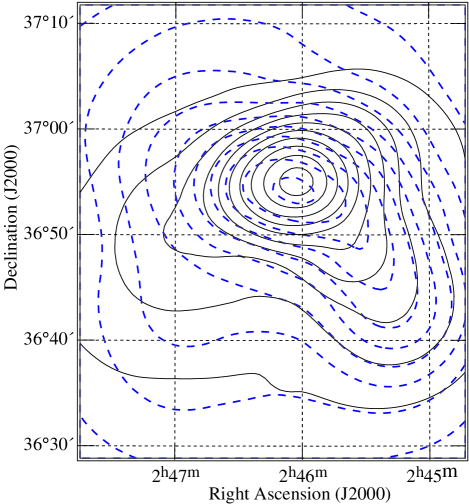
The histogram in Figure 3 also indicates that the sample of measured radial velocities in the central region of Abell 376 is % complete at . This is indeed a very shallow magnitude limit, given the distance of this cluster. Figure 4 shows a comparison of the surface density map of projected galaxies brighter than together with the redshift sample of galaxies discussed above, which, as discussed in the next Section, comprises galaxies kinematically members of the cluster. As it can be seen, excepted in the SE direction, the galaxies with measured redshift sample well the projected galaxy distribution. Therefore, despite the incompleteness of the redshift sample, it will be possible to discuss the line of sight (l.o.s.) velocity distribution at least in a qualitative way.
4 Velocity analysis
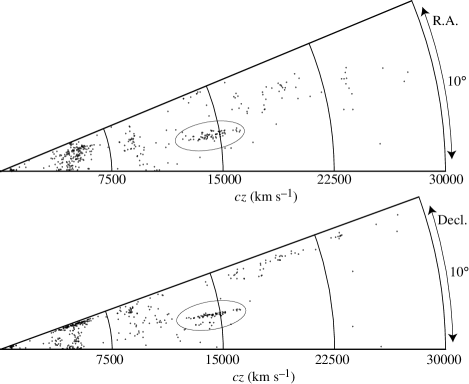
Including previous measurements (Capelato et al. 1991, Postman and Lauer (1995), Wegner et al. (1999), there is a total of 73 measured velocities for Abell 376. Using this sample we will discuss the cluster velocity distribution, looking for non-equilibrium effects. The wedge diagrams of galaxies in right ascension and declination are displayed in Figure 5. Both show the cluster and all galaxies collected from the NED database in a radius of 300 arcmin around the cluster centre (476 objects). One can see that Abell 376 does not show any connection or extension with other evident structure.
We used the ROSTAT package (Beers et al. 1990; Bird & Beers 1993) to analyze the distribution of the 63 galaxies in the selected velocity range (for galaxies with more than one value of radial velocity in Table 1, a mean value was assumed). In order to quantify the central location and scale of the velocity distribution for Abell 376, we have used the resistant and robust bi-weight estimators ( and , respectively) recommended by Beers et al. 1990). For this sample of velocities, we obtain and . Estimates of these quantities obtained with alternative estimators show similar values. The one-sigma errors in these quantities are calculated in ROSTAT by bootstrap re-sampling of 1000 subsamples of the velocity data. For comparison, the radial velocity of the E/D galaxy located at the centre of the main cluster is , near that of the whole cluster, as should be expected if this is the dominant cluster galaxy.
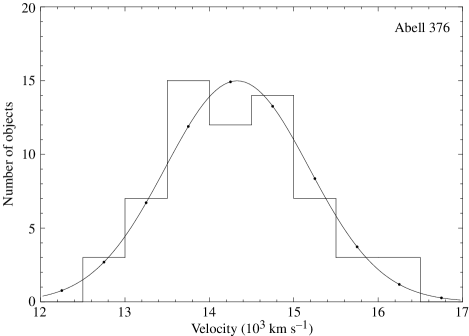
If we consider the morphological types, the mean velocities and corrected velocity dispersions are: , for E S0 galaxies (48 objects) and , for S I galaxies (22 objects). As what is observed in most clusters, the velocity dispersion of the late-type population tends to be larger than that of the early-type population (Sodré et al. 1989, Stein 1997, Carlberg et al. 1997, Adami et al. 1998). Figure 6 presents the radial velocity distribution of the cluster galaxies as well as a Gaussian curve with the same mean velocity and dispersion observed for these galaxies between 12000 and . Note that the velocity distribution obtained with a larger set of velocities does not confirm the relative depletion of galaxies with proposed by Capelato et al. (1991).
5 X-ray emission and gas distribution
Abell 376 is an average X-ray source, first detected by the Uhuru satellite (Kellogg et al. 1973). It was then observed by Einstein IPC, Exosat, ROSAT HRI and PSPC (part of the ROSAT all-sky survey), and ASCA. Abell 376 is included in the XBACs catalogue (X-ray Brightest Abell type Cluster, Ebeling et al. 1996).
The physical properties of Abell 376 intracluster medium (ICM) were first obtained with Exosat data in the [0.1–20.0] keV band (Edge & Stewart 1991). Using the RS thermal plasma model (Raymond & Smith 1977) to fit the Exosat X-ray spectrum, they derived a mean temperature for the ICM, keV (90% confidence) and an X-ray flux in the [2.0–10.0] keV band, erg cm-2s-1, which corresponds to a bolometric luminosity of erg s-1. The deprojection analysis of the Exosat image suggested a mild cooling flow, with a mass flow rate of yr-1 and a cooling radius kpc.
The ROSAT PSPC observation of Abell 376 was analyzed as part of the XBACs catalogue (Ebeling et al. 1996). The temperature was fixed using the EXOSAT value (see above) and the derived flux (assuming a fixed metallicity of ) was erg cm-2s-1 in the [2.0–10.0] keV band.
White et al. (1997) analyzed the Einstein IPC X-ray image of Abell 376 with a deprojection technique. In order to be applied, they used the ICM temperature given by Edge & Stewart (1991) as an input to the deprojection. The resultant temperature was thus keV and the bolometric luminosity, erg s-1. They also derived a weak cooling-flow, with a mass deposit rate of yr-1 inside a cooling radius of kpc, well in agreement with the previous result based on Exosat data.
The imaging analysis also yields the gas and dynamical masses. Within the outer radius, where the observation was meaningful (kpc), White et al. (1997) estimated and .
From the HEASARC Online Service, we have downloaded the ROSAT HRI and ASCA GIS data files. As far as we know, these are still unpublished data. With the HRI data, we have created an exposure-map, vignetting corrected broad-band image following the “cookbook” from Snowden & Kuntz (1998); this image was then adaptatively smoothed.
The ASCA GIS spectrum and image were extracted and cleaned with XSELECT 1.4b following the “ASCA data reduction guide”666http://heasarc.gsfc.nasa.gov/docs/asca/abc/abc.html. We have used the GIS background files provided by the ASCA guest observer facility (GOF). For the spectroscopy, the GIS data was selected in a circle of 8.1 arcmin centered in the BCG and in the [0.2–10.5] keV energy band, then rebinned with a minimum of 30 counts per energy bin.
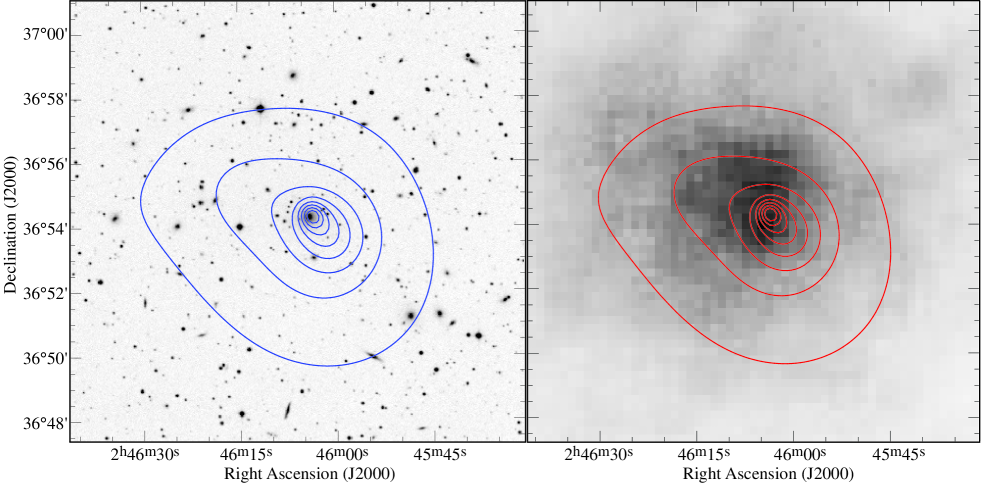
In Fig. 7 we show both an optical DSS and ASCA X-ray image superposed with the smoothed HRI image isocontours. The X-ray centre as determined by the HRI coincides with the central elliptical galaxy of Abell 376. There is a good agreement between HRI and GIS images, although there seem to be a small offset between them. Such an offset is actually comparable to the known uncertainty of the ASCA aspect solution.
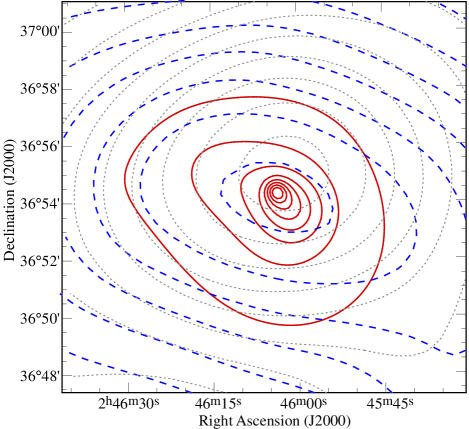
The X-ray images, ROSAT HRI and ASCA GIS, probe only the central arcmin region and they show no evident sign of substructure. The X-ray isocontours are not spherical or elliptical and are elongated roughly in a Northeast–Southwest direction. Comparison between the X-ray emission and the cluster galaxy distribution (Fig. 8) shows a good qualitative agreement between both gas and galaxy spatial distribution, when considering only objects within . This agreement may extend further on, since the orientation of the external isopleths seen in Fig. 4 are close to the inner contours. When we take into account all APS galaxies brighter than , there is an offset between X-ray emission and galaxy distribution close to the North-South direction.
The ASCA X-ray spectrum was fitted with a single temperature, absorbed MEKAL model (Kaastra & Mewe 1993; Liedahl et al. 1995) using XSPEC 11. We have tried two fits fixing the hydrogen column density to the galactic value, cm-2 (Dickey & Lockman, 1990), and allowing it to vary as a free parameter. The results are summarized in Table 2 and shown in Fig. 9
| /d.o.f. | |||
|---|---|---|---|
| cm-2 | (kev) | ||
| 6.76 | 130.0/173 | ||
| 122.4/172 |
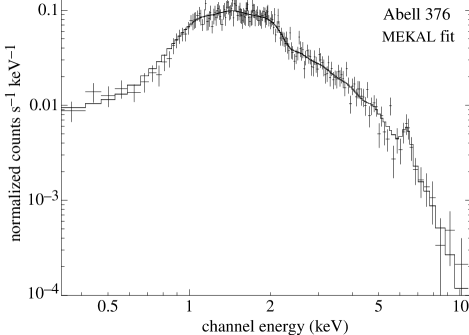
The mean temperature obtained depends whether is fixed or not (a well known anti-correlation between spectral fitted temperature and ), but are within error bars. The temperatures we got are slightly cooler than the ones obtained with ROSAT and Exosat. The same happens with the metal abundance; when is fixed the obtained metallicity is lower.
The derived flux and luminosity are about the same with the two fits in Table 2: in the [2.0–10.0 keV] band we have erg s-1cm-2 and erg s-1.
Using the scaling relations obtained by Xue & Wu (2000) we have (with the – relation), and (with the – relation). Here we have adopted the mean temperature of the two fits, keV. The value of is, however, ill constrained and depends on the few spectral points below keV and a better value for the temperature may be the one from the first fit, keV. In this case, .
6 Morphological and spectral classification
It has been shown that it is possible to classify galaxies from their spectra, and that this spectral classification correlates well with morphological types (e.g., Folkes et al. 1996, Sodré & Cuevas 1997, Madgwick et al. 2002). Since for Abell 376 we have the morphological classification done by Dressler (1980), it is interesting to verify how his Hubble types compare with spectral types obtained from galaxy spectra.
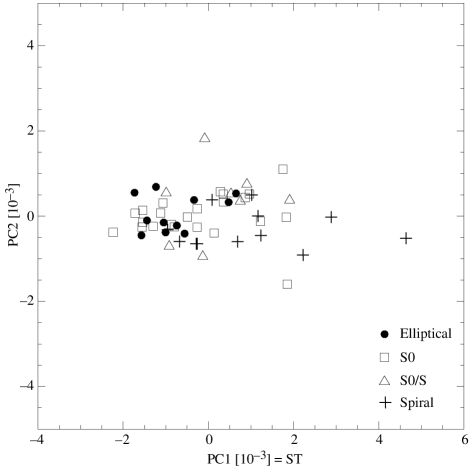
The basis of spectral classification is that normal galaxy spectra form a well defined sequence in the spectral space spanned by the dimensional vectors that contain the spectra, each vector being the flux of a galaxy (or a scaled version of it) sampled at wavelengths. We define the spectral type of a galaxy by its position along the spectral sequence, identified through a principal component analysis (PCA) of the galaxy spectra (see Sodré & Cuevas 1997 and Sodré & Stasińska 1999 for more details).
Here, the analysis has been done using 54 spectra of cluster galaxies with high signal-to-noise ratios. Initially the spectra were shifted to the rest frame and re-sampled in the wavelength interval from 3784 Å to 6100 Å, in equal bins of 2 Å. After, we removed from the analysis 8 regions of Å each centered at wavelengths that may contain emission lines, because the inclusion of emission lines in the analysis increases the dispersion of the spectral sequence. The spectra were then normalized to the same mean flux () and the mean spectrum was computed and removed from the galaxy spectra. PCA was then used to obtain the principal components.
Figure 9 shows the projection of the 54 spectra on to the plane defined by the first two principal components. The first principal component contains 39% of the sample variance, whereas the second component carries 7% of the variance. We identify the spectral type ST of a galaxy with the value of its first principal component. In Fig. 9 different symbols correspond to different morphological types: filled circles, open squares, open triangles, and crosses represent E, S0, S0/S, and S galaxies, respectively. The mean values of ST for each of these 4 classes are , , , and , respectively. This result confirms that the spectral sequence is closed related to the morphological sequence, since the ranking of galaxies of different morphological types along the first principal component is analogous to that found in the Hubble sequence, despite the strong overlap in the values of ST between different classes. Note that although the values of the principal components are dependent on the data and its pre-processing, the ranking of galaxies along the first principal component is in large extent independent of the pre-processing adopted.
7 Cluster virial mass
We have estimated the cluster mass inside its virial radius with the virial mass estimator (VME), which gives less biased mass estimates when the system is not completely sampled (e.g., Aceves & Perea 1999). The virial radius of Abell 376 was estimated through an iterative procedure with the relation Mpc (Girardi et al. 1998), where is the projected velocity dispersion.
Initially, we estimated the virial radius from the 62 galaxies with radial velocities between 12000 km s-1 and 17000 km s-1. Then, considering only galaxies within the virial radius, was re-evaluated and a new virial radius was computed. New iterations do not changed the value of the virial radius, Mpc (arcmin), which is larger than the 28 arcmin ( Mpc) central region where radial velocities were measured.
The resulting mass within is , where the error is a standard deviation computed with the bootstrap method. Note that the VME assumes that the system is virialized, but substructures or large-scale flows tend to increase the velocity dispersion of the cluster galaxies, leading to an overestimation of the cluster mass. In a radius of 28 arcmin, the only feature visible is the SW substructure, that is not even detected in the velocity-space (see Sect. 4),
8 Conclusion
In this paper, we have reported new velocity measurements on the Abell 376 cluster of galaxies and an X-ray analysis of previously unpublished ASCA data. This allowed us to define almost complete samples of galaxies in the central part of the cluster, and to discuss the dynamical status of this cluster. The study of the galaxy projected positions reveals a regular distribution, centered on an E/D dominant galaxy. The analysis with the adaptive kernel density map indicates the presence of a substructure SW of the cluster main galaxy concentration which is not confirmed by the velocity field, implying that it may be a fortuitous condensation of galaxies bound to Abell 376. Our dynamical analysis give for Abell 376 a virial mass about within 70% of the virial radius of the cluster. The velocity dispersion derived from the X-ray analysis is in agreement with the galaxy velocity distribution. We conclude that Abell 376 is a bona fide relaxed cluster inside kpc or % of the virial radius, fairly relaxed inside with only a minor substructure, and clumpier as we reach the virial radius, where possible substructures are detected in the galaxy distribution.
Acknowledgements.
We thank the OHP and Pic du Midi staff for their assistance during the observations. HVC, LSJ and GBLN thank the financial support provided by FAPESP and CNPq. DP acknowledges the France-Brazil PICS-1080 and IAG/USP for its hospitality.References
- (1) Abell, G.O., Corwin, H.G., Olowin, R.P., 1989, ApJS 70, 1
- (2) Aceves, H., Perea, J., 1999, AA, 345, 439
- (3) Adami, C., Biviano, A., Mazure, A., 1998, AA, 331, 439
- (4) Allen, S.W., 1998, MNRAS 296, 392
- (5) Beers, T.C., Flynn, K., Gebhardt, K, 1990, AJ 100, 32
- (6) Bird, C.M., Beers T.C., 1993, AJ 105, 159
- (7) Burstein, D., Baggley, G., 1999, MNRAS 305, 259
- (8) Capelato, H.V., Mazure, A., Proust, D., et al. , 1991, AAS 90, 355
- (9) Carlberg, R.G., Yee, H.K.C., Ellingson, E., 1997, ApJ 478, 462
- De Grandi & Molendi (2002) De Grandi, S., Molendi, S., 2002, ApJ 567, 163
- Dickey & Lockman (1990) Dickey, J.M., Lockman, F.J., 1990, ARA&A 28, 215
- (12) Dressler, A., 1980, ApJS 42, 565
- (13) Ebeling, H., Voges W., Bohringer, H et al. , 1996, MNRAS 281, 799
- (14) Edge, A.C., Stewart, G.C., 1991, MNRAS 252, 414
- (15) Folkes, S.R., Lahav, O., Maddox, S.J., 1996, MNRAS 283, 651
- (16) Girardi, M., Giuricin, G., Mardirossian, F., Mezzetti, M., Boschin, W. 1998, ApJ 505, 74
- Kaastra & Mewe (1993) Kaastra, J.S., Mewe, R., 1993, A&AS 97, 443
- (18) Kellogg, E., Murray, S., Giaconni, R., Tananbaum, H., Gursky, H., 1973, ApJ 185, L13
- (19) Kolokotronis, V., Basilakos, S., Plionis, M., Georgantopoulos, I., 2001, MNRAS 320, 49
- (20) Kurtz, M.J., Mink, D.J., Wyatt, W.F., et al. 1991, ASP Conf. Ser., 25, 432
- (21) Laine, S., van der Marel, R.P., Lauer, T.R., Postman, M., O’Dea, C.P., Owen, F.N., 2003, AJ 125, 478
- Larsen (1996) Larsen, J.A., 1996, PhD Thesis, University of Minnesota
- (23) Lauer, T. R., et al., 1995, AJ 110, 2622
- Liedahl et al. (1995) Liedahl, D.A., Osterheld, A.L., Goldstein, W.H., 1995, ApJ 438, L115
- (25) Lub, J., 1992, AAS 96, 389
- (26) Madgwick, D.S., Lahav, O., Baldry, I.K., et al. (2dF team), 2002, MNRAS, 333, 133
- (27) Mellier, Y., 1999, ARA&A 37, 127
- (28) Mink, D.J., Wyatt, W.F., 1995, ASP Conf. Ser., 77, 496
- Minkowski & Abell (1963) Minkowski, R., Abell, G.O., 1963, Stars and Stellar Systems Vol.III, Basic Astronomical Data, ed. K. Aa. Strand (Chicago, The University of Chicago Press), pp. 481-487
- (30) Mushotzky, R.F., Loewenstein, M., Arnaud, K., Kukasawa, Y., 1995, in Dark Matter, ed. S.S. Holt & C.L. Bennett (New York AIP), 231
- (31) Postman, M., Lauer, T.R. 1995, ApJ 440, 28
- (32) Proust, D., Quintana, H., Mazure, A., da Souza, R., Escalera, E., Sodré, L., Capelato, H.V., 1992, A&A 258, 243
- (33) Proust, D., Mazure, A., Vanderriest, C., Sodré, L., Capelato, H.V., 1995, A&AS 114, 565
- (34) Proust, D., Cuevas, H., Capelato, H.V., Sodré, L., Tomé-Lehodey, B., Le Fèvre, O., Mazure, A., 2000, AA 355, 443
- (35) Raymond, J.C., Smith, B.W., 1977, ApJS 35, 419
- (36) Richstone, D., Loeb, A., Turner, E.L., 1992, ApJ 393, 477
- Schlegel et al. (1998) Schlegel, D.J., Finkbeiner, D.P., Davis, M., 1998, ApJ 500, 525
- (38) Snowden, S.L., Kuntz, K.D., 1998, Cookbook for analysis procedures for ROSAT XRT observations of extended objects and the diffuse background, US ROSAT Science Data Center, NASA/GSFC
- (39) Sodré, L., Cuevas, H., 1997, MNRAS 287, 137
- (40) Sodré, L., Stasińska, G., 1999, AA 345, 391
- (41) Sodré, L., Proust, D., Capelato, H.V., Lima Neto, G.B., Cuevas, H., Quintana, H., Fouqué, P., 2001, AA 377, 428
- (42) Sodré, L., Capelato, H.V., Steiner, J.E., Mazure, A. 1989, AJ 97, 1279
- (43) Stein, P., 1997, AA 317, 670
- (44) Tonry, J., Davis M., 1979, AJ 84, 1511
- (45) Wegner, G., Colless, M., Saglia R.P., Mc Mahon, R.K., Davies, R.L., 1999, MNRAS 305, 259
- (46) White, D.A., Jones, C., Forman, W., 1997, MNRAS 292, 419
- (47) Wu X.P., Xue Y.J., Fang L.Z., 1999, ApJ 524, 22
- (48) Xue, Y.-J., Wu, X.-P., 2000, ApJ 538, 65