Modeling of the Lyman satellites in FUSE spectra of DA white dwarfs††thanks: This paper is dedicated in memory of J. L. Greenstein, discoverer of the quasi-molecular lines in white dwarfs, who passed away on October 21, 2002.
We present new theoretical calculations of the line profile of Lyman that include transitions in which a photon is absorbed by a neutral hydrogen atom while it interacts with a proton. Models show that two absorption features located near 992 Å and 996 Å are due to H-H+ collisions. These quasi-molecular satellites are similar to those that were identified in the wings of Lyman and Lyman lines of hydrogen-rich white dwarfs. We compute synthetic spectra that take account of these new theoretical profiles and compare them to the spectra of four DA white dwarfs that were observed with FUSE. The models predict the absorption features that are observed in the wing of Lyman near 995 Å, and confirm that these features are quasi-molecular satellites.
Key Words.:
Line: profiles – Radiation mechanisms: general – Stars: atmospheres – White dwarfs – Ultraviolet: stars1 Introduction
Quasi-molecular satellites are absorption features due to transitions that take place during close collisions of a radiating hydrogen atom with a perturbing atom or proton. These spectral features, which are present in the red wings of the Lyman series lines, provide an important source of opacity in the atmospheres of hydrogen-rich white dwarfs.
The IUE spectra of the DA white dwarf 40 Eri B were the first ones which revealed a strong, unexpected absorption feature near 1400 Å (Greenstein 1980). Absorption features near 1600 Å were thereafter detected in spectra of cooler DA white dwarfs (Holm et al. 1985). These features remained unexplained until Koester et al. (1985) and Nelan & Wegner (1985) simultaneously identified them as quasi-molecular satellites of the Lyman line. The H2 and H satellites at 1600 Å and 1400 Å were thereafter observed in other DA white dwarfs, as well as in laboratory plasmas (Kielkopf & Allard 1995). The H satellite absorption features at 1058 Å and 1076 Å were first identified in the spectrum of the DA white dwarf Wolf 1346, as observed with HUT (Koester et al. 1996). ORFEUS (Koester et al. 1998) and FUSE (Wolff et al. 2001; Hébrard et al. 2002b) observations allow these Lyman satellites to be observed in other targets.
New calculations for the absorption profiles of Lyman line of atomic hydrogen perturbed by protons have been used to predict synthetic spectra of hot hydrogen-rich white dwarfs and allow the identification of a strong feature near 995 Å. This feature was present in the HUT spectrum of Wolf$ 1346$ (Koester et al. 1996) but it is only in Koester et al. (1998) that a similar feature present in ORFEUS spectra of WD 1031114 and WD 0644375 was suspected to be a new satellite in the wing of Lyman . It was also distinctly detected in FUSE spectra of CD$ -38^∘10980$ (Wolff et al. 2001) and of Sirius B (Holberg 2002).
These last two recent observations provided motivation to investigate the theory of the Lyman line profile using accurate theoretical molecular potentials, instead of using the simple Stark broadening approximation. Our new calculations of Lyman satellites are summarized in Sect. 2. We present in Sect. 3 a comparison between synthetic spectra including Lyman satellites and the FUSE spectra of four DA white dwarfs. The results are discussed in Sect. 4.
2 Theoretical line profiles
The theoretical approach is based on the theory of pressure broadening due to Baranger (1958), developed in an “adiabatic representation” that does not exclude degeneracy of atomic levels. A detailed description of our semi-classical approach as applied to the shape of the Lyman lines has been given by Allard et al. (1994) and Allard et al. (1999).
The Lyman profile and its satellites are calculated for physical conditions encountered in the atmospheres of white dwarfs. Because the density of the hydrogen atoms is low (1015 to 1017 cm-3), we computed the line profile by using the low density approximation as described by Allard et al. (1994). This approximation uses the expansion of the autocorrelation function in powers of density. We also used accurate theoretical potentials describing the binary interactions of one hydrogen atom with a ionized hydrogen atom. The H molecular potentials are available for the H () states (Madsen & Peek 1971). We computed all those related to using a code kindly provided by J. Peek.
Our theoretical approach allows the variation of the radiative dipole moment during a collision. But through lack of appropriate data for Lyman , we assumed that the dipole moment for the transitions is constant. Such approximation has been applied to the calculations of the quasi-molecular satellites observed in the IUE and HST spectra of white dwarfs (see, e.g., Koester & Allard 1993; Koester et al. 1994; Bergeron et al. 1995). In the last section we discuss the possible effects of a variable dipole moment on the line profile calculations.
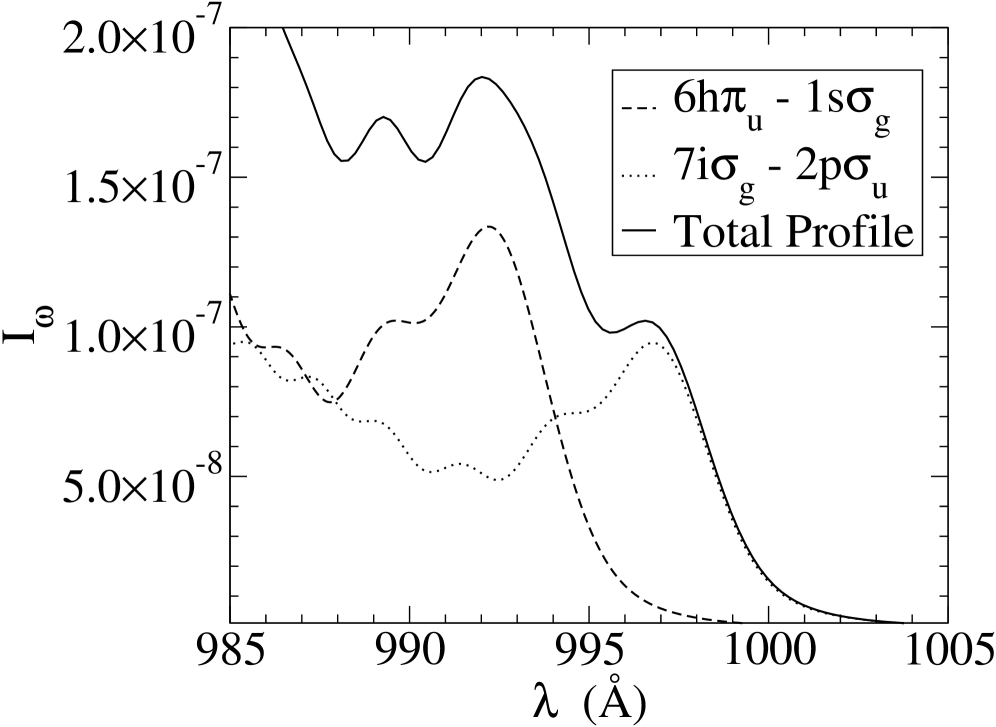
An H correlation diagram was constructed for Lyman (Allard et al. 2003), to which 14 transitions contribute. Two of these transitions, and , yield satellites in the red portion of Lyman at 992 Å and 996 Å. Fig. 1 shows the profiles of both individual satellites and their effect on the total profile of Lyman . We obtain a blend of the line satellites with a maximum near 992 Å. The profile gives a shape similar to the 995 Å feature observed in white dwarf spectra.
3 Astronomical applications to synthetic spectra for DA white dwarfs
Atmosphere models have been calculated using the programs TLUSTY (Hubeny 1988; Hubeny & Lanz 1992, 1995). We considered LTE model atmospheres with pure hydrogen composition that explicitly include the Lyman and Lyman quasi-molecular opacities. The resulting spectra were computed by using the spectral synthesis code SYNSPEC that incorporates the quasi-molecular satellites of Lyman , Lyman , and Lyman . Models predict that the Lyman satellites are visible roughly for effective temperatures between K and K. We verified that non-LTE effects are unimportant in the range of effective temperatures considered in this study.
| Target | Observation | Obs. Date | Mode | Slit | Exp. (ks) | CalFUSEa | ||
|---|---|---|---|---|---|---|---|---|
| Wolf | B1190501 | Jul 2001 | TTAG | LWRS | 5.8 | 1.8.7 | 8.0 | |
| EG | B1190301 | May 2001 | TTAG | LWRS | 10.7 | 1.8.7 | 7.9 | |
| S6010401 | Jan 2002 | TTAG | LWRS | 17.4 | 1.8.7 | |||
| BPM | Z9104501 | Jun 2002 | TTAG | LWRS | 32.0 | 1.8.7 | 7.9 | |
| CD | Q1100101 | Jul 2000 | HIST | MDRS | 4.8 | 2.2.1 | 7.9 |
a Version of the pipeline used for spectral extraction.
We used observations of four DA white dwarfs performed with FUSE (Moos et al. 2000). The spectra were obtained between 2000 and 2002 and were retrieved from the FUSE public database (see Table 1). The one-dimensional spectra were extracted from the two-dimensional detector images and calibrated using the CalFUSE pipeline. When possible, we did not use exposures with strong airglow emission. We also excluded regions of the spectra near the edges of the detector segments, which provide poor quality data. The eight FUSE detector segments of the different exposures were co-added together and projected on a Å-pixel base, so pixels about 25 times larger than the original FUSE detector pixels. This degradation of the FUSE spectral resolution (typically for this kind of target with the slit LWRS or MDRS; see Hébrard et al. 2002a or Wood et al. 2002) has no effect on the shapes of the large stellar features which we study and allows the signal-to-noise ratio to be increased.
In Fig. 2 we compare the FUSE spectra with the models that we obtained for these targets. The effective temperatures are within the intermediate temperature range for the visibility of both the Lyman and Lyman satellites. The agreement indicates, by the coincidence of position and approximate shape, that the large feature near 995 Å is indeed a satellite of Lyman due to the blend of two close features at 992 Å and 996 Å.
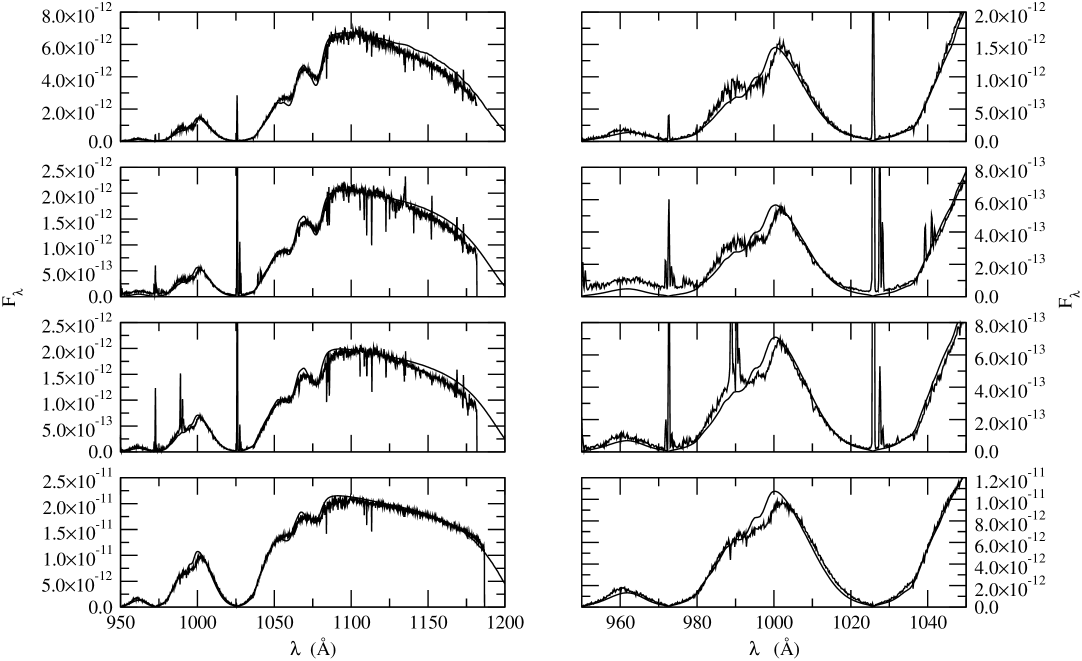
The first target plotted in Fig. 2 is Wolf. The comparison for the FUSE spectrum shows that the far UV is well fitted with a synthetic spectrum computed with our new profile calculations for and K. These atmospheric parameters are close to those determined from optical spectra (7.9; 20 000) and adopted by Koester et al. (1996) to fit the HUT spectrum of that white dwarf. The Lyman satellite, already observed in the HUT spectrum, is well-reproduced by our synthetic spectrum.
The next two objects, EG$ 102$ and BPM$ 6502$, are slightly hotter white dwarfs, with smaller gravities. We used the effective temperatures and gravities determined from optical spectra (Finley et al. 1997; Bragaglia et al. 1995). The predicted spectra for EG, with K and , and for BPM, with K and , fit quite well the FUSE spectra. In the case of BPM, all the FUSE exposures present strong airglow emissions, so it was not possible to remove them. These two stars are not normal DA white dwarfs: EG presents metallic lines (Holberg et al. 1997) and BPM is in a post common-envelope binary system (Kawka et al. 2000, 2002). These particularities seem however to have no effects on the quality of the fits.
The hottest object we present is CD. The FUSE observation that we used is the same as the one presented by Wolff et al. (2001), but our data reduction was performed with a more recent version of CalFUSE. Our best fit was obtained using K and . The values of the atmospheric parameters are slightly smaller than the ones determined from optical spectra (Vauclair et al. 1997) to get a better agreement with the Lyman satellite.
CD is near the upper limit of the expected visibility range of the Lyman satellites. Nevertheless, Lyman and Lyman quasi-molecular satellites have been observed in the FUSE spectrum of the ultra-massive white dwarf PG (K, ) as reported by Dupuis et al. (2001). We speculate that the presence of quasi-molecular satellites in this star is related to its high surface gravity and we will investigate the question in more details in Dupuis et al. (2003). It is interesting to note that Sirius B (K, ; Holberg et al. 1998), which also has a relatively high surface gravity, shows the quasi-molecular satellites (Holberg 2002).
Finally, the four spectra show a kink in the profile around 1037 Å that is well reproduced by our models (Fig. 2). This feature is probably the first identification of the H satellite of Lyman , as predicted in Fig. 7 of Allard et al. (1998a.)
4 Conclusion
The good agreement between the FUSE spectra and our calculations allowed the line satellites near 995 Å to be identified, although there are still some systematic discrepancies between the predicted and observed profiles. The shape of the profile in the region of the satellites is sensitive to the relative strength of these two main features. It is therefore important to get an accurate quantitative determination of the satellite amplitudes. Accurate theoretical molecular potentials have to be used to describe the interaction between the radiator and the perturber as we did in the work described here. Another important factor, not yet included, is the variation of the dipole moment during the collision. Allard et al. (1998a, 1998b, 1999) have shown that the strengths of line satellites are dependent on values of the electric-dipole moments at the internuclear separation responsible for the satellites. Large enhancements in the amplitudes of the satellites may occur whenever the dipole moment increases through the region of internuclear distance where the satellites are formed. The theoretical shape in this region of the profile is then dependent on the dipole moment of the transition. Some of the differences between the observed and the synthetic spectra may be due to our constant dipole moment approximation. That will be improved in future calculations.
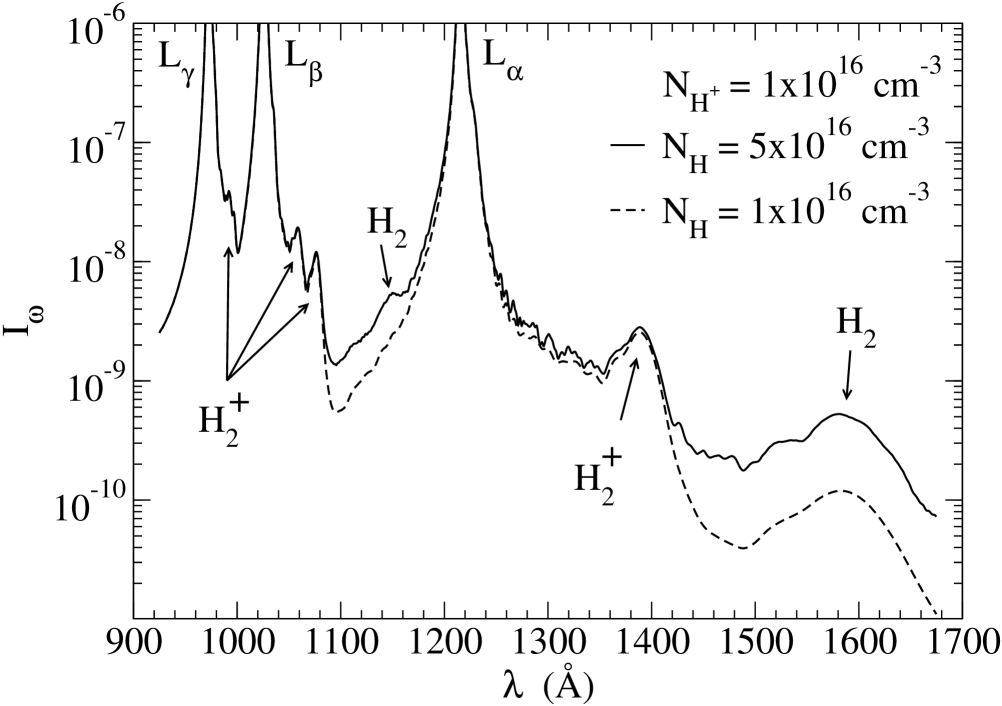
As a summary we present in Fig. 3 the sum of the profiles of Lyman , Lyman , and Lyman perturbed by collisions with neutral hydrogen and protons for two different densities of neutral hydrogen. We can note that beside the quasi-molecular lines already detected, there is another predicted H2 satellite at 1150 Å (Allard et al. 2000), in the red wing of Lyman , which should be observed in cool DA white dwarfs in the range of effective temperatures (11000 to 13000 K), where the variable ZZ Ceti objects are found (Hébrard et al. 2002b). This line satellite has never been observed in stars or laboratory plasmas. Future FUSE observations and ongoing study of the FUV spectrum of dense hydrogen plasmas may allow this feature to be detected.
Acknowledgements.
This work is based on data obtained by the NASA-CNES-CSA FUSE mission operated by the Johns Hopkins University. Financial support to U. S. participants has been provided by NASA contract NAS5-32985. French participants are supported by CNES. The molecular potential computation code was kindly provided by J. Peek; we would like to thank him.References
- (1) Allard, N. F., Koester, D., Feautrier, N., & Spielfiedel, A. 1994, A&A, 108, 417
- (2) Allard, N. F., Kielkopf, J. F., & Feautrier, N. 1998a, A&A, 330, 782
- (3) Allard, N. F., Drira, I., Gerbaldi, M., Kielkopf, J. F., & Spielfiedel, A. 1998b, A&A, 335, 1124
- (4) Allard, N. F., Royer, A., Kielkopf, J. F., & Feautrier, N. 1999, Phys. Rev. A, 60, 1021
- (5) Allard, N. F., Kielkopf, J. F., Drira, I., & Schmelcher, P. 2000, Eur. Phys. J. D, 12, 263
- (6) Allard, N. F., Kielkopf, J. F., Hébrard, G., & Peek, J. M. 2003, to be submitted to Eur. Phys. J. D
- (7) Baranger, M. 1958, Phys. Rev., 111, 481
- (8) Bergeron, P., Wesemael, F., Lamontagne, R., Fontaine, G., Saffer, R., & Allard, N. F. 1995, ApJ, 449, 258
- (9) Bragaglia, A., Renzini, A., & Bergeron, P. 1995, ApJ, 443, 735
- (10) Dupuis, J., Vennes, S., Lanz, T., & Chayer, P. 2001, American Astronomical Society Meeting, 199
- (11) Dupuis, J., Chayer, P., Vennes, S., Allard, N. F., Hébrard, G. 2003, to be submitted to ApJ
- (12) Finley, D. S., Koester, D., & Basri, G. 1997, ApJ, 488, 375
- (13) Greenstein, J. L. 1980, ApJ, 241, L89
- (14) Hébrard, G., Lemoine, M., et al. 2002a, ApJS 140, 103
- (15) Hébrard, G., Allard, N., Hubeny, I, et al. 2002b, A&A, 394, 647
- (16) Holberg, J. B., Barstow, M. A., & Green, E. M. 1997, ApJ, 474, L127
- (17) Holberg, J. B., Barstow, M. A., Bruhweiler, F. C., Cruise, A. M., & Penny, A. J. 1998, ApJ, 497, 935
- (18) Holberg, J. B. 2002, 13th European Workshop on WD, Napoli
- (19) Holm, A. V., Panek, R. J., Schiffer, F. H., et al. 1985, ApJ, 289, 774
- (20) Hubeny, I. 1988, Comp. Phys. Comm., 52, 103
- (21) Hubeny, I., & Lanz, T. 1992, A&A, 262, 501
- (22) Hubeny, I., & Lanz, T. 1995, ApJ, 439, 875
- (23) Kawka, A., et al., 2000, AJ, 120, 3250
- (24) Kawka, A., Vennes, S., Koch, R., & Williams, A. 2002, AJ, 124, 2853
- (25) Kielkopf, J. F., & Allard, N. F. 1995, ApJ, 450, L75
- (26) Koester, D., Weidemann, V., Zeidler, K.T., E. M., & Vauclair, G. 1985, A&A, 142, L5
- (27) Koester, D., & Allard, N. F. 1993, in White Dwarfs: Advances in Observation and Theory, ed. M. Barstow, (Kluwer: Dordrecht), p. 237
- (28) Koester, D., Allard, N. F., & Vauclair, G. 1994, A&A, 291, L9
- (29) Koester, D., Finley, D. S., Allard, N. F., Kruk, J. W., & Kimble, R. A. 1996, ApJ, 463, L93
- (30) Koester, D., Sperhake, U., Allard, N. F., Finley, D. S., & Jordan, S. 1998, A&A, 336, 276
- (31) Madsen, M. M., & Peek, J. M. 1971, Atomic Data, 2, 171
- (32) Moos, H. W., et al. 2000, ApJ, 538, L1
- (33) Nelan, E. P., & Wegner, G., 1985, ApJ, 289, L31
- (34) Vauclair, G., Schmidt, H., Koester, D., & Allard, N. 1997, A&A, 325, 1055
- (35) Wolff, B., Kruk, J. W., Koester, D., et al. 2001, A&A, 373, 674
- (36) Wood, B. E., Linsky, J. L., Hébrard, G., et al. 2002, ApJS, 140, 91