Chapter 1 An Estimate Of The Primary Mass Of Cosmic Rays At eV As Inferred From Volcano Ranch Data.
Abstract
Accurate measurements of the lateral distribution of extensive air showers produced by cosmic rays of energy greater than eV were made in the 1970s by Linsley. At the time, the state of knowledge about the best hadronic interaction model to use to describe such data prevented conclusions about the cosmic ray mass from being drawn. We have used a modern model, qgsjet98, to infer the primary mass from these data, using the very careful records left by Linsley. We find that at a median energy of eV , the data are well described by an iron-dominated composition (88 6(stat) 18 (syst))%. We discuss the systematic errors in this estimate that arise from model uncertainties and from the range of energies used in the work of Linsley. These data are used with the permission of the late John Linsley to whom this work is dedicated.
1. Introduction
Determining the mass composition above eV is an important and challenging measurement and has been tackled by several groups using different techniques. These results have not all been consistent in their conclusions. It is important to solve this problem because of its implications for cosmic ray models of origin, acceleration and propagation. We present a first interpretation of the precise Volcano Ranch measurements of the lateral distribution function using Monte Carlo tools that were not available when the data were recorded in the 1970s. The pioneering Volcano Ranch instrument was described by Linsley, in his various writings [2,3], with unusually detailed descriptions of his equipment, together with many shower details and a description of his data reduction methods.
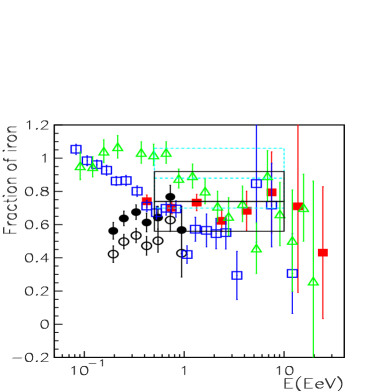
RIGHT: Fe fraction from various experiments: Fly’s Eye (), Agasa A100 (), Agasa A1 () using a sibyll 1.5 [4] and references therein, Haverah Park [5] using qgsjet98 () and qgsjet01 (). Mean composition determined in this paper with the corresponding error for the Volcano Ranch energy range using qgsjet98 (dashed rectangle) and an estimation of what it would result using qgsjet01 following [5] (solid line rectangle).


2. Derivation of the primary mass composition
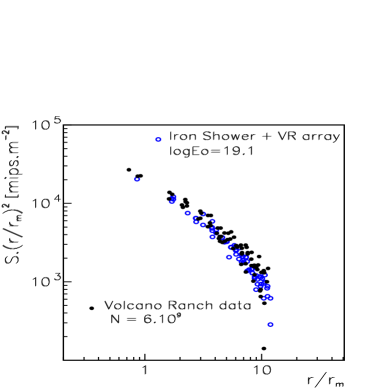
We have generated 1735 proton and iron showers with , and primary energy between eV and eV using the aires code (version 2.4.0), with the hadronic interaction generator qgsjet98. The results of the simulated showers were convolved with a simulation of the detector response made using geant4 to obtain the scintillator response [1]. As a second step, each simulated shower was thrown up to 100 times on to a simulated Volcano Ranch array with random core positions in the range 0-150 m from the array center. A comparison between lateral distribution measurements [2] and average eV iron showers including the scintillator response of the detectors in the Volcano Ranch array configuration is presented in Fig 1 (left). The agreement of the lateral distributions is good and gives confidence in the procedures used.
A generalized version of the Nishimura-Kamata-Greisen (NKG) formula was used by Linsley to describe the lateral distribution [3]:
From a subset of 366 showers detected with the array, the form of as a function of zenith angle and shower size was found to be [3] with :
| (1) |
with , , and .
We estimate the primary mass by a maximum likelihood fit of the best linear
combination of pure iron and proton generated samples to match the data sample
assuming a bi-modal composition.
The probability of observing a particular number of events in a particular bin is given by
where is the predicted value for the number of events in this particular bin.
If we assume a bi-modal composition of proton and iron with proportions and then,
and is the overall normalization factor between numbers of data and Monte Carlo events.
The estimates of the proportions are found by maximizing the total likelihood or its logarithm,
.
In Fig 2 we show the Monte Carlo pure iron sample (left) and pure proton sample (right) with the corresponding Volcano Ranch data points. As can be seen from Fig 2 (right), the tail at large , in the comparison with iron, indicates that a light component must be included to fit the experimental data. The best fit gives a mixture with (88 6)% of iron and a corresponding amount of protons. The resulting distribution is shown in Fig 2 (bottom) together with Volcano Ranch data. The systematic error arising from our lack of knowledge of the energy distribution of the events is estimated by repeating the fitting procedure with different energy spectra. From these analyses we estimate a systematic error of 12%. The systematic error introduced by the choice of hadronic model is estimated to be 14% [5].
3. Discussion and Conclusions
In Fig 1 (right) we present the fraction of iron for Fly’s Eye, Agasa and Haverah Park using different hadronic interaction models. Also shown is the mean composition with the corresponding error we get for the Volcano Ranch energy range using qgsjet98 and an estimation of what we would get using qgsjet01 as it was done in Haverah Park [5]. Cosmic rays at Volcano Ranch are found to be compatible with mean fraction (88 6(stat) 18 (syst))% of iron in a bi-modal proton and iron mix, in the energy range eV to eV with mean energy eV.
The inconsistency between measurements of mass composition needs to be addressed in order to make a more solid conclusion on the origin, acceleration or propagation of cosmic rays. This work attempts to help answer these important questions by re-interpreting the pioneering Volcano Ranch experiment, but in doing so has in some ways deepened the mystery of the origin of these particles. Qualitatively there are significant differences between the estimates of composition at energies above eV. So the questions appear far from being resolved.
4. References
1. M. T. Dova et al, Proceedings of the XII ISVHECRI, CERN, 15-20 July 2002.
2. J. Linsley, Proc. 13th ICRC, Denver, (1973) 3212.
3. J. Linsley, Proc. 15th ICRC, Plovdiv,(1977) 56-62-89.
4. B. R. Dawson et al, Astropart. Phys. 9 (1999) 331.
5. M. Ave et al., Astropart. Phys. 19 (2003) 61.