Ultra-Luminous X-ray Source Populations in Normal Galaxies: a Preliminary Survey with Chandra
Abstract
We present results of a Chandra survey of the ultra-luminous X-ray sources (ULX) in 13 normal galaxies, in which we combine source detection with X-ray flux measurement. 22 ULX were detected, i.e. with erg s-1 (), and 39 other sources were detected with erg s-1 (). We also use radial intensity profiles to remove extended sources from the sample. The majority of sources are not extended, which for a typical distance constrains the emission region size to less than 50 pc. X-ray colour-colour diagrams and spectral fitting results were examined for indicators of the ULX nature. In the case of the brighter sources, spectral fitting generally requires two-component models. In only a few cases do colour-colour diagrams or spectral fitting provide evidence of black hole nature. We find no evidence of a correlation with stellar mass, however there is a strong correlation with star formation as indicated by the 60 m flux as found in previous studies.
keywords:
accretion: accretion discs – binaries: close – black hole physics – X-rays: galaxies – X-rays: stars1 Introduction
Ultra-luminous X-ray sources (ULX) are intriguing, apparently point-like sources in external galaxies which are normally distinguished from bright central objects. Bright objects may be divided into those that exceed the Eddington limit for a 1.4 M neutron star of 2–4 erg s-1, and those with luminosity greater than erg s-1, which is the normal definition of an ULX. Observations of bright spiral galaxies with Einstein revealed substantial numbers of very bright X-ray sources external to the nuclear regions, i.e. 36 super-Eddington sources of which 16 were ULX (Fabbiano 1989). A significant fraction of the X-ray emission from galaxies has long been known to originate from X-ray binaries (e.g. Fabbiano 1989; Fabbiano, Kim & Trinchieri 1994, Fabbiano et al. 2001, Blanton et al. 2001). In a survey of nearby galaxies with Rosat, Roberts & Warwick (2000) found 28 ULX outside the nuclei. Similarly, Colbert & Mushotzky (1999) investigated extra-nuclear (2 arcmin offset) X-ray sources in 39 nearby galaxies finding 13 ULX. They suggested these were accreting black hole systems of 102–104 M. The spectra of 7 ULX in nearby galaxies studied using ASCA by Makishima et al. (2000) were well-fitted by a multi-colour disc blackbody model suggesting black hole nature. Chandra observations of galaxies have revealed a large number of previously unknown ULX, the luminosities of which extend from erg s-1 (Fabbiano, Zezas & Murray 2001; Blanton et al. 2001), suggesting that they may be quite common. With the advent of Chandra, it becomes possible to study ULX in more detail.
| Galaxy | Type | ObsID | Date | Exp | Resln | ||||
|---|---|---|---|---|---|---|---|---|---|
| ′ | 1020 cm-2 | dd/mm/yr | ks | pc | |||||
| NGC 4636 | E0-1 | -4.8 | 6.0 | 1.8 | 323 | 26/01/00 | 52 | 36 | |
| NGC 1132 | E | -4.8 | 2.5 | 5.2 | 801 | 10/12/99 | 13 | 170 | |
| NGC 4697 | E6 | -4.7 | 7.2 | 2.2 | 784 | 15/01/00 | 39 | 28 | |
| NGC 1399 | E1 | -4.5 | 6.9 | 1.3 | 319 | 18/01/00 | 56 | 50 | |
| NGC 1291 | S0/a | 0.1 | 9.8 | 2.1 | 2059 | 07/11/00 | 23 | 30 | |
| NGC 2681 | S0/a | 0.4 | 3.6 | 2.4 | 2060 | 30/01/01 | 77 | 42 | |
| NGC 253 | Sc | 5.1 | 28 | 1.4 | 969 | 16/12/99 | 14 | 7.5 | |
| NGC 3184 | Scd | 5.9 | 7.4 | 1.1 | 804 | 08/01/00 | 41 | 17 | |
| NGC 4631 | Sd | 6.5 | 15 | 1.3 | 797 | 16/04/00 | 59 | 8.5 | |
| IC 5332 | Sd | 6.8 | 7.8 | 1.4 | 2066 | 02/05/01 | 52 | 9.7 | |
| IC 2574 | Sm | 8.9 | 13 | 2.4 | 792 | 07/01/00 | 8.6 | 8.8 | |
| NGC 1569 | Im | 9.6 | 3.6 | 2.2 | 782 | 11/04/00 | 92 | 4.1 | |
| IZW 18 | … | … | … | 0.30 | 1.9 | 805 | 08/02/00 | 31 | 31 |
The discovery of ULX naturally led to the proposal that these may be a single type of object. Explanations of this type have involved firstly, an intermediate mass black hole binary. Makishima et al. (2000) required black hole masses of between 3 and 80 M for the Eddington limit not to be exceeded. In general, intermediate mass black hole models involve masses of - M, i.e. more massive than Galactic BHB such as Cyg X-1, and substantially less massive than AGN. This possibility has been invoked to explain the most luminous, variable ULX in M82 (Kaaret et al. 2001). However, King et al. (2001) discussed the difficulties of forming these, and proposed an alternative model involving mild beaming and a link with Galactic micro-quasars. It has been known that ULX occur preferentially in regions of star formation (Zezas et al. 1999; Roberts & Warwick 2000; Fabbiano et al. 2001), and the model is consistent with the expected association of high mass X-ray binaries (HMXB) with young stellar populations. The numbers of ULX found in the Antennae galaxies (Fabbiano et al. 2001) supports the connection with recent massive star formation. ULX were also detected in elliptical galaxies which do not contain HMXB, e.g. Sarazin et al. (2001), which led King (2002) to extend the model by proposing two types of ULX: persistent sources predominating in galaxies with young stellar populations, and micro-quasars with bright, prolonged outbursts occurring in elliptical galaxies.
However, there is also the possibility that ULX do not consist of a single or even two types of object. Objects generating X-ray luminosities larger than the Eddington limit for a neutron star include not only stellar mass black holes (M 100 M) but very young supernova remnants (Roberts & Warwick, 2000; King et al., 2001). Some pre-Chandra ULX may have been unresolved “super-bubbles” of shock-heated HII in the ISM (e.g. Stewart & Walter 2000), typically with diameters 200–1000 pc. With the 0.3 arcsec (on-axis) resolution of Chandra (van Speybroeck et al. 1997; van Speybroeck 1999) these objects would appear extended in nearby galaxies, for example, 0.3 arcsec corresponds to a size of 27-40 pc at the distance of the Antennae galaxies (20-30 Mpc) (Fabbiano et al. 2001). Young, compact supernova remnants, which can reach luminosities of a few erg s-1 (Immler & Lewin 2002) would not be resolved even with Chandra, except in the nearest members of the Local Group. Similarly an unresolved cluster of sub-Eddington low mass or high mass XRB may appear ultra-luminous. This could be in a globular cluster such as the two sources in the Galactic globular cluster M15, White & Angelini 2001). Since the diameter of a globular cluster is typically 10 pc, these objects also cannot be resolved, even with Chandra. Large amplitude variability would be a strong pointer that the source consists of a single object or a group of a small number of objects only (Roberts & Warwick, 2000).
In this paper, we examine systematically Chandra ACIS observations of 13 normal galaxies to detect all super-Eddington sources and so determine whether the prevalence of ULX depends upon galaxy morphology. One aim of the work was to examine the spectra of the brighter sources and search for any spectral property that may reveal the nature of a ULX source.
2 The Galaxy Sample
Thirteen galaxies were selected from the available Chandra observations in the public archive in the summer of 2001, that were classified by the Chandra X-ray Centre (CXC) as Normal Galaxies. These galaxies were selected on the basis that the observations were longer than 10 ksec, and covered a range of types. While this is not a statistically complete sample, the seven spiral, four elliptical and two irregular galaxies allow us to investigate whether there is any correlation of ULX occurrence with morphology. The galaxies chosen are listed in in morphological order from E to Irr in Table 1, with details of the observations. Morphological types and face-on, absorption-corrected -band magnitude, are taken from the Third Reference Catalogue of Bright Galaxies (RC3; de Vaucouleurs et al. 1991). The morphological parameter , where -5 is Elliptical, 0 is S0a and 10 is Irregular, is taken from the Lyon-Meudon Extragalactic Database LEDA (Paturel et al. 1997), based on RC3.
Chandra point-source detections have already been reported for NGC 1399 (Angelini, Loewenstein & Mushotzky 2001), NGC 4697 (Sarazin, Irwin & Bregman 2000, 2001) and the central region of NGC 1291 (Irwin, Sarazin & Bregman 2001). However, since spectral studies of individual objects were not in general made, these sources were included here.
| Galaxy | distance | technique | reference | |
|---|---|---|---|---|
| NGC 4636 | SBF | 1 | ||
| NGC 1132 | - | 2 | ||
| NGC 4697 | SBF | 1 | ||
| NGC 1399 | SBF | 1 | ||
| NGC 1291 | - | 3 | ||
| NGC 2681 | SBF | 1 | ||
| NGC 253 | Cepheid | 4 | ||
| NGC 3184 | T-F | 4 | ||
| NGC 4631 | T-F | 4 | ||
| IC 5332 | T-F | 5 | ||
| IC 2574 | Cepheid | 4 | ||
| NGC 1569 | BS | 4 | ||
| IZW 18 | 2 | 6 |
The techniques shown are: SBF: I-band surface brightness fluctuation; -: isophotal diameter velocity dispersion; T-F: Tully-Fisher; BS: brightest stars in galaxies; : redshift distances with Virgocentric correction.
References: (1) Tonry et al. 2001; (2) Djorgovski & Davis 1987; (3) Prugniel & Simien 1996; (4) Shapley et al. 2001; (5) Bottinelli 1985; (6) Östlin 2000;
Based on a literature search, we obtained preferred distances for the 13 galaxies as shown in Table 2. In the case of 5 galaxies, we use the distances given by Shapley, Fabbiano & Eskridge (2001). For the other galaxies, we adopt, in order of preference the values obtained from Cepheid variables; from -band surface-brightness fluctuations; from the Tully-Fisher relation; or from the isophotal diameter - velocity dispersion (–) relation. Otherwise, we adopt estimates based on the brightest star in the galaxy, or use the redshift corrected for Virgocentric flow from LEDA. Distance errors are also shown, reflecting the uncertainty in the most reliable technique available for any galaxy. Where possible, systematic and statistical errors are combined. If no errors were quoted in the literature we adopt, if possible, typical values for the given distance method as listed in Jacoby et al. (1992). For the redshift-distances we adopt errors determined by Shapley et al. (2001) of 30% (20% in the case of NGC 1132).
3 X-ray Source Detection
Data analysis was performed using the ciao 2.1.2 software, xanadu and ftools 5.0. To remove periods of high background, lightcurves were accumulated from source-free regions of the active chips and intervals having factor of two increases in count rate removed. This led to significant data loss only for IZW 18 and NGC 1291, in which 25% and 35% of data were removed, respectively. Net exposure times are shown in Table 1.
Searches for point sources were made using the ciao wavdetect algorithm, without regard to whether detections were at the centres of galaxies or not. However, as discussed below, only a few detections coincided with galaxy centres. The spurious source detection probability was set at per pixel, corresponding to 0.014 spurious detections per square arcmin. Exposure maps created with mkexpmap at 1.7 keV were used with wavdetect to minimize spurious detections at the detector chip boundaries and these aspects were checked by manual inspection of the images. In two galaxies, IC 5332 and NGC 1569, no sources were detected exceeding erg s-1. Detections spanning 2, 4, 8 or 16 pixels were flagged, as these imply extended sources. Radial profiles (Sect. 3.1) confirmed possible extended sources as those significantly broader than the PSF. For a typical off-axis PSF of 1 arcsec width, a typical distance of 10 Mpc implies a size of 50 pc, so that to appear point-like in Chandra a source must have a size no larger than this. Only 10 sources eventually proved to have an extended component.
We selected the point sources lying within the -band 25th magnitude isophotes derived from RC3, which are thus likely to be associated with the galaxy. For these, spectra, lightcurves and instrument response functions were generated. Background data were extracted from annuli centred upon the source region and lying entirely within the same CCD node. The annuli were chosen to cover an area at least 8 times larger than the source extraction region and containing at least 20 photons (although such regions frequently exceeded this limit). To prevent contamination of the background spectra by photons from bright point sources, all photons detected within a region six times larger than the 1- encircled-energy ellipse of every source, and centred on that source were removed prior to background accumulation. Such a large masking region was adopted since with a 3- region, a few per cent of a source’s intensity will remain.
The total count from a given detection varied between 100 and 1000 (Table 4). Thus to plot light curves in the normal way to achieve Poisson errors of 10%, say, would allow a very small number of bins, and searching for variability by testing would not be sensible in most cases. We thus applied a Kolmogorov-Smirnov test to the arrival times of photons and the numbers of photons that arrive by a particular time are compared with those expected for constant intensity. This test strictly requires unbinned data, and so we used the primitive binning of the ACIS data of 3.24 s, although binning does not bias the test provided there are many primitive bins. This revealed only one source in galaxy NGC 253 which displayed variability at the 99% significance level, this source having a luminosity of erg s-1, located at = 00h 47m 30.s9, = -25∘ 18′ 26′′(2000). Other sources exhibited no evidence for variability, however the Kolmogorov-Smirnov test does not provide upper limits for non-detections. We carried out simple testing which indicated that other sources were not variable at a confidence of at least 90%. We adopt the procedure (below) of considering only sources brighter than erg s-1, so that no bright sources detected (shown in Tables 3 – 5) displayed significant variability. Thus, none of the sources in the sample examined provided evidence in this way that the object was not a superposition of sources.
Radial brightness profiles were derived for each point source detected, which allowed extended sources to be clearly identified by comparing the profiles with the PSF derived for each position (see Sect. 3.1). Ten sources found using wavdetect were rejected as being clearly extended, and 2 more sources found to have point source and extended components are discussed in Sect. 3.1.
Spectral fitting (Sect. 3.3) provided best-fit models from which fluxes were derived. Then, using the preferred distances of Table 2, luminosities were calculated in the band 0.3–7.0 keV. In the case of the weaker sources, which do not permit sensible fitting to discriminate between models, an absorbed power law was fitted with a fixed power law photon index of 2.0 (typical of fit results in other cases) and column density fixed at the line-of-sight Galactic value (Dickey & Lockman 1990; see Table 1). After removal of extended sources, in this band, 258 sources were found with erg s-1 (), of which 158 () had erg s-1 (), 61 () had ergs-1 (), and 22 () had erg s-1 ().
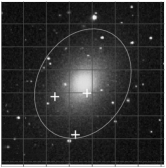
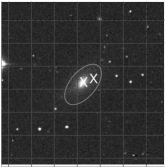
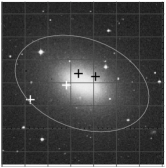
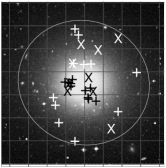
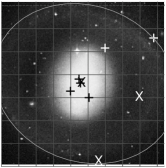
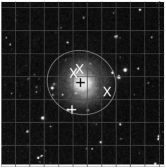
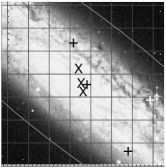
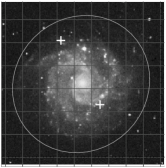
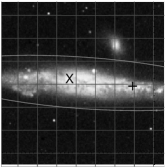
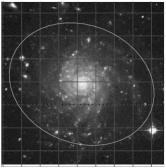
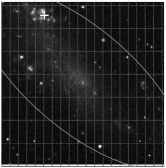
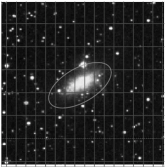
In Table 3 we show the number of sources detected in each galaxy, , and . varied from 2 in NGC 1132 to 72 in NGC 1399. The numbers detected have error values calculated using the errors in luminosity from spectral fitting combined with the distance uncertainties. In Fig. 1, Digital Sky Survey images of each galaxy are shown with 25th magnitude () B-band isophotes from RC3 superimposed. All sources with luminosity are shown, together with sources lying between and .
To estimate how many background objects may have been detected as ULX, the Log N(S) - Log S relations in the Chandra Deep Field South (Giacconi et al. 2001) in the energy bands 0.3–2.0 keV and 2.0–7.0 keV were used to obtain the expected number of background objects within each galaxy (i.e. within the 25th magnitude isophote). Data in these bands were combined into a single plot for the total band, approximately, by using the spectral form of Giacconi et al. (2001) to relate the total flux in the 0.3–7.0 keV band to the fluxes in the sub-bands. It was assumed that soft sources were also detected in the hard band, and so the correction was made using values from the hard band and correcting values to the flux in the total band. The number of background objects detected within each galaxy is shown in Table 3. For the 13 galaxies, 17 spurious sources are expected with apparent luminosities erg s-1, and 8 with erg s-1. Hence 627% of the ULX sources are true members of their host galaxies (Table 3). To estimate the errors of the numbers of sources in each luminosity-band, the errors in distance and flux must be combined, bearing in mind that the distance errors do not affect each source independently. A simple Monte-Carlo method was adopted with 10000 simulations for each galaxy. Each simulation consisted first of taking a random distance to the galaxy, normally distributed about the measured value, with a standard deviation equal to the 1- distance uncertainties in Table 2. From this distance, appropriate flux limits for each luminosity-band were computed. A similar procedure was adopted taking a random flux for each detection distributed about its measured value, and the number of sources exceeding each flux limit were counted. We adopted the standard deviation of these numbers, accumulated over all the simulations, as the error estimate.
We show the ULX detected in Fig. 1 (as diagonal crosses) in each galaxy, and other super-Eddington sources ( ) are shown separately. In Table 4 (upper panel), individual ULX in each galaxy are listed, and given a source name such as NGC 4636 PSX-1, the “P” indicating pointlike nature. For each source, the total number of counts (‘count’) contained in the spectrum (discussed in Sect. 3.3), the source count-rate, the luminosity (Lx) in the band 0.3–7.0 keV derived from spectral fitting using the best distance value, with 90% confidence errors, the offset () of the source from the nominal galaxy centre. Source names following the -naming convention are given. In the upper panel we include sources
| Galaxy | Dist (Mpc) | ||||||||
| NGC 4636 | 0 | 0.074 | |||||||
| NGC 1132 | 1 | 0.2 | |||||||
| NGC 4697 | 0 | 0.06 | |||||||
| NGC 1399 | 0 | 0.23 | |||||||
| NGC 1291 | 1 | 0.15 | |||||||
| NGC 2681 | 0 | 0.04 | |||||||
| NGC 253 | 0 | 0.22 | |||||||
| NGC 3184 | 0 | 0.03 | |||||||
| NGC 4631 | 0 | ||||||||
| IC 5332 | 0 | ||||||||
| IC 2574 | 0 | 0.011 | |||||||
| NGC 1569 | 0 | ||||||||
| IZW 18 | 0 | ||||||||
| Total | … | 40.9 | 16.6 | 8.40 | 2 | 1.0 |
marked “-” which would fall below at their lower limit. The lower panel shows sources exceeding which would join the ULX detections if given their upper error limit luminosity (marked “+”). Table 5 similarly lists the extended sources detected.
Next, we estimate the completeness of our source samples, for each galaxy, i.e. the probability that a source of given luminosity will be detected by the detection algorithm. This requires firstly the estimated number of counts of the source in the image, this requiring a flux to counts conversion factor. We chose a conservatively low factor, i.e. an estimate erring on the low side of the counts obtained, by adopting a simple absorbed power law model having a photon index fixed at 1.0, i.e. a smaller value than typical of spectral fitting results. The column density was fixed at the average value measured in the sources detected. Averaging the threshold of the “correlation parameter” used by wavdetect to identify sources in the vicinity of each of our detections and assuming a Gaussian distribution of the correlation parameter (Freeman et al. 2002), we can estimate the fraction of the complete number of sources above each limit that will be detected by the algorithm. This is 97% for sources (except in NGC 1132), and % for sources (except for NGC 1132, NGC 1399, NGC 1291 and IZW 18). In these objects, the number detected represents a lower limit.
As the Eddington limit for a 1.4 M neutron star is between erg s-1, depending on composition, opacity and gravitational redshift (Paczyński 1983), luminosities smaller than do not exceed the Eddington limit substantially, and may be neutron star binaries. Only a very small number of Galactic neutron star binaries ( 1%) are known to ever exceed the Eddington limit: the bright LMXB GX 5-1 has been observed with erg s-1 (Church & Bałucinska-Church 2001; Christian & Swank 1997). In Sco X-1, the total luminosity often exceeds . In Table 3 we show the detections of objects brighter than various thresholds. However, in the rest of the paper we concentrate on the ULX ( ), and do not consider at all objects fainter than thus excluding most neutron star binaries. The number of ULX detected is 22, and these exceed the Eddington limit for a 10 M black hole. There are 39 other sources in the luminosity range erg s-1 which may be expected to consist mostly of Black Hole Binaries (BHB).
| Source | name | count | rate | |||
|---|---|---|---|---|---|---|
| 10-3 c s-1 | erg s-1 | ′′ | ||||
| ULX | ||||||
| NGC 1132 | ||||||
| PSX-1 | CXOU J025251.4-011631 | |||||
| PSX-2 | CXOU J025249.4-011620 | |||||
| NGC 1399 | ||||||
| PSX-1 | CXOU J033832.6-352705 | 13.0 | ||||
| PSX-2 | CXOU J033831.8-352604 | 10.0 | ||||
| PSX-3 | CXOU J033820.1-352446 | |||||
| PSX-4 | CXOU J033827.6-352648 | |||||
| PSX-5 | CXOU J033821.9-352928 | |||||
| PSX-6 | CXOU J033829.7-352504 | |||||
| PSX-7 | CXOU J033825.2-352522 | |||||
| PSX-8 | CXOU J033832.3-352710 | – | ||||
| PSX-9 | CXOU J033833.1-352731 | – | ||||
| NGC 1291 | ||||||
| PSX-1 | CXOU J031718.6-410629 | 17.0 | ||||
| PSX-2 | CXOU J031702.5-410714 | 16.0 | ||||
| PSX-3 | CXOU J031713.8-411035 | 13.0 | ||||
| NGC 2681 | ||||||
| PSX-1 | CXOU J085335.7+511917 | |||||
| PSX-2 | CXOU J085324.4+511819 | |||||
| PSX-3 | CXOU J085333.7+511930 | |||||
| NGC 253 | ||||||
| PSX-1 | CXOU J004734.0-251637 | 46.0 | ||||
| PSX-2 | CXOU J004733.0-251749 | 79.0 | ||||
| PSX-3 | CXOU J004733.4-251722 | 58.0 | – | |||
| NGC 4631 | ||||||
| PSX-1 | CXOU J124211.1+323236 | 19.0 | ||||
| IZW 18 | ||||||
| PSX-1 | CXOU J093402.0+551428 | 13.0 | ||||
| Possible ULX detections | ||||||
| NGC 4636 | ||||||
| PSX-1 | CXOU J124249.1+024046 | + | ||||
| PSX-3 | CXOU J124255.8+024035 | + | ||||
| NGC 1399 | ||||||
| PSX-10 | CXOU J033828.6-352724 | + | ||||
| PSX-11 | CXOU J033826.5-352732 | + | ||||
| PSX-12 | CXOU J033832.8-352658 | + | ||||
| PSX-13 | CXOU J033827.9-352747 | + | ||||
| PSX-14 | CXOU J033832.3-352702 | + | ||||
| PSX-15 | CXOU J033815.4-352628 | + | ||||
| PSX-17 | CXOU J033833.8-352658 | + | ||||
| PSX-18 | CXOU J033827.8-352750 | + | ||||
| PSX-22 | CXOU J033830.4-352430 | + | ||||
| NGC 1291 | ||||||
| PSX-4 | CXOU J031712.1-410438 | + | ||||
| NGC 2681 | ||||||
| PSX-4 | CXOU J085336.4+511727 | + | ||||
| Source | name | count | rate | |||
|---|---|---|---|---|---|---|
| 10-3 c s-1 | erg s-1 | ′′ | ||||
| Other super-Eddington detections | ||||||
| NGC 4636 | ||||||
| PSX-2 | CXOU J124251.4+023835 | |||||
| NGC 4697 | ||||||
| PSX-1 | CXOU J124846.8-054854 | |||||
| PSX-2 | CXOU J124833.2-054742 | |||||
| PSX-3 | CXOU J124836.7-054732 | |||||
| PSX-4 | CXOU J124839.3-054808 | |||||
| NGC 1399 | ||||||
| PSX-16 | CXOU J033831.9-352649 | |||||
| PSX-19 | CXOU J033831.3-352411 | |||||
| PSX-20 | CXOU J033828.9-352602 | |||||
| PSX-21 | CXOU J033836.8-352747 | |||||
| PSX-23 | CXOU J033836.3-352809 | |||||
| PSX-24 | CXOU J033827.2-352601 | |||||
| PSX-25 | CXOU J033831.6-352600 | |||||
| PSX-26 | CXOU J033816.5-352745 | |||||
| NGC 1291 | ||||||
| PSX-5 | CXOU J031658.7-410406 | |||||
| PSX-6 | CXOU J031718.9-410628 | |||||
| PSX-7 | CXOU J031721.7-410653 | |||||
| PSX-8 | CXOU J031719.3-410615 | |||||
| NGC 2681 | ||||||
| PSX-5 | CXOU J085333.5+511852 | |||||
| NGC 253 | ||||||
| PSX-4 | CXOU J004717.6-251811 | 55.0 | ||||
| PSX-5 | CXOU J004722.6-252051 | 63.0 | ||||
| PSX-6 | CXOU J004732.1-251721 | 10.0 | ||||
| PSX-7 | CXOU J004735.3-251512 | 35.0 | ||||
| NGC 3184 | ||||||
| PSX-1 | CXOU J101823.0+412742 | 11.0 | ||||
| PSX-2 | CXOU J101812.0+412421 | 10.0 | ||||
| NGC 4631 | ||||||
| PSX-2 | CXOU J124155.6+323217 | 54.0 | ||||
| IC 2574 | ||||||
| PSX-1 | CXOU J102843.1+682816 | 51.0 | ||||
| Galaxy | source | count | rate | |||||
|---|---|---|---|---|---|---|---|---|
| h m s | 10-3 c s-1 | erg s-1 | ′′ | |||||
| NGC 4636 | ||||||||
| ESX-1 | 12 42 50.2 | 2 41 15 | 12.0 | |||||
| ESX-2 | 12 42 49.8 | 2 41 15 | 17.0 | |||||
| ESX-3 | 12 42 49.7 | 2 41 11 | 21.0 | |||||
| ESX-4 | 12 42 50.2 | 2 41 10 | ||||||
| NGC 1132 | ||||||||
| ESX-1 | 2 52 51.8 | -1 16 28 | ||||||
| NGC 4697 | ||||||||
| ESX-1 | 12 48 35.9 | -5 48 3 | ||||||
| NGC 1399 | ||||||||
| ESX-1 | 3 38 29.0 | -35 27 1 | 200.0 | |||||
| NGC 2681 | ||||||||
| ESX-1 | 8 53 32.7 | 51 18 49 | 12.0 | |||||
| NGC 253 | ||||||||
| ESX-1 | 0 47 33.3 | -25 17 17 | 29.0 | |||||
| ESX-2 | 0 47 33.0 | -25 17 20 | 43.0 |
3.1 Radial intensity profiles


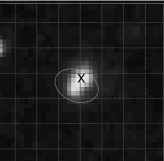
The excellent spatial resolution of Chandra (Weisskopf et al. 2002) makes it possible to test for spatial extension of the ULX. Accordingly, radial intensity profiles for each detected bright source were extracted, to search for excesses above the point-spread function. Since the PSF width depends on the off-axis angle and the source spectrum, PSFs were generated for each source based on the mean detected photon energy using the ciao tool mkpsf. Source data were extracted in 18 logarithmically-spaced radial bins in the total band 0.3–7.0 keV and rebinned to ensure a minimum of 20 counts per bin, and compared with the PSF. This was done using dedicated software in which it was tested whether a point source model fits the data well. It was also possible to fit extended source models such as a simple King model. The background was assumed to be constant over the radial distance in the radial profiles, and all point sources detected in the neighbourhood of the source being modelled were excluded from the background data. In the majority of sources, there was no evidence of extended nature. The extended sources are not included in Table 4, or in discussion of ULX, but are shown separately in Table 5.
In the case of the detection NGC 253 PSX-3, the radial profile shown in Fig. 2 (left panel) consists of clear extended emission many times wider than the PSF, together with excess intensity at the centre with a width comparable to the PSF, suggesting a point-source, and so this source in included in Table 4. In NGC 253 and NGC 4636, there are known to be regions of substantial, diffuse galaxy emission exhibiting complicated structure (Strickland et al. 2000; Jones et al. 2002), so that it is difficult to test if sources close to the centres are real or concentrations of structured emission. Similarly, where this extended emission has an erratic radial profile that is not easily fitted, it is difficult to determine whether sources superimposed upon it are broader than the PSF or genuine point-sources. In such ambiguous cases the objects are included in Table 5 and assumed to be extended.
In five galaxies, detections were made within a few arcseconds of the galaxy centres where there may be diffuse emission, so that the sources may not be point-like. The radial profiles of four of these sources (NGC 1132 ESX-1, NGC 1399 ESX-1, NGC 2681 ESX-1 and NGC 4697 ESX-1) could be fitted by King models, and so the sources are shown in Table 5 of extended sources, also containing extended sources offset from the centres as revealed by their radial profiles. The fitting results allowed the extended emission to be subtracted in fitting the radial profiles of other sources in these five galaxies, and when this was done, no other source within these galaxies proved to be extended. In the case of NGC 1291, a point-source PSX-1 was detected at the galaxy centre, superimposed on extended emission (see Fig. 2, right panel); this is discussed in Sect. 5.3.
3.2 Hardness ratios
As a simple method of comparing the sources, hardness ratios were obtained for all sources in Table 4 based on three energy bands: a soft band (S): 0.3–1.5 keV, a medium band (M): 1.5–3.0 keV and a hard band (H): 3.0–5.0 keV. Hardness ratios were defined as HR1 = (S-M)/(S+M) and HR2 = (M-H)/(M+H). The HR1 ratio is more sensitive to changes in column density, while the HR2 ratio is more sensitive to the power law index. With this definition, a harder source implies a more negative value of HR2. A colour-colour diagram (HR2 versus HR1) is shown for the detected sources in each galaxy in Fig. 3, plotting each source as a point with error bars derived from the Poisson errors of the intensities in each energy band.

To investigate quantitatively the sensitivity of the ratios of these bands to spectral changes, ACIS data were simulated for a simple absorbed power law spectral model for a range of column densities and power law indices . Count rates in each of the energy bands were calculated and points on the (S/M, M/H) colour-colour diagram found, so giving a / grid (c.f. Kim et al. 1992). This grid is superimposed on the colour-colour diagram for the sources found in each galaxy in Fig. 3. (The scale is vertical, the scale horizontal, with increasing values to the top and left.)
Although the spectra of LMXB, HMXB or BHB cannot generally be described by this simple one-component model, an absorbed power law model can be fitted to X-ray binary spectra as a method for gauging the steepness of the decrease to high energies, even if the quality of fit may be poor. For example, Cyg X-1 (a BHB) in the High State has a very soft spectrum because of the strong disc blackbody component (Dotani et al. 1997). Although the power law index of the Comptonized emission varies from 1.7 to 2.0 as the source moves from the Low State to the High state, fitting the one-component model to High State data will yield an apparent of 3.5, compared with 1.9 in the Low State. We have carried out simulations based on previous analysis of Galactic Black Hole binaries and Low Mass X-ray Binaries, and results are shown in Fig. 4. The simulation based on the Cyg X-1. High State data of Bałucińska-Church et al. (1998) confirms a location on the colour-colour diagram at a grid value with = 3.5, so that sources located at similar positions in Fig. 3 may be Black Hole Binaries in the High State. Power law indices between 2.5–3.5 may indicate black hole nature; however given the errors of points in Fig. 3, it would be unsafe to associate black hole nature except with values 3.0. There were five such objects, including two ULX: NGC 1399 PSX-1 and PSX-2, plus NGC 1399 PSX-15 (luminosity marginally below erg s-1), and PSX-16 and PSX-26, having . Note that large values of may also result from soft thermal spectra, for example those of SNR or supersoft sources.
Colour-colour diagrams however cannot distinguish a BHB in the Low State from a LMXB, although most LMXB should have been excluded from the sample defined with erg s-1. Moreover, it would not be possible to distinguish different classes of LMXB; for example, the flaring branch in Z-track sources is distinguished from the normal branch by flaring taking place above 7 keV (Bałucińska-Church et al. 2001), but tests show that this behaviour would not cause any movement in the present colour-colour diagram. However, the diagram does allow comparisons between galaxies, and with galaxy morphology. It should be noted that fitting the absorbed power law model to ACIS data was adequate in only half of the sources shown in Table 6 for which spectral fitting was carried out.
Differences in hardness ratio between galaxies can be seen. In the early-type galaxies, the column densities are low: cm-2, as expected since early type galaxies generally have a hot ISM. Higher column-densities are seen however, in NGC 4636 PSX-3 and NGC 2681 PSX-1, PSX-2 and PSX-4, sources that are not near the nucleus. Examination of the spectra of these sources reveals evidence of heavy absorption in each case. This may be intrinsic, for example if the sources are strongly-absorbed background AGN. We note that the expected numbers of background objects (Sect. 3) is consistent with the numbers of heavily-absorbed sources we detect in elliptical galaxies. Alternatively, they may be intrinsically-absorbed objects within the host galaxy. In the nearly edge-on spiral galaxy NGC 253 we see evidence of a spread of column-densities consistent with the presence of cold ISM in spirals, reaching a few cm-2. Spectral fitting results (Table 6) confirm high values of column density in the sources in Fig. 3 with large .
3.3 Spectral analysis
We restrict spectral fitting to sources with erg s-1 and for a total number of counts in the spectrum of 200, which is a minimum for useful spectral fitting. This left a sample of 22 sources consisting of 14 ULX plus 8 other super-Eddington sources (). Spectral fitting results are shown in Table 6 for the ULX (upper panel), and other sources (lower panel).
Spectra were extracted from the elliptical regions provided by the detection algorithm and background data extracted from annuli centred on each source from events files from which all point sources had been excluded. Data below 0.3 keV, where the calibration becomes uncertain, and above 7.0 keV, where the particle background exceeds the source count rate, were ignored. Spectra were grouped to a minimum of 20 counts per bin to allow use of the statistic. However, the full energy range could not be used in many cases because of insufficient counts. Although dependent on the slope of the spectrum, to have usable data above 5 keV, more than 500 counts are needed. Non-standard spectral models were written for use within xspec in which the intensity or normalization of the model equals the unabsorbed energy flux in the 0.3–7.0 keV band thus allowing flux errors to be obtained directly as the error of a single parameter. Simple absorbed power law (P), multi-colour disc blackbody (D) and Mekal (M) models were tested against the data, as were two-component combinations of these. The Mekal model would be appropriate to optically thin emission with lines from hot plasma, appropriate for some SNR. In no cases was a cut-off power law representation of Comptonization fitted given that the spectra did not extend beyond 7 keV and use of this model is likely to result in curvature at 5 keV actually due to thermal emission being incorrectly interpreted as a high energy cut-off. In Table 5, results shown in boldface indicate that the model highlighted produced an appreciable decrease in compared with other models.

Of the 14 ULX in Table 6, 5 could be fitted by a simple absorbed power law, although in none of these cases was the power law photon index large enough ( 3.0) to be taken as evidence for black hole nature (Sect. 3.2). In one source (NGC 1399 source PSX-3) a Mekal model was preferred marginally, offering some evidence for SNR nature. In two sources (NGC 253 PSX-1 and NGC 4631 PSX-1) an absorbed blackbody model was preferred although it was not possible to discriminate between disc blackbody and simple blackbody. These may indicate a black hole in a high state.
The other 7 sources required two-component models, 5 being fitted by a blackbody plus power law which would suggest neutron star binary or black hole binary nature. However, it was not possible to discriminate between the simple blackbody and disc blackbody spectral forms and so discriminate between a neutron star binary and a black hole binary. IZW 18 PSX-1 was best fitted by a Mekal plus power law, suggesting possible SNR nature, as was NGC 1291 PSX-1, although in this case it was necessary for the power law to have extra absorption.
Comparison was next made of spectral fitting and hardness ratio results for ULX. Two ULX were identified from the harness ratio diagrams with a spectral shape which when fitted by an absorbed power law model, would give 3.0. These were NGC 1399 PSX-1 and PSX-2. Spectral fitting results for the second of these had an actual power law photon index of 2.5-3.5 as part of a two-component model, adding some support to the idea that it is a High State BHB.
Of the 8 other (non-ULX) sources shown in the lower panel of Table 6, exceeding the Eddington limit for a neutron star, 4 can be fitted by an absorbed power law model, although none of these had a photon index 3.0 suggesting black hole nature. The other 4 were fitted by two-component blackbody plus power law models consistent with neutron star binary or black hole binary nature. In one of these, NGC 253 PSX-7, there was evidence for a steep power law index ( 3.0) strongly suggestive of black hole binary nature. The luminosity of this source is erg s-1. Very few Galactic neutron star binaries have been observed with such luminosities, and as the luminosity is substantially less than the Eddington limit of a 10 M black hole, the object is likely to be a black hole binary similar in the high state. Fig. 5 illustrates higher quality data, showing the best fits to two sources. NGC 1399 PSX-1 (left panel) is fitted by an absorbed power law model, whereas the second source,
| Obj. | model | /dof | (keV) | Obj. | model | /dof | (keV) | ||||
| ULX ( ) | |||||||||||
| NGC 1399 | … | … | … | … | … | … | B+P | /8 | |||
| PSX-1 | P | … | … | D+P | /8 | ||||||
| … | D | /27 | … | … | M+P | /8 | |||||
| … | M | /27 | … | NGC 2681 | … | … | … | … | … | ||
| PSX-2 | P | /19 | … | PSX-3 | P | … | |||||
| … | B+P | … | D | /15 | … | ||||||
| … | D+P | … | M | /15 | … | ||||||
| … | M+P | NGC 253 | … | … | … | … | … | ||||
| PSX-3 | P | /12 | … | PSX-1 | P | /26 | … | ||||
| … | D | /12 | … | … | D | … | |||||
| … | M | … | … | M | /26 | … | |||||
| PSX-4 | P | /20 | … | PSX-2 | P | /43 | … | ||||
| … | B+P | /18 | … | B+P | /41 | ||||||
| … | D+P | /18 | … | D+P | /41 | ||||||
| … | M+P | /18 | … | M+P | /41 | ||||||
| PSX-7 | P | … | PSX-3 | P | 15/20 | … | |||||
| … | D | /12 | … | … | D | 16/20 | … | ||||
| … | M | /12 | … | … | M | 15/20 | … | ||||
| NGC 1291 | … | … | … | … | … | NGC 4631 | … | … | … | … | … |
| PSX-1 | P | /15 | … | PSX-1 | P | /49 | … | ||||
| … | B+P | /13 | … | D | … | ||||||
| … | M+P | /13 | … | M | /49 | … | |||||
| … | M+AP | 14/12 | IZW 18 | … | … | … | … | … | |||
| PSX-2 | P | … | PSX-1 | P | /15 | … | |||||
| … | D | /12 | … | … | B+P | /13 | |||||
| … | M | /12 | … | … | D+P | /13 | |||||
| PSX-3 | P | /10 | … | … | M+P | ||||||
| Super-Eddington sources ( ) | |||||||||||
| NGC 4697 | … | … | … | … | … | … | B+P | /17 | |||
| PSX-1 | P | /11 | … | … | D+P | /17 | |||||
| … | B+P | … | M+P | /17 | |||||||
| … | M+P | PSX-2 | P | /16 | … | ||||||
| NGC 253 | … | … | … | … | … | … | D | /16 | … | ||
| PSX-4 | P | /31 | … | … | M | /16 | … | ||||
| … | B+P | /29 | … | B+P | /14 | ||||||
| … | D+P | /29 | … | D+P | /14 | ||||||
| … | M+P | /29 | NGC 4631 | … | … | … | … | … | |||
| PSX-5 | P | … | PSX-2 | P | … | ||||||
| … | D | /35 | … | … | D | /115 | … | ||||
| … | M | /35 | … | … | M | /115 | … | ||||
| PSX-7 | P | /20 | … | IC 2574 | … | … | … | … | … | ||
| … | B+P | PSX-1 | P | /17 | … | ||||||
| … | D+P | … | D | /17 | … | ||||||
| NGC 3184 | … | … | … | … | … | … | M | /17 | … | ||
| PSX-1 | P | /19 | … | ||||||||
NGC 253 PSX-4 is well-fitted by a two-component model consisting of either a simple blackbody or a disc blackbody plus a power law.
4 Search for correlation of ULX numbers with stellar mass and star-forming mass
We have investigated whether correlations exist between the numbers of ULX () and the numbers of super-Eddington sources () with the stellar masses of the galaxies, and with the mass of star-forming regions in the galaxies. We used for the first test the near-infrared H-band fluxes accepted as a good measure of stellar mass, and for the second test, we used the 60 m fluxes. In both cases, data were obtained from the NASA Extragalactic Database (NED) which also provided angular diameters for the galaxies in the form and each given in arcminutes. For each galaxy, we used the total H-band flux in Janskys from the photometric measurements listed in the database. We adopted the procedure of taking as a measure of the surface brightness of the H-band luminosity of each galaxy. The number counts and were converted to counts per unit area by dividing by the projected area of each galaxy , where is the galaxy distance. It is well-known that this procedure avoids possible biases due to varying sizes of the galaxies. H-band fluxes were available from the database for all of the galaxies in the sample, except IZW 18. Similarly, there was no 60 m flux for IZW 18 and only upper limits for NGC 1399 and NGC 1132. These upper limits were not included in Fig. 7 in which we test for correlation of number counts with 60 m flux. We use the and number counts listed in Table 3 which include 5 upper limits for and 1 upper limit for ; these upper limits are plotted in Figs. 6 and 7 but are excluded from the correlation analysis. In NGC 1569, no sources were detected.
In Fig. 6 we show the variation of and per unit area with H-band surface brightness as an indicator of the stellar mass of each galaxy. Neither of these suggests a correlation with stellar mass. The modified Kendal’s- statistic demonstrated a 88.1% probability of no correlation between and stellar mass, and a 78.8% probability of no correlation between and stellar mass. In Fig. 7 we show the corresponding plots for 60 m surface brightness. The counts reveal a strong correlation with the infrared surface brightness with a correlation coefficient of 0.71 and probability of 98.7% of correlation. In the case of the data, there are only 4 points that are not upper limits, but these also can be seen to be correlated with 60 m flux, although the formal probability of 82.6% may be regarded as insufficiently high to prove the correlation.


It is clear that the numbers of ULX and of super-Eddington sources correlate with 60 m flux suggesting a connection with star formation. Fig. 7 shows that the two elliptical galaxies plotted NGC 4636 and NGC 4697 apparently follow the same trend as the spiral galaxies, but with generally smaller number counts per unit area and the smallest infrared surface brightnesses. The amount of star formation in elliptical galaxies would be expected to be smaller than in spiral galaxies, assuming that the infrared emission arises from star formation and not from an active nucleus. A full investigation of these and other individual sources in our sample will require extensive future work; however, we note that NGC 4636 is a low-luminosity AGN with radio jets and is a LINER (Nagar et al. 2000). NGC 4697 is a very flattened galaxy which is thought may, in fact, be of S0 type (e.g. Dejonghe et al. 1996). Of the spiral galaxies in Fig. 7, NGC 2681 is a LINER in a S0 galaxy with a circumnuclear ring of star formation (González Delgado et al. 1997). The galaxy NGC 253 with substantial numbers of bright sources is a starburst galaxy (see Engelbracht et al. 1997).


5 Discussion
In a survey of 13 normal galaxies we have detected 22 ULX (with ); of these, 15 exceed by less than a factor of two while the remainder have higher luminosities, 5 of which are erg s-1. Thus the fainter objects are not inconsistent with the Eddington limit for a 10 M black hole binary, whereas the brighter objects exceed this limit by factors of 30 - 100. We have found no evidence of correlation with stellar mass but substantial evidence for a correlation with star forming mass. Fig. 7 shows that more bright sources are found in spiral galaxies consistent with the larger star forming mass in these.
5.1 Nature of the ULX
In many cases, our results from hardness ratio studies do not discriminate between types of object. Similarly, because of poor statistics, spectral fitting does not in many cases reveal the nature of the object. Consequently, we concentrate discussion on those cases where the results do help identify the type of object.
The colour-colour diagrams revealed 2 objects consistent with High State black hole binary nature: NGC 1399 PSX-1 and PSX-2. Spectral fitting results were obtained for 14 ULX. None of these required a photon index 3 suggesting black hole nature; however, two sources were well-fitted by a one-component blackbody model (NGC 253 PSX-1 and NGC 4631 PSX-1), and this suggests BHB nature. The luminosities of these two sources were and erg s-1, i.e. not exceeding the Eddington limit for a 10 M black hole. Two-component models similarly did not provide evidence for black hole nature.
The correlation between ULX and super-Eddington source numbers and 60 m flux supports previous results that such sources occur preferentially in star forming regions (Zezas et al. 1999; Roberts & Warwick 2000; Fabbiano et al. 2001). Moreover, our results also show detection of sources in elliptical galaxies, and interestingly, Fig. 7 shows that in the two elliptical galxies NGC 4636 and NGC 4697 appear to follow the same correlation as for the spiral galaxies, sugesting that star formation could be important in these two galaxies also.
5.2 Comparison with previous ULX number counts
Next, we compare the numbers of detections in the present work with previous surveys. Roberts & Warwick (2000) reported results from the Rosat HRI for a sample of 486 B-band bright northern galaxies, and detected 142 non-nuclear sources. We have used their luminosity distribution = , with normalized to a B-band luminosity of 1010 L to calculate expected numbers of bright objects in our sample. In NGC 1399 and NGC 253 ULX counts of 1.3 and 0.4 are expected, and 7 and 32 respectively, obtained. In these two galaxies, values of 2.2 and 0.7 are expected, and 21 and 6.5 obtained. It appears that there is an underestimation of both ULX and sources in the Rosat survey by a factor of 5 – 10 compared with Chandra, indicating the improved sensitivity and angular resolution of Chandra.
Grimm et al. (2003) using previous studies of High Mass X-ray Binaries in the Milky Way and Magellanic Clouds, and Chandra and ASCA observations of nearby starburst galaxies, showed a linear relation between the star formation rate (SFR) as measured by far infrared flux and HMXB collective luminosity. They proposed that the number or collective X-ray luminosity of HMXB could thus be used as a measure of star formation rate. As an example, we will compare with the galaxy in our sample having the highest 60 m surface brightness, the starburst galaxy NGC 253 (Fig. 7). We can adopt a value of , where is the dynamical mass of the galaxy of yr-1 from Grimm et al. for galaxies of similar type (Sc). Taking as M (calculated from the maximum rotation velocity from LEDA), this gives a value of 2.4 M yr-1 which combined with the linear relation (Fig. 3 of Grimm et al.) gives a count = 7. This compares well with our measured value of 9 (Table 3).
In the case of the Antennae galaxies, our results can be used to predict the expected numbers of bright objects. Using approximate fits to the data in Fig. 7 plus the 60 m flux of the Antennae galaxies, we estimate a value of of 39, and a value of of 21.7 agreeing reasonably with the 29 super-Eddington and 17 ULX actually detected (Fabbiano et al. 2001).
5.3 The most luminous sources
Two X-ray sources have luminosities exceeding 1040 erg s-1: NGC 1132 PSX-1 and NGC 1291 PSX-1. These luminosities imply a mass of at least 100 M if emitting isotropically, assuming they are Eddington limited, and it is important to consider these cases carefully.
The former source has 21 counts, so its luminosity is poorly determined, and the error-bars are sufficiently large that the source luminosity may be as small as erg s-1. This is still a very luminous object. It is situated away from the nucleus of its parent galaxy, and we expect 0.2 background sources of similar apparent brightness (Sect. 3), so we cannot exclude the possibility that it is not associated with the galaxy. NGC 1291 PSX-1 has a high count of 390, and a lower limit luminosity of erg s-1. It is a point source embedded in extended emission at the centre of its galaxy, and may be similar to low luminosity AGN-like cores in many nearby galaxies (Ho et al. 2001).
5.4 NGC 1399 and Globular Cluster X-ray Sources
NGC 1399 is the massive central galaxy in the Fornax Cluster having an extensive globular cluster system (Kissler-Patig et al. 1999). Individual globular clusters will not generally be resolved and so multiple sources within them may be confused. Indeed Angelini et al. (2001) note a higher average count rate of apparently point-like sources in globular clusters in NGC 1399, which they suggest may be explained in this manner. This may be the reason why there are so many ULX in this galaxy. Bright globular cluster X-ray sources are usually LMXB. Although there is some evidence for globular cluster sources being somewhat less bright on average than LMXB in the rest of the Galaxy, Verbunt (2002) concludes that this may be unreal. Thus if we use an average luminosity of non-cluster sources of erg s-1 (Verbunt et al. 1984), we find that the addition of 50 of these would needed to explain any ULX in this galaxy.
5.5 Limits on Non-X-ray Binary Populations
The super-Eddington sources and the ULX in our sample are point-like, within the spatial resolution of Chandra, implying sizes typically 50 pc. These limits would seem to preclude super-bubbles or super-giant shells being possible sites for the emission. Although young SNR may be compact, we would expect these to be found preferentially in regions of continuing star formation in late-type galaxies. SNR spectra may either appear as optically-thin emission with lines, or alternatively be featureless. Our spectral fitting shows Mekal models as preferred in only one or two cases, suggesting a SNR nature; we may however detect other SNR with featureless spectra which are not revealed in this way. Zezas et al. (2002) show by optical identification that a relatively small fraction of ULX in their sample are SNR, implying that our dependence on infrared flux must be mostly due to other types of object.
6 Conclusions
This survey of 13 galaxies revealed 22 ULX sources with (0.3-7.0 keV) erg s-1, and a further 39 sources with erg s1 (but less than erg s-1). Accidental coalignment of background sources is not a major effect as 62% of these ULX must truly lie within their apparent host galaxies. Several sources were found that were clearly extended beyond the instrumental PSF and are shown in Table 5. Two sources appeared on the colour-colour diagram in a position suggesting possible black hole nature.
We present spectral fitting results for 14 of the 22 ULX having a count 200, the total count varying between 200 and 3200 in the spectra fitted. Several of the sources could be fitted by an absorbed power law model suggesting non-thermal emission such as Comptonization. Seven of the sources were well-fitted by a blackbody plus power law model, also suggesting X-ray binary nature, although it was not possible to distinguish the type of XRB. Two sources were well-fitted by a one-component blackbody model suggesting High State black hole nature. However, we do not have positive evidence that any more than a relatively small fraction of the ULX are black hole binaries. Moreover, we find evidence that the numbers of ULX and super-Eddington sources are correlated with the star formation rate as indicated by the 60 m flux supporting similar results found previously, which is consistent with a link with younger stellar populations such as high mass X-ray binaries.
Acknowledgments
We thank Andreas Zezas and Marek Urbanik for helpful discussions. PJH thanks the Center for Astrophysics for support. This work has made use of the CXC archive and the NASA Astronomical Data Center archive.
References
- [] Angelini L., Loewenstein M., Mushotzky R. F., 2001, ApJ, 557, L35
- [] Bałucińska-Church M., Church M. J., 2000, MNRAS, 312, L55
- [] Bałucińska-Church M., Church M. J., Mitsuda K., Dotani T., Inoue H., Nagase F., 1998, in Koyama K., Kitamoto S., Itoh M., eds, Proc. IAU Symp. 188, The Hot Universe. Kluwer, Dordrecht, p. 390
- [] Bałucińska-Church M., Barnard R., Church M. J., Smale A. P., 2001, A&A, 378, 847
- [] Blanton E. L., Sarazin C. L., Irwin J. A., 2001, ApJ, 552, 106
- [] Blecha A., 1986, A&A, 154, 321
- [] Bottinelli L., Gouguenheim L., Paturel G., de Vaucouleurs G., 1984, A&AS, 56, 381
- [] Bottinelli L., Gouguenheim L., Paturel G., de Vaucouleurs G., 1985, A&AS, 59, 43
- [] Christian D. J., Swank J. H., 1997, ApJS, 109, 177
- [] Church M. J., 2001, Adv Space Res, 28, 323
- [] Church M. J., Bałucińska-Church M., 2001, A&A, 369, 915
- [] Colbert E. J. M., Mushotzky R. F., 1999, ApJ, 519, 89
- [] Dejonghe H., De Bruyne V., Vauterin P., Zeilinger W. W., 1996, A&A, 306, 363
- [] de Vaucouleurs G., 1975, ApJS, 29, 193
- [] de Vaucouleurs G., de Vaucouleurs A., Corwin J. R., Buta R. J., Paturel G., Fouque P., 1991, Third Reference Catalogue of Bright Galaxies, Springer-Verlag, New York
- [] Dickey J., Lockman F. J., 1990, ARA&A, 28, 215
- [] Djorgovski S., Davis M., 1987, ApJ, 313, 59
- [] Dotani T., Inoue H., Mitsuda K. et al., 1997, ApJ, 485, L87
- [] Engelbracht C. W., Rieke M. J., Rieke G. H., Kelly D. M., Achtermann J. M., 1997, ApJ, 505, 639
- [] Fabbiano G., 1989, ARA&A, 27, 87
- [] Fabbiano G., Kim D.-W., Trinchieri G., 1994, ApJ, 429, 94
- [] Fabbiano G., Zezas A., Murray S. S., 2001, ApJ, 554, 1035
- [] Faber S. M., Wegner G., Burstein D., Davies R. L., Dressler A., Lynden-Bell D., Terlevich R. J., 1989, ApJS, 69, 763
- [] Ferrarese L. et al., 2000, ApJ, 529, 745
- [] Freeman P. E., Kashyap V., Rosner R. Lamb D. Q., 2002, ApJS, 138, 185
- [] Giacconi R. et al., 2001, ApJ, 551, 624
- [] González Delgado R. M., Perez E., Tadhunter C., Vilchez J. M., Rodriguez-Espinosa J. M., 1997, ApJS, 108, 155
- [] Grimm H.-J., Gilfanov M., Sunyaev R. A., 2003, MNRAS, 339, 793
- [] Ho L. C., et al., 2001, ApJ, 549, L51
- [] Immler S., Lewin W. H. G., 2002, to appear in Weiler K. W., ed., Supernovae and Gamma-Ray bursts. Springer-Verlag, New York
- [] Irwin J. A., Sarazin C. L., Bregman J. N., 2002, ApJ, 570, 152
- [] Izotov Y. I., Papaderos P., Thuan T. X., Fricke K. J., Foltz C. B., Guseva N. G., 2000, in Weiss A., Abel T. G., Hill V., eds., Proc. MPA/ ESO Workshop, The First Stars. Springer-Verlag, New York, p. 303
- [] Jacoby G. H. et al., 1992, PASP, 104, 599
- [] Jones C., Forman W., Vikhlinin A., Markevitch, M., David L., Warmflash A., Murray S., Nulsen P. E. J., 2002, ApJ, 567, L115
- [] Kaaret P., Prestwich A. H., Zezas, A., Murray S. S., Kim D.-W., Kilgard R. E., Schlegel E. M., Ward M. J., 2001, MNRAS, 321, L29
- [] King A. R., 2002, MNRAS, 335, L13
- [] King A. R., Davies M. B., Ward M. J., Fabbiano G., Elvis M., 2001, ApJ, 552, L109
- [] Kissler-Patig M., Grillmair C. J., Meylan G., Brodie J. P., Minniti D., Goudfrooij P., 1999, AJ, 117, 1206
- [] Makishima K., et al., 2000, ApJ, 535, 632
- [] Méndez R. H., Riffeser A., Kudritzki, R.-P., Matthias M., Freeman K. C., Arnaboldi M., Capaccioli M., Gerhard O. E., 2001, ApJ, 563, 135
- [] Nagar N. M., Falcke H., Wilson A. S., Ho L. C., 2000, ApJ, 542, 186
- [] Östlin G., 2000, ApJ, 535, L99
- [] Paczyński B., 1983, ApJ, 267, 315
- [] Paturel G., Andernach H., Bottinelli L., et al., 1997, A&AS 124, 109
- [] Pierce M. J., 1994, 430, 53
- [] Prugniel P., Simien F., 1996, A&A, 309, 749
- [] Roberts T. P., Warwick R. S., 2000, MNRAS, 315, 98
- [] Roberts T. P., Goad M. R., Ward M. J., Warwick R. S., Lira P., 2002, Proc. symp. “New visions of the X-ray universe in the XMM-Newton and Chandra era”, ESTEC 2001.
- [] Sarazin C. L., Irwin J. A., Bregman J. N., 2000, ApJ, 544, L101
- [] Sarazin C. L., Irwin J. A., Bregman J. N., 2001, ApJ, 556, 533
- [] Sargent W. L. W. Searle L., 1970, ApJ, 162, L155
- [] Shapley A., Fabbiano G., & Eskridge P. B., 2001, ApJS, 137, 139
- [] Smale A. P., Church M. J., Bałucińska-Church M., 2002, ApJ, submitted
- [] Stewart S. G., Walter F., 2000, AJ, 120, 1794
- [] Strickland D. K., Heckman T. M., Weaver K. A., Dahlem M., 2000, AJ, 120, 2965
- [] Tikhonov N. A., Bilkina B. I., Karachentsev I. D., & Georgiev T. B., 1991, AAPS, 89, 1
- [] Tonry J. L., Dressler A., Blakeslee J. P., Ajhar E. A., Fletcher A. B, Luppino G. A., Metzger M. R., Moore C. B., 2001, ApJ, 546, 681
- [] van Speybroeck, L.P., 1999, BAAS, 31, 1514
- [] van Speybroeck, L. P., Diab J., Edgar R. J., Gaetz T. J., Zhao P., Reid P. D., 1997, in Hoover R. B., Walker A. B., eds., Proc. SPIE 3113, Grazing Incidence and Multilayer X-Ray Optical Systems, p. 89
- [] Verbunt F., 2002, Proc. Jan van Pardijs Memorial Symposium, 2001, ASP Conf. Series, eds. E. P. J. van den Heuvel. L. Kaper, E. Rol
- [] Verbunt F., van Paradijs J., Elson R., 1984, 84, MNRAS, 210, 899
- [] Weisskopf M. C., Brinkman B., Canizares C., Garmire G., Murray S., van Speybroeck L. P., 2002, PASP, 114, 1
- [] White N. E., Angelini L., 2001, ApJ, 561, L101
- [] Zezas A., Georgantopoulos I., Ward M. J., 1999, MNRAS, 308, 302
- [] Zezas A., Fabbiano G., Rots A. H., Murray S. S., 2002, ApJ 577, 710