Chapter 1 The GZK Feature in the Spectrum of UHECRs:
What is it Telling Us?
Abstract
We developed a numerical simulation of the propagation of UHECR in the Cosmic Microwave Background (CMB) and we used it to determine the significance of the GZK feature in the spectrum of UHECR measured by AGASA and HiRes. We find that these two experiments are best fit by two different injection spectra in the region below eV and that the error bars around the GZK feature are dominated by fluctuations which leave a determination of the GZK feature not attainable at present. In addition the comparison of the spectra of AGASA and HiRes suggests the presence of about a 30% systematic errors in the relative energy determination of the two experiments. Correcting for these systematics, the two experiments are brought in agreement at energies below eV and, in this region, are best fit by an injection spectrum with spectral index 2.5-2.6. In the high energy region (above eV) the two experiments maintain their disagreement, but only at the 2 level. Our results clearly show the need for much larger experiments such as Auger, EUSO, and OWL, that can increase the number of detected events by one or two orders of magnitude.
1. Introduction
Astrophysical proton sources distributed homogeneously in the universe produce a feature in the energy spectrum due to the production of pions off the CMB. This feature, consisting of a rather sharp suppression of the flux, occurs at energies above eV, and it is now known as the GZK cutoff. Almost forty years after this prediction it is not yet clear if this effect is observed or not due to the discrepancy between the results of the two largest experiments measuring the spectrum of Ultra High Energy Cosmic Rays (UHECRs). AGASA[1] reports a higher number of events above than expected while HiRes[2] reports a flux consistent with the GZK feature. Here we report on a detailed investigation[4] of the statistical significance of this discrepancy as well as the significance of the presence or absence of the GZK feature in the data. We find that neither experiment has the necessary statistics to establish if the spectrum of UHECRs has a GZK feature. In addition, a systematic error in the energy determination of the two experiments seems to be required in order to make the two sets of observations compatible in the low energy range, eV, where enough events have been detected to make the measurements reliable. Taking into account the systematics, the two experiments predict compatible fluxes at energies below and at energies above the fluxes are within of each other.
2. The cosmic rays propagation code
We assume that UHECRs are protons injected in extragalactic sources with a power-law spectrum with slope and an exponential cutoff at . Based on the results of [3] we assume a spatially uniform distribution of sources and do not take into account luminosity evolution in order to avoid the introduction of additional parameters. We simulate the propagation of protons from source to observer by including the photo-pion production, pair production, and adiabatic energy losses due to the expansion of the universe. We calculate the pair production and adiabatic losses using the continuous energy loss approximation while for the photo-pion production we use a montecarlo approach given the high inelasticity of this interaction [4]. We propagate particles until the statistics of events detected above some energy reproduces the experimental numbers. By normalizing the simulated flux by the number of events above an energy where experiments have high statistics, we can then ask what are the fluctuations in numbers of events above a higher energy where experimental results are sparse. We study the spectrum above eV where the flux is supposed to be dominated by extragalactic sources. For this energy range, we focus on the experiments that have the best statistics: AGASA and HiResI. For AGASA data, the simulation is stopped when the number of events above eV equals 866. For HiRes this number is 300 (but needs to be corrected for exposure). We assume for both experiments a statistical error in the energy determination of 30%.
3. AGASA versus HiResI
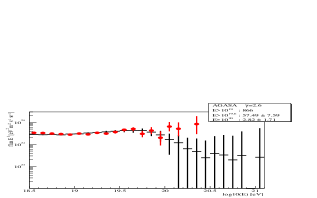
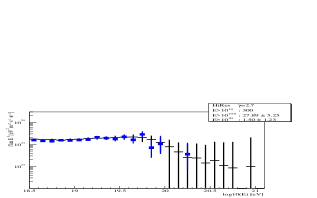
The two largest experiments that measured the flux of UHECRs, AGASA and HiRes, report apparently conflicting results. We apply our simulations to the statistics of these experiments in order to understand whether the discrepancy is statistically significant and whether the GZK feature has indeed been detected in the cosmic ray spectrum. In order to do this, we run 400 realizations of the AGASA and HiRes event statistics for various slopes of the injection spectrum and using the indicator we find the best fit for each data set. Taking into account the data at energies above eV, the best fit spectra are for AGASA and for HiRes. Raising the threshold to eV the best fit spectra become for AGASA and between and for HiRes. In order to quantify the significance of the detection or lack of the GZK flux suppression, we count the mean number of events above eV and we compare it to the observed number. For the best fit injection spectra we find a discrepancy in the range for AGASA and a complete agreement between simulation and observed data for HiRes. In this comparison is simply the error on the observed number of events above eV. Taking into account in this comparison also the theoretical error bars makes the significance of the presence or absence of the GZK feature much weaker, in the range . A more graphical representation of the uncertainties involved is displayed in Fig. 1. The large error bars generated by our simulations at the high energy end of the spectrum are mainly due to the stochastic nature of the process of photo-pion production. The large fluctuations are unavoidable with the extremely small statistics available with present experiments. On the other hand, the error bars at lower energies are minuscule, so that the two data sets (AGASA and HiResI) cannot be considered to be two different realizations of the same phenomenon. Instead, systematic errors in at least one if not both experiments are needed to explain the discrepancies at lower energies where the two spectra, when multiplied by , are systematically shifted by about a factor of two. This shift suggests that there may be a systematic error either in the energy or the flux determination of at least one of the two experiments. A systematic error of in the energy determination is well within the limits that are allowed by the analysis of systematic errors carried out by both collaborations [1,2], so we split the energy gap by assuming that the two experiments have a 15% shift in the energy determination, but in opposite directions. For AGASA, the best fit injection spectrum becomes above eV and above eV. For HiRes, the best fit injection spectrum is for the whole set of data, independent of the threshold. It is interesting to note that the best fit injection spectra as derived for each experiment independently coincides for the corrected data unlike the uncorrected case. This suggests that combined systematic errors in the energy determination at the 30% level may in fact be present.
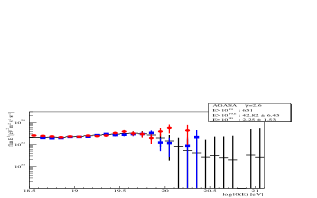
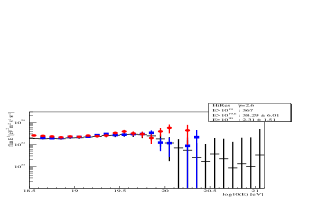
Comparing the observed number of events above eV with the simulated one as in the case without systematics we find that while HiRes remains in agreement with the prediction of a GZK feature, the AGASA data seem to depart from such prediction, but only at the level of . Taking also into account the theoretical error bars the discrepancy level drops further to . In Fig. 2, we plot the simulated spectra for injection spectrum and compare them to observations of AGASA and HiRes.
4. Conclusions
We compared the spectra obtained from AGASA and HiResI and we found a systematic shift in the flux, which may be interpreted as a systematic error in the relative energy determination of about . After the correction for this systematics the two experiment are basically in agreement.
We considered the statistical significance of these spectra and we found that with the low statistical significance of either the excess flux seen by AGASA or the discrepancies between AGASA and HiResI, it is inaccurate to claim either the detection of the GZK feature or the extension of the UHECR spectrum beyond at this point in time. A new generation of experiments is needed to finally give a clear answer to this question. The simulated spectra for Auger and EUSO show that the energy region where statistical fluctuations dominate the spectrum is moved to eV for Auger, allowing a clear identification of the GZK feature. The fluctuations dominated region stands beyond eV for EUSO [4].
5. References
1. Hayashida N. et al., astro-ph/0008102 and ref. therein
2. Abu-Zayyad T. et al., astro-ph/0008301, astro-ph/0008243 and ref. therein
3. Blanton M., Blasi P., Olinto A.V. 2001, Astropart. Phys. 15, 275
4. De Marco D., Blasi P., Olinto A.V. astro-ph/0301497, Astropart. Phys. in press