Optical Spectra of the Type Ia Supernova 1998aq
Abstract
We present 29 optical spectra of the normal Type Ia SN 1998aq, ranging from 9 days before to 241 days after the time of maximum brightness. This spectrocopic data set, together with photometric data presented elsewhere, makes SN 1998aq one of the best observed Type Ia supernovae at optical wavelengths. We use the parameterized supernova synthetic–spectrum code Synow to study line identifications in the early photospheric–phase spectra. The results include evidence for lines of singly ionized carbon, at ejection velocities as low as 11,000 km s-1. Implications for SN Ia explosion models are discussed.
1 INTRODUCTION
The discovery in a relatively nearby galaxy of a Type Ia supernova (SN Ia), more than a week before its time of maximum brightness, presents an observational opportunity that should not be missed. A few days after the discovery of SN 1998aq in NGC 3982 on 1998 April 13 by the U.K. Supernova/Nova Patrol (Hurst, Armstrong, & Arbour 1998), photometric and spectroscopic observations undertaken at the F. L. Whipple Observatory (FLWO) revealed that the supernova was a Type Ia whose brightness was on the rise (Garnavich et al. 1998). Subsequent observations resulted in SN 1998aq becoming one of the best observed SNe Ia at optical wavelengths. The Hubble Space Telescope has been used by Saha et al (2001; see also Stetson & Gibson 2001) to make a Cepheid–based determination of the distance to NGC 3982, so that SN 1998aq can be added to the list of SNe Ia that are used to calibrate the extragalactic distance scale.
A preliminary report of the photometric observations of SN 1998aq has been given by Boffi & Riess (2003), and the final results will appear elsewhere (A. G. Riess et al., in preparation). SN 1998aq reached a maximum brightness of =12.39 on 1998 April 27. The value of , the decline of the blue–band magnitude during the first 15 days after maximum (Phillips 1993), was 1.14, a typical value for a normal SN Ia. SN 1998aq was photometrically normal, except that some of its broad–band colors were unusually blue, e.g., =0.18 at the time of maximum.
2 OBSERVATIONS
Low–dispersion spectra of SN 1998aq were obtained with the FAST spectrograph (Fabricant et al. 1998) on the 1.5-m Tillinghast telescope at FLWO. The FAST spectrograph uses a 2688512 Loral CCD with a spatial scale of 1.1 per pixel in the binning mode used for these observations. Details of the exposures are given in Table 1. The data were reduced in the standard manner with IRAF111IRAF is distributed by the National Optical Astronomy Observatories, which are operated by the Association of Universities for Research in Astronomy, Inc., under cooperative agreement with the National Science Foundation. and our own routines. The spectra were optimally extracted (Horne 1986). Wavelength calibration was accomplished with HeNeAr lamps taken immediately after each SN exposure. Small–scale adjustments derived from night–sky lines in the SN frames were also applied. Spectrophotometric standards are listed in Table 1. We attempted to remove telluric lines using the well–exposed continua of the spectrophotometric standards (Wade & Horne 1988; Matheson et al. 2001). The spectra were, in general, not taken at the parallactic angle (Filippenko 1982). For the spectra modeled in this paper, though, the airmass was low ().
The spectra, labelled by the epoch in days with respect to the date of maximum brightness in the band (1998 April 27), are displayed in Figs. 1 - 3. The spectra are those of a normal SN Ia. The early spectra, from to 7 days (Fig. 1), contain the characteristic deep Si II absorption near 6100 Å and the distinctive S II W–shaped feature from about 5200 to 5500 Å. The spectra between 19 and 91 days (Figs. 2 and 3) are those of a SN Ia making the transformation from the photospheric to the nebular phase. By 211 days (Fig. 3) the transformation was complete.
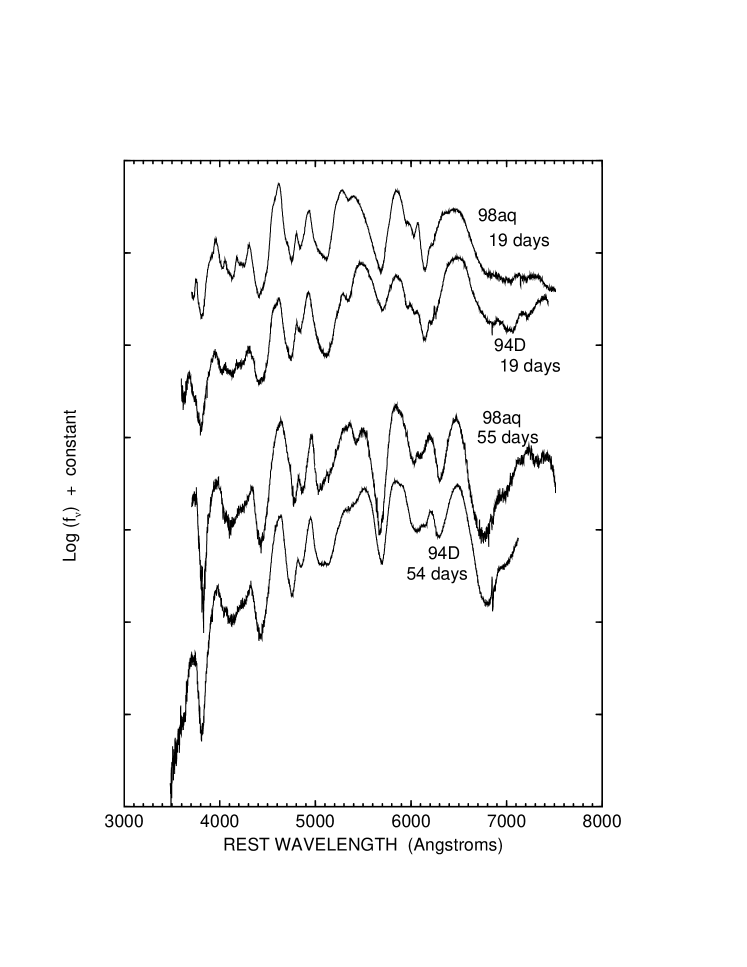
In Figs. 4 and 5, four spectra of SN 1998aq are compared to those of another well observed event, SN 1994D (Patat et al. 1996). The similarity of the spectra at days (Fig. 4) is impressive, considering that pre–maximum spectra of SNe Ia exhibit considerable diversity (e.g., Hatano et al. 2000; Li et al. 2001). At days the main difference is that SN 1998aq has a peak near 4600 Å that is not present in SN 1994D; otherwise practically all of the features, including the weak ones, are quite similar. At 4, 19, and 54/55 days the spectra also are similar, although they are distinguishable, e.g., near 4100 Å at 4 days and near 5400 Å at 19 and 54/55 days.
In Fig. 6 the blueshifts, expressed in km s-1, of the absorption near 6100 Å produced by Si II 6355 in the early spectra of SNe 1998aq and 1994D are compared. Except at the earliest times, when the blueshift is changing rapidly with time and that of SN 1994D is mildly higher than that of SN 1998aq, the differences are within the measurement errors of about 250 km s-1. Fig. 7 shows the blueshifts of four absorption features in SN 1998aq that are not badly blended, and of which we are confident of the identifications (Si II 6355, Ca II 3945, S II 5654, and Si III 4560). The blueshifts of the deep Ca II and Si II absorptions remain near 10,000 km s-1 even at 35 days, but those of the weaker Si III and S II features decrease more rapidly.
From Fig. 6 we estimate a value of 10,300 km s-1 for the parameter — the blueshift of the deep Si II absorption 10 days after maximum brightness (Branch & van den Bergh 1993). In the 0, 1, 2, and 3 day spectra we measure values of 0.22, 0.20, 0.22, and 0.24 for the parameter (Nugent et al. 1995), in good agreement with the values of measured by Vinko et al. (1999) in a day spectrum; we recommend =0.220.01. Hatano et al. (2000) showed and discussed the diversity among SNe Ia in a plot of versus (their Fig. 1). Our measured values put SN 1998aq in the most heavily populated part of their plot, near, e.g., SNe 1994D, 1996X, 1998bu, and 1990N. Garnavich et al. (2000) have shown that there is a tight relation between [referred to as by Garnavich et al.] and . Garnavich et al. intended to measure only in spectra obtained within three days of maximum light, but for SN 1998aq their adopted date of maximum differed from the date later reported by Boffi & Riess (2003). With our recommended value of , based on specta obtained within three days of the revised date of maximum, SN 1998aq fits the Garnavich et al. relation between and even better.
3 LINE IDENTIFICATIONS IN EARLY SPECTRA
The analysis of supernova spectra begins with the often difficult process of making line identifications. Only a limited number of good SN Ia spectra have been obtained well before the time of maximum light, so we are especially interested in exploring line identifications in the earliest spectrum of SN 1998aq, at days. For comparison we also will look at the 0 and 7 day spectra. These three spectra are compared in Fig. 8. The overall appearance of these spectra is rather similar, although some significant changes do occur during this time interval: the Si II, S II, and Ca II absorptions become deeper with time; the absorption trough from 4800 to 5000 Å in the day spectrum breaks up in the 7 day spectrum; and the absorption trough from 4200 to 4500 Å in the 7 day spectrum is more broken up in the day spectrum.
We have studied line identifications by comparing the three spectra of Fig. 8 with numerous synthetic spectra generated with the parameterized supernova synthetic–spectrum code Synow. This code has been used and described in several recent papers, e.g., Branch et al. (2002). The basic assumptions are spherical symmetry, a sharp photosphere, velocity proportional to radius, and resonance scattering in the Sobolev approximation. The shape of the underlying continuum is that of a blackbody at temperature . Line optical depths are taken to vary as , with =1000 km s-1 for all synthetic spectra shown in this paper. For each ion whose lines are introduced, the maximum Sobolev optical depth of a reference line is a fitting parameter. Ordinarily, the maximum line optical depth is at the photosphere, but for a “detached” ion the line optical depth is zero at the photosphere and rises discontinuously to its maximum value at some higher detachment velocity. The optical depths of the other lines of an ion, relative to that of the reference line, are calculated for Boltzmann excitation at temperature . In this paper, instead of adopting a common value of the excitation temperature as the default value, the default value for each ion is the temperature at which the ion’s reference–line optical depth reaches a maximum in plots of optical depth versus temperature (Hatano et al. 1999b). This is a reasonable default since, e.g., if lines of high excitation are present they are likely to be formed in high temperature layers. The default excitation temperatures are used throughout this paper except in one instance that is mentioned below.
3.1 The Day Spectrum
The day spectrum is shown in Fig. 9, with the measured wavelengths of absorption features labelled, so that we can conveniently refer to each absorption throughout this subsection. In this and all subsequent figures of this paper, instead of plotting on the vertical axis we plot , to make the spectrum approximately flat. This provides a better view of features at the longer wavelengths where the underlying continuum is low, which is helpful because the diagnostic value of a spectral feature is not proportional to the level of the underlying continuum. Note also that in order to show as much detail as possible, in this and subsequent figures the flux axis does not go to zero.
In Fig. 10 the same day spectrum is compared with a synthetic spectrum that has km s-1, =16,000 K, and includes lines of seven ions. The ion–specific parameters of the synthetic spectrum are listed in Table 2. The fit shown in Fig. 10 is good by supernova standards, although there are two significant discrepancies that we have not yet resolved: the synthetic spectrum is too high from 4460 to 4580 Å, and too low from 4000 to 4160 Å. The contributions of each ion to the synthetic spectrum of Fig. 10 are shown in Figs. 11 to 17, each of which we now briefly discuss.
Fig. 11 shows that the main contribution of Si II is that 6355 accounts for almost all of the 6115 Å absorption. Note that 6355 produces a synthetic emission peak where an absorption feature is observed. The 5972 and 5051 lines contribute to the 5740 and 4870 Å absorptions. The 4130 line contributes to the 3970 Å absorption, but absorption by 4130 also is partially responsible for our failure to fit the observed emission peak near 4070 Å. In any case, the presence of Si II 6355 in the day spectrum of SN 1998aq is, of course, definite.
Fig. 12 shows that the main contribution of S II is that 5654 and 5468 produce the 5420 and 5260 Å absorptions. Lines near 6305 make a minor contribution to the 6115 Å absorption. The 5208 line may be responsible for the 5110 Å absorption, although it does not produce a distinct absorption in the full synthetic spectrum of Fig. 10. The 5032 line contributes to the 4870 Å absorption and some weaker S II lines make minor contributions. The 4163 line is partially responsible for our failure to fit the observed emission peak near 4070 Å. Nevertheless, the presence of S II 5654 and 5468 is definite.
Fig. 13 shows that the only contribution of Ca II (since the spectrum does not extend to the infrared triplet) is that 3945 (the H&K lines) produces the 3805 Å absorption. The presence of Ca II 3945 is definite.
Fig. 14 shows that Si III 4560 produces the 4390 Å absorption. It is likely that 5743 is responsible for the 5515 Å absorption, although in Fig. 10 the synthetic absorption is at a slightly shorter wavelength that the observed one. We are confident of the presence of Si III 4560.
Fig. 15 shows that Fe III 5156 and 4420 are largely responsible for the 4930 and 4255 Å absorptions. Lines near 6000 also contribute to the 5740 Å absorption. This is the one instance in this paper where we depart from the default excitation temperature. At the Fe III default value of 14,000 K the feature produced by 6000 is present but weaker. We use 16,000 K to show that Fe III might be mainly responsible for the 5740 Å absorption at this epoch. In any case, we are confident of the presence of Fe III 5156 and 4420.
Fig. 16 shows the contribution of Fe II lines, detached at 20,000 km s-1. This means that in the synthetic spectrum, the Fe II optical depths are zero between the velocity at the photosphere, 13,000 km s-1, and the detachment velocity of 20,000 km s-1. The presence of detached, high–velocity Fe II in SN 1994D was suggested by Hatano et al. (1999a) on the basis of Synow synthetic spectra and then supported by Lentz et al. (2001b) who carried out non–local–thermodynamic–equilibrium (NLTE) calculations with the PHOENIX code. In Fig. 16, we see that Fe II 5169, 5018, and 4924, are contributing to the 4870, 4730, and 4640 Å absorptions, respectively. Lines near 4549 and 4025 contribute to the 4295 and 3970 Å absorptions. High–velocity Fe II makes a positive contribution to the full fit in Fig. 10, and we consider its presence in the observed spectrum to be likely.
Fig. 17 shows the contributions of C II lines, slightly detached at 14,000 km s-1. The strongest line, 6580, is playing an important role in the synthetic spectrum: it beats down the unwanted emission component of Si II 6355, and combines with it in the full synthetic spectrum of Fig. 10 to produce a feature near the observed 6310 Å absorption. The 7234 line produces the 6940 Å absorption. (Fig. 17 is a good example of the benefit of plotting : it gives a better view of the features produced by 6580 and 7234.) The 4267 line is at the right wavelength to be consistent with the 4120 Å absorption, although 4267 does not produce a distinct feature in the full synthetic spectrum of Fig. 10. We consider the presence of C II lines to be likely.
3.2 The 0 and 7 Day Spectra
In Fig. 18 the 0 day spectrum of SN 1998aq is compared with a synthetic spectrum that has =11,000 km s-1, =16,000 K, and contains lines of the same seven ions that were used for the day spectrum. The ion–specific parameters of the synthetic spectrum are listed in Table 3. The Fe II lines now are detached at 18,000 rather than 20,000 km s-1, and Si II and S II are mildly detached at 12,000 km s-1. Compared to the synthetic spectrum for days, the Ca II line optical depths are increased by a factor of five, those of Si II and Fe III are up by small factors, the Fe II optical depths are unchanged, and those of S II, Si III, and C II are down by small factors. The overall fit in Fig. 18 is good, the main discrepancies being that the synthetic spectrum again lacks the 4070 Å emission peak, and now the synthetic spectrum is too low from 5800 to 6000 Å. The difference in the heights of the apparent continuum levels at wavelengths longer than 6500 Å has been encountered in previous Synow studies of SNe Ia and probably is caused by our use of a blackbody continuum.
In Fig. 18, C II 6580 again beats down the Si II 6355 emission and produces an absorption notch that may correspond to an observed feature. The 7234 line produces a wiggle in the synthetic spectrum that may be at least partially responsible for the knee in the observed spectrum near 7000 Å.
In Fig. 19 the 7 day spectrum of SN 1998aq is compared with a synthetic spectrum that has =11,000 km s-1 and =16,000 K. The ion–specific parameters of the synthetic spectrum are listed in Table 4. This synthetic spectrum contains lines of six of the seven ions used previously, Si III now being omitted. Fe II has two components: one detached at 18,000 km s-1 as in the 0 day spectrum, and now also an undetached component. Compared to the 0 day spectrum, the optical depths of the Si II, S II, Ca II, C II, and Fe II lines have been increased while Fe III has been decreased. The synthetic spectrum of Fig. 19 also includes contributions from Mg II, Na I, Co II, and Ti II lines, but their contributions are not major and we do not consider their presence in the observed spectrum to be established. To the extent to which we have been able to account for it, the breakup of the 4800 to 5000 Å region and the filling in of the 4200 to 4500 Å region, both mentioned above in the discussion of Fig. 8, are caused by the emergence of the undetached Fe II component. The main discrepancy in Fig. 19 is that the synthetic spectrum is too low in the interval 5100 to 6000 Å.
In Fig. 19, C II 6580 leads to a (perhaps fortuitously) good fit at the top of the Si II 6355 emission, and again 7234 produces a feature that appears to be responsible for the observed one near 7000 Å.
4 DISCUSSION
The identification of lines of Si II, S II, Ca II, Fe III, and Si III in early spectra of SNe Ia is not new, but the figures of this paper clearly illustrate the extent to which lines of these ions can account, with simple assumptions, for the observed spectral features in SN 1998aq. It is instructive to compare parameterized Synow spectrum fits with NLTE synthetic spectra for specific explosion models. Lentz et al. (2001b) used the PHOENIX code to make detailed calculations of spectra of the deflagration model W7 (Nomoto, Thielemann, & Yokoi 1984) and found reasonably good agreement with the early spectra of SN 1994D, which as we have seen in §2 was spectroscopically similar to SN 1998aq. Fig. 20 is like Fig. 10 but also including the PHOENIX spectrum of model W7 at 11 days after explosion (corresponding to about 9 days before maximum light). The model W7 spectrum does have peaks and dips at some of the right wavelengths, but there is room for improvement. For example, the W7 spectrum lacks the 4390 Å absorption that we attribute to Si III 4560, and the W7 emission peaks near 5900 and 6400 Å are too high. Ongoing work involving close comparative studies of observed spectra, Synow–level synthetic spectra, and PHOENIX–level spectra of explosion models will provide indications of how explosion models need to be altered to give better agreement with observed spectra.
Apparently, Fe II features forming at high velocity, km s-1, are present at the three epochs we have studied. Hatano et al. (1999a) identified high–velocity ( km s-1) Ca II and Fe II lines in SN 1994D. Kasen et al. (2003) discuss high–velocity (18,000 to 25,000 km s-1) components of the Ca II infrared triplet in flux and polarization spectra of SNe 2001el, and Thomas et al. (2003) discuss high–velocity ( km s-1) Ca II in flux spectra of the peculiar SN 2000cx. Both Kasen et al. and Thomas et al. conclude that the Ca II features formed in non–spherical geometry, probably in clumps located in front of the photosphere. The spectra of SN 1998aq do not extend to the Ca II infrared triplet (and barely extend to the high–velocity side of the Ca II H&K feature) so we have not established the presence of high–velocity Ca II features in SN 1998aq. In any case, the presence of high–velocity features in early spectra of SNe Ia evidently is not uncommon. Further studies of early–time polarization and flux spectra of SNe Ia are needed to clarify the composition, geometry, and origin of the high–velocity matter.
Perhaps the most significant result of our analysis of SN 1998aq is the evidence for C II lines. The possible presence of C II in early spectra of SNe Ia has been discussed before. For instance, Mazzali (2001) tentatively attributed absorptions in a day spectrum of SN 1990N to C II 6580 and 7234 forming near the photospheric velocity of about 16,000 km s-1. The features that we attribute to 6580 and 7234 in SN 1998aq are conspicuous in our figures because of we plot to raise the red end of the spectra. If C II is present in SN 1998aq then it also is present in at least some of the other SNe Ia that have been observed at early times; e.g., similar features can be seen in spectra of SN 1994D (Fig. 4) and SN 1996X (Salvo et al. 2001).
The presence of C II would have important implications for SN Ia explosion models. In the synthetic spectrum of Fig. 10, we use C II detached at 14,000 km s-1, but in Figs. 18 and 19, C II is undetached and therefore forming down to the photospheric velocity of 11,000 km s-1, and we have not established the absence of carbon at even lower velocities. Published delayed–detonation models for normal SNe Ia have very little carbon below about 30,000 km s-1. Model W7, a parameterized one–dimensional (1D) deflagration model, has unburned carbon down to 14,000 km s-1. Recently computed 3D deflagrations (Khokhlov 2000; Gamezo et al. 2003) have carbon at all ejection velocities. The spectroscopic appearance of such models has begun to be explored (Baron et al. 2003). In the context of existing models, the presence of C II lines may be consistent with deflagrations but not with delayed–detonations. However, the spectra of 3D deflagration models appear to be inconsistent with SN Ia spectra in other respects (Thomas et al. 2002; Gamezo et al. 2003), while delayed–detonations have been found to be consistent with certain unusual SNe Ia (Lentz et al. 2001a) and in some respects with normal SNe Ia (Wheeler et al 1998). Much further work on comparing synthetic spectra, both parameterized and detailed, with observed spectra of SNe Ia is needed to guide us towards satisfactory explosion models.
This work has been supported by NSF grants AST-9986965 and AST-0204771 and NASA grant NAG5-12127.
References
- (1)
- (2) Baron, E., Lentz, E. J., & Hauschildt, P. H. 2003, ApJ, in press
- (3)
- (4) Boffi, F. R. & Riess, A. G. 2003, in Symbiotic Stars Probing Stellar Evolution, eds. R. L. M. Corrdai, J Mikolajewska, & T. J. Mahoney (San Francisco, ASP), in press
- (5)
- (6) Branch, D. & van den Bergh, S. 1993, AJ, 105, 2231
- (7)
- (8) Branch, D. et al. 2002, ApJ, 566, 1005
- (9)
- (10) Fabricant, D., Cheimets, P., Caldwell, N., & Geary, J. 1998, PASP, 110, 79
- (11)
- (12) Filippenko, A. V. 1982, PASP, 94, 715
- (13)
- (14) Gamezo, V., Khokhlov, A., Oran, E., Chtchelkanova, A., Rosenberg, R. 2003, Science, 299, 77
- (15)
- (16) Garnavich, P. et al. 1998, IAU Circ. No. 6880
- (17)
- (18) Garnavich, P. M. et al. 2000 (astro-ph/0105490)
- (19)
- (20) Hatano, K., Branch, D., Fisher, A., Baron, E., & Filippenko, A. V. 1999a, ApJ, 525, 881
- (21)
- (22) Hatano, K., Branch, D., Fisher, A., Millard, J., & Baron, E. 1999b, ApJS, 121, 233
- (23)
- (24) Hatano, K., Branch, D., Lentz, E.J., Baron, E., Filippenko, A. V., & Garnavich, P. M. 2000, ApJ, 543, L49
- (25)
- (26) Horne, K. 1986, PASP, 98, 609
- (27)
- (28) Hurst, G. M., Armstrong, M., & Arbour, R. 1998, IAU Circ. No. 6875
- (29)
- (30) Kasen, D. et al. 2003, ApJ, in press (astro-ph/0301312)
- (31)
- (32) Khokhlov, A. 2000, (astro-ph/0008463)
- (33)
- (34) Lentz, E. J., Baron, E., Branch, D., & Hauschildt, P. H. 2001a, ApJ, 547, 908
- (35)
- (36) Lentz, E. J., Baron, E., Branch, D., & Hauschildt, P. H. 2001b, ApJ, 557, 266
- (37)
- (38) Li, W. et al. 2001, ApJ, 546, 734
- (39)
- (40) Matheson, T., Filippenko, A. V., Ho, L. C., Barth, A. J., & Leonard, D. C. 2000, AJ, 120, 1499
- (41)
- (42) Mazzali, P. A. 2001, MNRAS, 321, 341
- (43)
- (44) Nomoto, K., Thielemann, F.-K., & Yokoi, K. 1984, ApJ, 286, 644
- (45)
- (46) Nugent, P., Phillips, M. M., Baron, E., Branch, D., & Hauschildt, P. 1995, ApJ, 455, L147
- (47)
- (48) Patat, F., Benetti, S., Cappellaro, E., Danziger, I. J., Della Valle, M., Mazzali, P. M., & Turatto, M. 1996, MNRAS, 278, 111
- (49)
- (50) Phillips, M. M. 1993, ApJ, 413, L105
- (51)
- (52) Saha, A., Sandage, A., Tammann, G. A., Dolphin, A. E., Christensen, J/, Panagia, N., & Macchetto, F. D. 2001, ApJ, 562, 314
- (53)
- (54) Salvo, M. E., Cappellaro, E., Mazzali, P. A., Benetti, S., Danziger, I. J., Patat, F., & Turatto, M. 2001, MNRAS, 321, 254
- (55)
- (56) Stetson, P. M. & Gibson, B. K. 2001, MNRAS, 328, 1
- (57)
- (58) Thomas, R. C., Kasen, D., Branch, D., & Baron, E. 2002, ApJ, 567, 1037
- (59)
- (60) Thomas, R. C., Branch, D., & Baron, E., Nomoto, K., Li, W., & Filippenko, A. V. 2003, ApJ, submitted (astro-ph/0302260)
- (61)
- (62) Wade, R. A., & Horne, K. D. 1988, ApJ, 324, 411
- (63)
- (64) Wheeler, J. C., Höflich, P., Harkness, R. P., & Spyromilio, J. 1998, ApJ, 496, 908
- (65)
- (66) Vinkó, J., Kiss, L. L., Thomson, J., Furész, G., Lu, W., Kaszás, G., & Balog, Z. 1999, A&A, 345, 592
- (67)


| UT Date | Julian Day | Tel. | Range | Res. | P.A. | Par. | Air. | Flux Std. | Sky | See. | Slit | Exp. | Observer(s) |
|---|---|---|---|---|---|---|---|---|---|---|---|---|---|
| (Å) | (Å) | (∘) | (∘) | (′′) | (′′) | (s) | |||||||
| 1998-04-18.28 | 2450921.78 | FLWO | 3720.00-7420.5 | 7.0 | 90.00 | 149.67 | 1.12 | Feige34 | clear | 1-2 | 3 | 900 | P Berlind / M Calk |
| 1998-04-19.26 | 2450922.76 | FLWO | 3270-7140 | 7.0 | 90.00 | 163.01 | 1.10 | Feige110 | clear | 2 | 3 | 900 | P Berlind / M Calk |
| 1998-04-24.36 | 2450927.86 | FLWO | 4080.00-6080.2 | 7.0 | 110.00 | 104.63 | 1.38 | Feige34 | clear | 2 | 2 | 1200 | Kannappan/Lepore |
| 1998-04-27.29 | 2450930.79 | FLWO | 3720-7500 | 7.0 | 110.00 | 130.62 | 1.17 | Feige34 | clear | 2 | 2 | 600 | P Berlind |
| 1998-04-28.26 | 2450931.76 | FLWO | 3720.00-7510.5 | 7.0 | 90.00 | 148.58 | 1.12 | Feige34 | mostly cle | 2 | 3 | 600 | P Berlind |
| 1998-04-29.26 | 2450932.76 | FLWO | 3720-7521 | 7.0 | 90.00 | 145.02 | 1.13 | Feige34 | mostly cle | 2+ | 3 | 600 | P Berlind |
| 1998-04-30.24 | 2450933.74 | FLWO | 3720-7521 | 7.0 | 90.00 | 152.80 | 1.11 | Feige34 | mostly cle | 2+ | 3 | 600 | M Calkins |
| 1998-05-01.25 | 2450934.75 | FLWO | 3720-7521 | 7.0 | 90.00 | 145.21 | 1.13 | Feige34 | clear | 3 | 3 | 600 | M Calkins |
| 1998-05-02.23 | 2450935.73 | FLWO | 3720-7521 | 7.0 | 90.00 | 158.42 | 1.10 | Feige34 | clear | 3 | 3 | 600 | M Calkins |
| 1998-05-03.24 | 2450936.74 | FLWO | 3720-7515 | 7.0 | 90.00 | 148.00 | 1.12 | Feige34 | mostly cle | 1-2 | 3 | 600 | P Berlind |
| 1998-05-04.26 | 2450937.76 | FLWO | 3720-7512 | 7.0 | 90.00 | 136.26 | 1.15 | Feige34 | lots of ci | 1-2 | 3 | 600 | P Berlind |
| 1998-05-16.17 | 2450949.67 | FLWO | 3720-7540.5 | 7.0 | 90.00 | 176.89 | 1.09 | Feige34 | mostly cle | 1-2 | 3 | 600 | P Berlind |
| 1998-05-18.20 | 2450951.70 | FLWO | 3720-7540.5 | 7.0 | 90.00 | 151.82 | 1.11 | Feige34 | scattered | 1 | 3 | 600 | M. Calkins |
| 1998-05-28.22 | 2450961.72 | FLWO | 3720-7540.5 | 7.0 | 91.00 | 122.30 | 1.21 | Feige34 | clear | 2 | 3 | 660 | P Berlind |
| 1998-05-29.19 | 2450962.69 | FLWO | 3720-7540.5 | 7.0 | 91.00 | 136.41 | 1.15 | Feige34 | cirrus to | 2-3 | 3 | 660 | P Berlind |
| 1998-05-31.20 | 2450964.70 | FLWO | 3720-7540.5 | 7.0 | 91.00 | 131.81 | 1.17 | Feige34 | cirrus all | 2 | 3 | 900 | M Calkins |
| 1998-06-02.23 | 2450966.73 | FLWO | 3720-7540.5 | 7.0 | 91.00 | 113.20 | 1.27 | BDp284211 | Clear | 3 | 3 | 600 | M Calkins |
| 1998-06-17.17 | 2450981.67 | FLWO | 3720-7540.5 | 7.0 | 90.00 | 123.89 | 1.21 | BDp284211 | Clear | 1-2 | 3 | 900 | B. Carter |
| 1998-06-21.18 | 2450985.68 | FLWO | 3720-7540.5 | 7.0 | 90.00 | 112.71 | 1.28 | BDp284211 | Clear | 1-2 | 3 | 900 | M. Calkins |
| 1998-06-24.19 | 2450988.69 | FLWO | 3720-7540.5 | 7.0 | 90.00 | 106.38 | 1.35 | BDp284211 | cirrus | 1-2 | 3 | 900 | P Berlind |
| 1998-06-26.19 | 2450990.69 | FLWO | 3720-7540.5 | 7.0 | 90.00 | 104.67 | 1.36 | BDp284211 | hazy but c | 1-2 | 3 | 720 | P Berlind/K Rines |
| 1998-06-29.17 | 2450993.67 | FLWO | 3720-7540.5 | 7.0 | 90.00 | 106.92 | 1.34 | BDp284211 | hazy but c | 1-2 | 3 | 900 | K Rines |
| 1998-07-02.17 | 2450996.67 | FLWO | 3720-7540.5 | 7.0 | 90.00 | 103.76 | 1.37 | BDp284211 | clear! | 2+ | 3 | 660 | P Berlind |
| 1998-07-15.21 | 2451009.71 | FLWO | 3720-7540.5 | 7.0 | 90.00 | 82.10 | 1.92 | BDp284211 | hazy | 2 | 3 | 1200 | P Berlind |
| 1998-07-18.18 | 2451012.68 | FLWO | 3720-7540.5 | 7.0 | 90.00 | 87.61 | 1.67 | BDp284211 | major buil | 3 | 600 | M Calkins | |
| 1998-07-27.17 | 2451021.67 | FLWO | 3720-7540.5 | 7.0 | 90.00 | 82.81 | 1.86 | BDp284211 | a few scat | 2 | 3 | 900 | P Berlind |
| 1998-11-24.54 | 2451142.04 | FLWO | 3720-7540.5 | 7.0 | 90.00 | -114.52 | 1.20 | Feige34 | clear | 1+ | 3 | 1200 | K Rines, J. Huchra |
| 1998-11-24.54 | 2451142.04 | FLWO | 3720-7540.5 | 7.0 | 90.00 | -119.80 | 1.18 | Feige34 | clear | 1+ | 3 | 900 | K Rines, J. Huchra |
| 1998-12-14.53 | 2451162.03 | FLWO | 3720-7540.5 | 7.0 | 59.00 | -139.75 | 1.11 | Feige34 | clear | 1-2 | 3 | 1200 | M Calkins, A Mahda |
| 1998-12-14.55 | 2451162.05 | FLWO | 3720-7540.5 | 7.0 | 59.00 | -148.65 | 1.10 | Feige34 | clear | 1-2 | 3 | 1200 | M Calkins, A Mahda |
| 1998-12-24.53 | 2451172.03 | FLWO | 3720-7540.5 | 7.0 | 90.00 | -157.34 | 1.09 | Feige34 | cirrus | 2 | 3 | 1200 | M Calkins |
| 1998-12-24.55 | 2451172.05 | FLWO | 3720-7540.5 | 7.0 | 90.00 | -167.64 | 1.09 | Feige34 | cirrus | 2 | 3 | 1200 | M Calkins |
| ion | (ref) | (ref) | vmin | Texc |
|---|---|---|---|---|
| Si II | 6347 | 3.5 | 8000 | |
| S II | 5454 | 1.6 | 10000 | |
| Ca II | 3934 | 6.0 | 5000 | |
| Si III | 4553 | 3.0 | 14000 | |
| Fe III | 5156 | 1.3 | 16000 | |
| Fe II | 5018 | 0.4 | 20000 | 7000 |
| C II | 6578 | 0.9 | 14000 | 12000 |
| ion | (ref) | (ref) | vmin | Texc |
|---|---|---|---|---|
| Si II | 6347 | 4.0 | 12000 | 8000 |
| S II | 5454 | 1.5 | 12000 | 10000 |
| Ca II | 3934 | 30 | 5000 | |
| Si III | 4553 | 2.2 | 14000 | |
| Fe III | 5156 | 1.7 | 14000 | |
| Fe II | 5018 | 0.4 | 18000 | 7000 |
| C II | 6578 | 0.5 | 12000 |
| ion | (ref) | (ref) | vmin | Texc |
|---|---|---|---|---|
| Si II | 6347 | 12 | 8000 | |
| S II | 5454 | 1.8 | 10000 | |
| Ca II | 3934 | 40 | 5000 | |
| Fe III | 5156 | 1.2 | 14000 | |
| Fe II | 5018 | 2.0 | 7000 | |
| Fe II | 5018 | 2.0 | 18000 | 7000 |
| C II | 6578 | 0.9 | 12000 | |
| Mg II | 4481 | 1.0 | 12000 | |
| Na I | 5890 | 0.5 | 12000 | |
| Co II | 4161 | 1.0 | 14000 | 12000 |
| Ti II | 4550 | 0.2 | 14000 | 6000 |