The Optical Gravitational Lensing Experiment. Catalog of stellar proper motions in the OGLE-II Galactic bulge fields
Abstract
We present a proper motion () catalogue of 5,080,236 stars in 49 Optical Gravitational Lensing Experiment II (OGLE-II) Galactic bulge (GB) fields, covering a range of and , the total area close to 11 square degrees. The proper motion measurements are based on -band images taken during four observing seasons: 1997-2000. The catalogue stars are in the magnitude range mag. In particular, the catalogue includes Red Clump Giants (RCGs) and Red Giants in the GB, and main sequence stars in the Galactic disc. The proper motions up to mas yr -1 were measured with the mean accuracy of mas yr-1, depending on the brightness of a star. This catalogue may be useful for studying the kinematic of stars in the GB and the Galactic disk.
keywords:
Galaxy:bulge – Galaxy:center – Galaxy:kinematics and dynamics–Galaxy:structure – astrometry1 Introduction
The Galactic Bulge (GB) is the nearest bulge in which individual stars can be studied in detail. A study of stellar populations and stellar dynamics in the Bulge may help us understand how bulges formed, what are their populations, gravitational potential and structure.
The proper motions with precise photometry might make it possible to separate the observed populations based on their kinematics. Such study has first been done by Spaenhauer, Jones & Whitford (1992) with photographic plates only for a few hundred of brightest red giants in Baade’s window. Recently deeper study has been done by Kuijken & Rich (2002) with Hubble Space Telescope (HST)/WFPC2 in Baade’s window.
Several groups have carried out gravitational microlensing observations toward dense stellar fields, such as the Magellanic clouds, the Galactic center and disc. Until now, hundreds of events have been found (EROS: Aubourg et al. 1993; OGLE: Udalski et al. 2000; Woźniak et al. 2001; MACHO: Alcock et al. 2000; MOA: Bond et al. 2001; Sumi et al. 2003), and thousands are expected in the upcoming years by MOA 111http://www.phys.canterbury.ac.nz/~physib/alert/alert.html, OGLE-III 222 http://www.astrouw.edu.pl/~ogle/ogle3/ews/ews.html and other collaborations.
It is well known that the gravitational microlensing survey data is well suited for numerous other scientific projects (see Paczyński 1996; Gould 1996). The studies of the Galactic structure certainly benefit from this type of data. The microlensing optical depth probes the mass density of compact objects along the line of sight and the event time-scale distribution is related to the mass function and kinematics of the lensing objects. Observed high optical depth may be explained by the presence of the bar (Udalski et al. 1994; Alcock et al. 1997, 2000; Sumi et al. 2003; Afonso et al. 2003; Popowski et al 2003) There is substantial evidence that the Galaxy has a bar at its center (de Vaucouleurs 1964; Blitz & Spergel 1991; Stanek et al. 1994, 1997; Kiraga & Paczyński 1994; Häfner et al. 2000). However, the parameters of the bar, e.g., its mass, size, and the motion of stars within it, still remain poorly constrained.
Stanek et al. (1997) used the Red Clump Giants (RCGs) to constrain the axial ratios and orientation of the Galactic bar. These stars are the equivalent of the horizontal branch stars for a metal-rich population, i.e., relatively low-mass core helium burning stars. RCGs in the GB occupy a distinct region in the colour magnitude diagram (Stanek et al. 2000 and references therein). The intrinsic width of the luminosity distribution of RCGs in the GB is small, about 0.2 mag (Stanek et al. 1997; Paczyński & Stanek 1998). Their observed peak and width of the luminosity function are related to the distance and radial depth of the bar.
Furthermore, Mao & Paczyński (2002) suggested that there should be a difference in average proper motions of 1.6 mas yr-1 between the bright and faint RCG sub-samples, which are on average on the near and the far side of the bar, respectively, if their tangential streaming motion is 100 km s-1. Following this suggestion, Sumi, Eyer & Woźniak (2003) measured mean proper motion of bright and faint RCGs in one OGLE-II field in Baade’s Window, and they found a difference to be mas yr-1.
To expand this analysis we measured proper motions in all 49 GB fields observed by the Optical Gravitational Lensing Experiment 333see http://www.astrouw.edu.pl/~ogle or http://bulge.princeton.edu/~ogle II (OGLE-II; Udalski et al. 2000) for stars down to mag, which is sufficiently deep to include RCGs. There are several earlier proper motion catalogues of this general area (c.f. USNO-B:Monet et al. 2002, Improved NLTT:Salim & Gould 2003 and Tycho-2:Høg et al. 2000). Though the area covered by our catalogue is relatively small, it reaches deeper and covers a wide range of proper motion ( mas yr-1) with the accuracy as good as ( 1 mas yr-1). In § 2 we describe the data. We present the analysis method in § 3 and 4. In § 5, 6 and 7 we describe the property, zero point and problems in our catalogue. Discussion and conclusion are given in § 8.
2 DATA
We use the data collected during the second phase of the OGLE experiment, between 1997 and 2000. All observations were made with the 1.3-m Warsaw telescope located at the Las Campanas Observatory, Chile, which is operated by the Carnegie Institution of Washington. The ”first generation” camera has a SITe 2048 2048 pixel CCD detector with pixel size of 24 m resulting in 0.417 arcsec/pixel scale. Images of the GB fields were taken in drift-scan mode at ”medium” readout speed with the gain 7.1 /ADU and readout noise of 6.3 . A single 2048 8192 pixel frame covers an area of 0.24 0.95 deg2. Saturation level is about 55,000 ADU. Details of the instrumentation setup can be seen in Udalski, Kubiak & Szymański (1997).
In this paper we use 138-555 -band frames of the BUL_SC1-49 fields. The centers of these fields are listed in Table 1. The time baseline is almost 4 years. There are gaps between the observing seasons when the GB cannot be observed from the Earth, each about 3 months long. The median seeing is . We use the photometric maps of the standard OGLE template (Udalski et al. 2002) as the astrometric and photometric references.
Only about 70% of the area of the BUL_SC1 field overlaps with the extinction map made by Stanek (1996). The extinction map covering all OGLE-II fields has been constructed by Sumi (2003).
| field | (mas yr-1), for (mag) = | ||||||||||||
|---|---|---|---|---|---|---|---|---|---|---|---|---|---|
| (deg.) | (deg.) | 11.5 | 12.5 | 13.5 | 14.5 | 15.5 | 16.5 | 17.5 | |||||
| BUL_SC1 | 1.08 | -3.62 | 259 | 120697 | 2.38 | 0.92 | 0.88 | 0.99 | 1.34 | 2.53 | 6.01 | ||
| BUL_SC2 | 2.23 | -3.46 | 264 | 140398 | 2.62 | 0.94 | 0.89 | 1.04 | 1.40 | 2.83 | 6.76 | ||
| BUL_SC3 | 0.11 | -1.93 | 555 | 167580 | 1.98 | 0.66 | 0.63 | 0.78 | 1.22 | 2.02 | 4.66 | ||
| BUL_SC4 | 0.43 | -2.01 | 514 | 179906 | 2.34 | 0.69 | 0.69 | 0.89 | 1.44 | 2.50 | 5.73 | ||
| BUL_SC5 | -0.23 | -1.33 | 392 | 113793 | 1.95 | 0.78 | 0.74 | 0.84 | 1.12 | 2.03 | 3.54 | ||
| BUL_SC6 | -0.25 | -5.70 | 306 | 65578 | 1.78 | 0.92 | 0.85 | 0.94 | 1.25 | 2.23 | 4.47 | ||
| BUL_SC7 | -0.14 | -5.91 | 323 | 62357 | 2.00 | 0.93 | 0.90 | 1.00 | 1.30 | 2.27 | 4.40 | ||
| BUL_SC8 | 10.48 | -3.78 | 289 | 52549 | 2.05 | 0.90 | 0.86 | 0.95 | 1.20 | 1.99 | 3.79 | ||
| BUL_SC9 | 10.59 | -3.98 | 288 | 51274 | 1.82 | 0.90 | 0.85 | 0.91 | 1.17 | 1.96 | 3.71 | ||
| BUL_SC10 | 9.64 | -3.44 | 291 | 57064 | 1.80 | 0.99 | 0.93 | 0.97 | 1.27 | 2.13 | 4.09 | ||
| BUL_SC11 | 9.74 | -3.64 | 280 | 51181 | 1.87 | 1.01 | 0.93 | 0.96 | 1.24 | 2.01 | 3.83 | ||
| BUL_SC12 | 7.80 | -3.37 | 294 | 79162 | 2.26 | 0.98 | 0.93 | 1.02 | 1.36 | 2.37 | 4.71 | ||
| BUL_SC13 | 7.91 | -3.58 | 270 | 79082 | 2.21 | 1.04 | 1.02 | 1.07 | 1.47 | 2.50 | 4.93 | ||
| BUL_SC14 | 5.23 | 2.81 | 290 | 90091 | 2.39 | 1.01 | 0.97 | 1.05 | 1.44 | 2.41 | 5.23 | ||
| BUL_SC15 | 5.38 | 2.63 | 285 | 84372 | 2.19 | 0.98 | 0.94 | 1.03 | 1.39 | 2.26 | 4.88 | ||
| BUL_SC16 | 5.10 | -3.29 | 277 | 100885 | 2.30 | 1.01 | 0.93 | 1.03 | 1.42 | 2.57 | 5.49 | ||
| BUL_SC17 | 5.28 | -3.45 | 284 | 101955 | 2.21 | 0.95 | 0.92 | 1.02 | 1.40 | 2.58 | 5.50 | ||
| BUL_SC18 | 3.97 | -3.14 | 275 | 133282 | 2.48 | 0.97 | 0.91 | 1.08 | 1.47 | 2.91 | 6.64 | ||
| BUL_SC19 | 4.08 | -3.35 | 273 | 112421 | 2.39 | 0.97 | 0.93 | 1.02 | 1.38 | 2.53 | 5.84 | ||
| BUL_SC20 | 1.68 | -2.47 | 316 | 169423 | 2.70 | 0.99 | 0.98 | 1.15 | 1.67 | 3.36 | 8.10 | ||
| BUL_SC21 | 1.80 | -2.66 | 321 | 161268 | 2.64 | 0.99 | 0.96 | 1.13 | 1.63 | 3.34 | 7.77 | ||
| BUL_SC22 | -0.26 | -2.95 | 414 | 111768 | 2.32 | 0.79 | 0.77 | 0.83 | 1.19 | 1.92 | 4.59 | ||
| BUL_SC23 | -0.50 | -3.36 | 350 | 94798 | 2.15 | 0.80 | 0.73 | 0.79 | 1.10 | 1.74 | 4.10 | ||
| BUL_SC24 | -2.44 | -3.36 | 359 | 91733 | 2.20 | 0.87 | 0.80 | 0.85 | 1.19 | 1.88 | 4.22 | ||
| BUL_SC25 | -2.32 | -3.56 | 342 | 90853 | 2.48 | 0.84 | 0.78 | 0.86 | 1.14 | 1.85 | 4.30 | ||
| BUL_SC26 | -4.90 | -3.37 | 346 | 95233 | 2.00 | 0.85 | 0.81 | 0.94 | 1.31 | 2.28 | 5.03 | ||
| BUL_SC27 | -4.92 | -3.65 | 334 | 92508 | 2.11 | 0.88 | 0.84 | 0.94 | 1.29 | 2.22 | 4.90 | ||
| BUL_SC28 | -6.76 | -4.42 | 321 | 57501 | 2.15 | 0.83 | 0.75 | 0.79 | 0.98 | 1.64 | 3.43 | ||
| BUL_SC29 | -6.64 | -4.62 | 313 | 57822 | 2.38 | 0.81 | 0.76 | 0.78 | 1.00 | 1.66 | 3.41 | ||
| BUL_SC30 | 1.94 | -2.84 | 323 | 151877 | 2.65 | 0.91 | 0.87 | 1.05 | 1.51 | 2.94 | 7.05 | ||
| BUL_SC31 | 2.23 | -2.94 | 334 | 155383 | 2.22 | 0.95 | 0.92 | 1.11 | 1.54 | 3.11 | 7.42 | ||
| BUL_SC32 | 2.34 | -3.14 | 313 | 155100 | 2.31 | 0.93 | 0.91 | 1.10 | 1.55 | 3.21 | 7.56 | ||
| BUL_SC33 | 2.35 | -3.66 | 273 | 121848 | 2.57 | 0.92 | 0.85 | 1.00 | 1.34 | 2.56 | 6.01 | ||
| BUL_SC34 | 1.35 | -2.40 | 329 | 156281 | 2.49 | 0.99 | 0.95 | 1.16 | 1.70 | 3.04 | 7.54 | ||
| BUL_SC35 | 3.05 | -3.00 | 260 | 139324 | 2.51 | 0.96 | 0.89 | 1.05 | 1.45 | 2.87 | 6.80 | ||
| BUL_SC36 | 3.16 | -3.20 | 290 | 145376 | 2.70 | 0.99 | 0.95 | 1.10 | 1.55 | 3.27 | 7.92 | ||
| BUL_SC37 | 0.00 | -1.74 | 406 | 152704 | 2.46 | 0.75 | 0.72 | 0.87 | 1.27 | 2.13 | 4.49 | ||
| BUL_SC38 | 0.97 | -3.42 | 268 | 123428 | 2.40 | 0.93 | 0.90 | 1.05 | 1.43 | 2.66 | 6.41 | ||
| BUL_SC39 | 0.53 | -2.21 | 415 | 155735 | 2.46 | 0.79 | 0.77 | 0.91 | 1.38 | 2.26 | 5.53 | ||
| BUL_SC40 | -2.99 | -3.14 | 325 | 82152 | 2.11 | 0.89 | 0.82 | 0.88 | 1.19 | 1.85 | 3.99 | ||
| BUL_SC41 | -2.78 | -3.27 | 312 | 87013 | 2.44 | 0.90 | 0.86 | 0.91 | 1.24 | 1.96 | 4.34 | ||
| BUL_SC42 | 4.48 | -3.38 | 273 | 99152 | 2.40 | 0.98 | 0.94 | 1.03 | 1.45 | 2.50 | 5.31 | ||
| BUL_SC43 | 0.37 | 2.95 | 382 | 76840 | 1.86 | 0.80 | 0.82 | 0.84 | 1.14 | 1.91 | 3.65 | ||
| BUL_SC44 | -0.43 | -1.19 | 343 | 68457 | 1.85 | 0.86 | 0.86 | 0.90 | 1.17 | 1.98 | 3.75 | ||
| BUL_SC45 | 0.98 | -3.94 | 140 | 107362 | 3.13 | 1.67 | 1.65 | 1.85 | 2.45 | 4.62 | 10.57 | ||
| BUL_SC46 | 1.09 | -4.14 | 138 | 97197 | 3.38 | 1.86 | 1.78 | 1.94 | 2.46 | 4.45 | 10.43 | ||
| BUL_SC47 | -11.19 | -2.60 | 242 | 47459 | 3.01 | 1.32 | 1.29 | 1.33 | 1.59 | 2.47 | 4.74 | ||
| BUL_SC48 | -11.07 | -2.78 | 237 | 47673 | 2.65 | 1.39 | 1.29 | 1.28 | 1.56 | 2.44 | 4.70 | ||
| BUL_SC49 | -11.36 | -3.25 | 234 | 43341 | 3.09 | 1.29 | 1.26 | 1.25 | 1.50 | 2.32 | 4.51 | ||
3 Analysis
The analysis in this work follows Sumi, Eyer & Woźniak (2003), except our procedure makes it possible to detect high proper motions, extends to the limiting magnitude down to mag and corrects the systematic effects. The standard OGLE template given by Udalski et al. (2002) serves as the fixed astrometric reference in our analysis. In order to treat properly frame distortions in the y-axis (declination) due to drift-scan mode of observation each OGLE-II field is divided into 64 subframes before processing. Subframes are 2048128 pixels with a 14 pixel margin on each side.
We compute the pixel positions of stars in the images using the DoPHOT package (Schechter, Mateo & Saha 1993). At the start of the processing for each exposure, the positions of stars in a single subframe are measured and cross-referenced with those in the template and the overall frame shift is obtained. Using this crude shift we can identify the same region of the sky (corresponding to a given subframe of the template) throughout the entire sequence of frames.
To treat properly spatial PSF variations, each 2048128 pixel subframe is divided into 4 smaller chunks with a size of 512128 pixels with a 14 pixel margin on each side. Then the positions of stars in all chunks are computed by DoPHOT. We use all stars with mag ( of them, depending on the stellar density in each field) categorized by DoPHOT as isolated stars (marked as type=1) in the following analysis. We do not use the data points categorized by DoPHOT as a star blended with other stars (marked as type=3).
The stars in each of the chunks are combined into the original 2048128 subframes. We cross-reference the stars in the template and other frames with a search radius of 0.5 pixels and derive the local transformation between these pixel coordinate systems for each subframe. We use a first order polynomial to fit the transformation. The resulting piece-wise transformation adequately converts pixel positions to the reference frame of the template. Typical residuals are at the level of pixels for bright stars () and pixels for all stars ().
By using these transformation matrices, we cross-reference the stars in the template and other frames with a search radius of 1.0 pixels instead of 0.5 pixels used in Sumi, Eyer & Woźniak (2003) to increase the range of detectable high proper motion objects. We estimate that the probability of the mis-identification in this search radius is negligible (0.26 %).
We have found that there are systematic differences in the mean positional shifts of stars from the template position and depending on time and pixel coordinate in . We have measured the and of the stars in 81 strips () centered at equal intervals in x coordinate between with a width of pixels. Each strip contains typically stars. In the upper panel of Fig. 1 we show as a function of time for the strip ( pixels) in BUL_SC2. We can see the big jump at JD=2451041 (indicated by a vertical dashed line) where the exposure time of OGLE-II in the GB fields has been changed from 87 sec to 99 sec in the middle of 1998 season, on August 15. In the upper panel of Fig. 2 we show typical mean positional shifts in , of stars in strips in BUL_SC2 as a function of pixel coordinate . The filled and open circles represent the of the frame taken at JD=2450887.822 (before the jump) and 2451336.769 (after the jump), respectively. There are also systematics in with the level of 0.04 pixels. We cannot see any such systematics as a function of pixel coordinate. Because of the good coincidence between the jump and the change in the drift scan rate that determines the effective exposure time, the bulk of the systematics may be caused by the change in drift scan rate. However, we do not know the detail reasons behind this at the present time.
Even within the period before and after the jump, the shapes of Fig. 2 differ from time to time and from field to field at the level of 0.04 pixels. By interpolating these curves of and as a function of for each frame (time) of each field, we correct and for each star and frame. In the lower panel of Fig. 1 and Fig. 2, we show the same plots after this systematic correction. This procedure is based on the assumption that average proper motions of a large number of stars in separate groups of columns (i.e. different values of X) should be the same. Note that the integral of the curves shown in Fig. 2 over all x-columns is unity, as this corresponds to the average position of all stars.


An example of time dependence of the position for a star with a moderate detectable proper motion is shown in Fig. 3 with filled circles. To measure the proper motions in right ascension () and in declination (), we fit the positions as a function of time with the following formula:
| (1) |
| (2) |
where is the coefficient of differential refraction, is the zenith angle, and is the angle between the line joining the star and Zenith and the line joining the star with the South Pole, and and are constants. The parameter is a function of the apparent star colour. We neglect the parallactic motion due to the Earth’s orbit because its effect is strongly degenerate with the effect of differential refraction for stars in the direction of the GB (Eyer & Woźniak 2001).
In Fig. 3 we present with solid lines and open circles the best fit model for the proper motion and positions allowing for the differential refraction respectively. As is written in this figure, the parameters for this object are: field SC5-1-6, which means that this object is in the OGLE-II field BUL_SC5, and chunk ()=(1, 6), OGLE ID=5935, , , the number of data points , proper motion (mas yr-1) with 1 errors in brackets. The differential refraction coefficient is mas.

We computed , , , and for all stars used to transform coordinate systems (approximately the number of fields times the number of chunks times the typical number of stars per chunk, i.e. 49 256 400). In cases where the star is measured in the overlap region of more than one chunk of a given field, the data set with the largest number of points is selected. Stars with the fewer than 20 data points are rejected. The catalogue of whole BUL_SC1 was recomputed in this analysis because the catalogue presented by Sumi, Eyer & Woźniak (2003) contains only 70 % of this field.
Our catalogue contains 5,080,236 stars, which is 79.8 % of all objects with mag in the original OGLE template (Udalski et al. 2002). 7% of these stars do not have any -band photmetry. The missing -band photometry of stars can be estimated from the differential refraction coefficient because there is good correlation between the differential refraction coefficient and the apparent colour for stars (see Fig. 8), provided they belong to the same population as that of the majority.
We have measured the mean proper motions of stars in the Galactic bulge (GB) defined in the ellipse in the Colour Magnitude Diagram (CMD) in Fig. 4, where the extinction and reddening are corrected by using the extinction map of Sumi (2003). The ellipse is located at the center of the RCGs estimated in Sumi (2003) plus 0.4 mag in and have semi-major and minor axises of 0.9 mag and 0.4 mag, respectively. This ellipse includes RCGs and Red Giants in the GB. Here we chose only objects whose proper motion accuracy is better than 2.5 mas yr-1. These mean proper motions of stars in the GB are assumed to be constant within each field. In Fig. 5 we show these measured mean proper motions of stars in the GB as a function of (upper panel) and after the systematic correction (lower panel). We can see how well the systematic distortions are corrected. Note that our instrumental reference frame is defined by all stars, and this is why the average proper motion of stars in the GB are not zero.


4 High proper motion objects
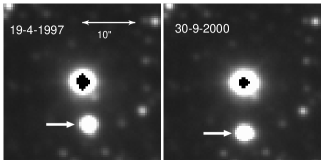
The detectability of high proper motions is limited by the search radius used for cross – identification of stars on all images. The search radius, 1 pix yr-1, corresponds to mas yr-1. Objects with mas yr-1 cannot be identified over the full four year long observing interval of OGLE-II, as they move out of the search radius. In order to be able to follow fast moving stars over four observing seasons we made additional astrometry for objects for which preliminary estimates gave a proper motion mas yr-1. Whenever a star moved more than 0.4 pixels from the previous search center we moved that center to the median location of the last 3 data points. This procedure was adopted when it allowed us to locate the star in a larger number of CCD images.
We show the positional movement of one of the highest proper motion objects in Fig. 6 and images at 1997 and at 2000 in Fig. 7. This star has relatively fewer data points because this star is overexposed on the good seeing frames in the -band. This star dose not have any -band measurements because of the failure of cross-identification in the -band template image due to its high proper motion. -band measurements of such objects may also be unreliable because the OGLE photometric maps are based on the measurements by the ”fixed position mode” over years (Udalski et al. 2002). The photometries of this star obtained by hand relative to the neighboring stars are: , . This colour is very red as expected from the relation between differential refraction coefficient from the fit and colour in Fig.8, but its and do not match the relation exactly.
The relation between and for BUL_SC42 in which the extinctions are relatively small, is slightly different from that for BUL_SC5 plotted in Fig. 8. The zero-point of is 15 mas higher than that for BUL_SC5, but the expected colour of this star from this relation is still redder (). In these figures the slopes differ between fields for the region . This is because of the difference of the population. In BUL_SC5, the majority in this colour region are RCGs and Red Giant Branch stars, but Red Super Giants in BUL_SC42. So this disagreement might be because this object is a nearby very red dwarf of M4-5 spectral type, not typical for this catalogue.

5 Catalogue
A sample for our catalogue of proper motions is shown in Table 2. The complete list of all 5,080,236 stars is available in electronic format via anonymous ftp from the server ftp://ftp.astrouw.edu.pl/ogle/ogle2/proper_motion/ and ftp://bulge.princeton.edu/ogle/ogle2/proper_motion/. The list contains star ID, the number and and in galactic coordinate and with their errors, differential refraction coefficient , standard deviation (Sdev) of data points in the fitting, equatorial coordinates , in 2000, apparent -band magnitude and colour, pixel coordinates on CCD and , and position of chunk and to which this object belongs. ID, 2000 coordinates, and for each object are identical to those in Udalski et al. (2002). If the object doesn’t have -band photometry the colour is written as 9.999.
Note that the number of data points differs from star to star even if they have similar brightness. This is because some are near the edge of the CCD image or CCD defects, and others are affected by blending. We use the positions which are categorized as a single isolated star by DoPHOT. Hence, blended stars can not be measured when the seeing is poor.
Sample of proper motion catalogue for BUL_SC2.
| ID | N | Sdev | |||||||||||||||||
|---|---|---|---|---|---|---|---|---|---|---|---|---|---|---|---|---|---|---|---|
| (mas yr-1) | (mas) | (deg) | (deg.) | (mag) | (pixel) | ||||||||||||||
| 13213 | 203 | 2.96 | 0.90 | -0.44 | 0.63 | 1.06 | 0.70 | -2.80 | 0.84 | 0.69 | 13.02 | 270.99213 | -29.24292 | 15.282 | 1.522 | 62.52 | 904.72 | 1 | 7 |
| 13214 | 258 | 1.09 | 0.66 | -2.03 | 0.41 | -1.24 | 0.48 | -1.94 | 0.61 | -0.88 | 10.16 | 271.03837 | -29.24297 | 15.507 | 1.716 | 413.60 | 904.92 | 1 | 8 |
| 13215 | 255 | -1.71 | 0.68 | -4.75 | 1.01 | -4.98 | 0.94 | -0.82 | 0.77 | 1.18 | 16.10 | 271.04729 | -29.24297 | 15.572 | 1.599 | 481.45 | 904.94 | 1 | 7 |
| 13216 | 247 | -0.11 | 0.67 | -1.46 | 0.51 | -1.33 | 0.55 | -0.62 | 0.64 | -0.57 | 10.95 | 271.00104 | -29.24281 | 15.635 | 1.990 | 130.10 | 905.70 | 1 | 7 |
| 13217 | 250 | -3.44 | 0.83 | -0.74 | 0.76 | -2.32 | 0.78 | 2.64 | 0.81 | -2.72 | 14.72 | 271.00654 | -29.24286 | 15.768 | 1.746 | 171.88 | 905.41 | 1 | 7 |
| 13218 | 264 | 1.49 | 1.01 | -0.30 | 0.66 | 0.46 | 0.76 | -1.45 | 0.94 | -3.97 | 16.19 | 271.04246 | -29.24286 | 14.960 | 1.711 | 444.59 | 905.97 | 1 | 8 |
| 13219 | 263 | -3.31 | 0.91 | -1.75 | 0.39 | -3.14 | 0.56 | 2.04 | 0.82 | -2.80 | 13.20 | 271.02271 | -29.24231 | 15.132 | 1.931 | 294.82 | 910.42 | 1 | 8 |
| 13220 | 247 | -1.11 | 0.78 | -4.67 | 1.41 | -4.62 | 1.29 | -1.31 | 0.97 | 2.30 | 20.88 | 270.99650 | -29.24206 | 15.436 | 1.644 | 95.64 | 912.22 | 1 | 8 |
| 13222 | 262 | -3.98 | 0.55 | -6.50 | 0.50 | -7.62 | 0.51 | 0.31 | 0.54 | 0.29 | 9.87 | 271.01058 | -29.24183 | 15.310 | 1.853 | 202.60 | 914.42 | 1 | 8 |
| 13223 | 245 | 2.25 | 1.11 | -7.76 | 1.14 | -5.68 | 1.13 | -5.75 | 1.12 | 5.67 | 20.22 | 271.04275 | -29.24197 | 15.369 | 1.903 | 446.73 | 913.63 | 1 | 8 |
| 13224 | 189 | -2.72 | 0.87 | 0.31 | 0.64 | -1.06 | 0.70 | 2.53 | 0.82 | -3.43 | 12.55 | 270.99100 | -29.24144 | 15.874 | 1.915 | 53.69 | 917.54 | 1 | 8 |
| 13225 | 131 | 0.83 | 0.88 | -3.41 | 1.01 | -2.57 | 0.98 | -2.39 | 0.91 | 1.48 | 13.38 | 270.98617 | -29.24125 | 15.460 | 1.795 | 17.09 | 919.06 | 1 | 8 |
| 13227 | 248 | 0.32 | 0.53 | -5.23 | 0.68 | -4.41 | 0.65 | -2.83 | 0.57 | 0.41 | 11.08 | 271.03579 | -29.24092 | 15.015 | 1.690 | 394.10 | 922.69 | 1 | 8 |
| 13228 | 262 | 0.45 | 0.60 | 1.12 | 0.62 | 1.20 | 0.62 | 0.15 | 0.61 | 0.31 | 11.51 | 271.00475 | -29.24047 | 15.208 | 1.909 | 158.16 | 926.03 | 1 | 8 |
| 13229 | 245 | -1.94 | 0.92 | -6.90 | 0.98 | -6.97 | 0.97 | -1.67 | 0.93 | 0.10 | 17.20 | 270.99608 | -29.24036 | 15.402 | 1.876 | 92.42 | 926.87 | 1 | 8 |
| 13230 | 264 | 3.89 | 0.57 | 3.85 | 0.60 | 5.26 | 0.59 | -1.52 | 0.58 | -0.14 | 11.09 | 271.02446 | -29.24042 | 15.082 | 1.757 | 307.89 | 926.93 | 1 | 8 |
| 13231 | 249 | 0.82 | 0.76 | -0.58 | 0.68 | -0.11 | 0.70 | -1.00 | 0.74 | -1.17 | 13.26 | 271.03533 | -29.24047 | 15.090 | 1.850 | 390.64 | 926.65 | 1 | 8 |
| 13232 | 200 | 2.53 | 1.72 | 11.04 | 1.50 | 10.87 | 1.56 | 3.17 | 1.67 | 0.86 | 26.09 | 271.00042 | -29.24025 | 15.608 | 1.658 | 125.33 | 928.07 | 1 | 8 |
In Fig. 8 we present a colour – magnitude diagram (CMD) for stars in OGLE field BUL_SC5, which is one of the most reddened OGLE-II fields. We also show the correlation between the differential refraction coefficient and the apparent colour for stars with in this field. This correlation for other fields is similar, but it has a slight dependence on the population of the majority of stars in each field. In Fig. 9, we plot the uncertainties in (, upper panel), in (, middle panel) and difference between them (, lower panel) in BUL_SC3 as a function of the apparent -band magnitude. In the lower panel, where open circles represent mean values for each 1 magnitude bin, we can see that is systematically larger than at mas yr-1 level. We see the same trend in all our fields. This trend is expected from the residual scattering due to the systematic correction and the differential refraction which is large in the direction of . The mean uncertainties with 2 clipping as a function of are listed in Table 1. Note: that the accuracy of proper motions in our catalogue is better than 1 mas yr-1 for .

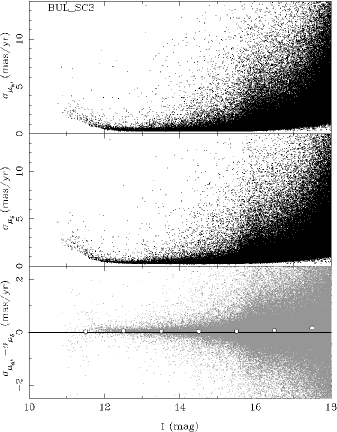
Fig. 10 shows the histogram of our proper motion measurements for the whole catalogue, with the lines with increasing thickness corresponding to all stars, and to those with the proper motion detected with confidence better than , and , respectively. The total number of stars with proper motions measured to , and accuracy is , , , respectively. The inclined solid line: (), has a slope corresponding to the expectation for a uniform distribution and kinematics of stars in space. The distribution of accurate ( and ) proper motions seems to be roughly consistent with the uniform distribution.
However, the number of very high proper motion stars, ( mas yr-1), appears to be smaller than expected from a uniform distribution. This may be due to saturation of images of nearby, and therefore apparently bright, stars in OGLE images.
The distribution of less accurate () proper motions has an apparent cut-off at mas yr-1. Such stars are apparently faint, their positions have large errors, and they may be difficult to identify in a search radius of 1 pixel, which corresponds to mas yr-1.
A more thorough analysis of various selection effects is beyond the scope of this paper. Readers are advised to use caution in a statistical analysis of our catalogue.

6 Zero point
The proper motions in our catalogue are relative values. We need QSOs behind our fields to define the zero point of our proper motions in the inertial frame. However we can get rough information of the zero point of our proper motions by measuring the average proper motion of stars located in the GB, which is presumably close to absolute proper motion of the Galactic Center (GC).
We select stars in the GB defined in Fig. 4. Here we choose only objects whose proper motion accuracy is better than 2.5 mas yr-1. We divide them into bins with a width of mag in -band magnitude and take mean of their proper motions for each bin. We plot these mean proper motions as a function of for BUL_SC2 in Fig. 11. In this figure we can see the streaming motion of bright () and faint () RCGs in . The proper motion of Red Giants () is the same as the average motion of the RCGs, as expected since Red Giants are on average in the GC.
To measure the proper motion of the GC, and in our reference frame, without any bias due to the incompleteness for fainter stars, we take a mean of these without weighting by their errors. This provides an estimate that is more reliable than taking the mean proper motion of all individual stars. The measured and are shown as a solid and dashed line for BUL_SC2 in Fig. 11 and listed for other fields in Table 3 along with those in equatorial coordinates . Table 3 is also available in electronic format via anonymous ftp with the main catalogue (see § 5).

The proper motion measurements in our catalogue can be transformed to the inertial frame by formula;
| (3) | |||||
| (4) |
Here mas yr-1 is the expected proper motion of the GC relative to the inertial frame, assuming a flat rotation curve of km s-1, the distance between the GC and the Sun of kpc (Eisenhauer et al. 2003) and Solar velocity of = (5.25 km s-1, 7.17 km s-1) relative to the Local Standard of Rest (RSL) (Dehnen & Binney 1998). This transformation gives us crude absolute proper motions, while this gives us very good relative zero points from field to field as we show later.
The reader can apply this transformation formula to our catalogue to get value in the inertial frame. We didn’t apply this transformation to our catalog because the transformation to the inertial frame can be improved with the QSOs to be discovered behind our fields in the future.
| field | |||||||||
|---|---|---|---|---|---|---|---|---|---|
| (mas yr-1) | |||||||||
| BUL_SC1 | 23938 | -0.57 | 0.07 | -0.55 | 0.11 | -0.76 | 0.12 | 0.23 | 0.04 |
| BUL_SC2 | 25738 | -0.61 | 0.05 | -0.64 | 0.09 | -0.86 | 0.10 | 0.22 | 0.02 |
| BUL_SC3 | 43597 | -0.66 | 0.05 | -0.68 | 0.08 | -0.92 | 0.09 | 0.22 | 0.02 |
| BUL_SC4 | 42847 | -0.57 | 0.06 | -0.62 | 0.10 | -0.82 | 0.11 | 0.18 | 0.04 |
| BUL_SC5 | 12704 | -0.72 | 0.08 | -0.94 | 0.12 | -1.18 | 0.14 | 0.14 | 0.05 |
| BUL_SC6 | 10167 | -0.61 | 0.05 | -0.80 | 0.08 | -0.99 | 0.09 | 0.15 | 0.03 |
| BUL_SC7 | 9431 | -0.55 | 0.06 | -0.68 | 0.10 | -0.86 | 0.11 | 0.16 | 0.03 |
| BUL_SC8 | 7397 | -0.98 | 0.05 | -0.97 | 0.08 | -1.31 | 0.09 | 0.41 | 0.04 |
| BUL_SC9 | 7364 | -0.85 | 0.05 | -1.02 | 0.08 | -1.30 | 0.09 | 0.28 | 0.03 |
| BUL_SC10 | 8476 | -0.84 | 0.06 | -0.98 | 0.11 | -1.26 | 0.12 | 0.28 | 0.03 |
| BUL_SC11 | 8067 | -0.80 | 0.06 | -1.03 | 0.10 | -1.28 | 0.11 | 0.23 | 0.03 |
| BUL_SC12 | 9913 | -0.95 | 0.05 | -1.33 | 0.08 | -1.62 | 0.09 | 0.20 | 0.03 |
| BUL_SC13 | 9899 | -0.84 | 0.06 | -1.13 | 0.10 | -1.39 | 0.11 | 0.20 | 0.03 |
| BUL_SC14 | 19398 | -0.57 | 0.05 | -0.70 | 0.08 | -0.89 | 0.10 | 0.12 | 0.01 |
| BUL_SC15 | 16454 | -0.53 | 0.05 | -0.79 | 0.08 | -0.95 | 0.09 | 0.04 | 0.03 |
| BUL_SC16 | 15801 | -0.71 | 0.06 | -1.00 | 0.09 | -1.22 | 0.10 | 0.15 | 0.04 |
| BUL_SC17 | 16665 | -0.68 | 0.05 | -0.97 | 0.07 | -1.18 | 0.08 | 0.13 | 0.04 |
| BUL_SC18 | 23064 | -0.60 | 0.05 | -0.73 | 0.09 | -0.93 | 0.10 | 0.17 | 0.02 |
| BUL_SC19 | 21441 | -0.60 | 0.05 | -0.77 | 0.08 | -0.96 | 0.09 | 0.16 | 0.02 |
| BUL_SC20 | 31933 | -0.42 | 0.06 | -0.61 | 0.10 | -0.74 | 0.11 | 0.06 | 0.04 |
| BUL_SC21 | 30486 | -0.55 | 0.06 | -0.71 | 0.09 | -0.89 | 0.11 | 0.13 | 0.03 |
| BUL_SC22 | 31278 | -0.57 | 0.05 | -0.60 | 0.08 | -0.80 | 0.10 | 0.20 | 0.02 |
| BUL_SC23 | 27679 | -0.59 | 0.06 | -0.70 | 0.10 | -0.91 | 0.11 | 0.16 | 0.02 |
| BUL_SC24 | 27355 | -0.55 | 0.06 | -0.59 | 0.08 | -0.79 | 0.09 | 0.18 | 0.03 |
| BUL_SC25 | 25782 | -0.52 | 0.05 | -0.66 | 0.09 | -0.83 | 0.10 | 0.12 | 0.02 |
| BUL_SC26 | 21577 | -0.62 | 0.05 | -0.66 | 0.07 | -0.88 | 0.08 | 0.19 | 0.02 |
| BUL_SC27 | 20250 | -0.60 | 0.04 | -0.72 | 0.07 | -0.92 | 0.08 | 0.15 | 0.02 |
| BUL_SC28 | 12159 | -0.73 | 0.05 | -0.78 | 0.07 | -1.04 | 0.07 | 0.22 | 0.04 |
| BUL_SC29 | 11755 | -0.75 | 0.04 | -0.78 | 0.05 | -1.06 | 0.06 | 0.24 | 0.02 |
| BUL_SC30 | 29140 | -0.54 | 0.05 | -0.64 | 0.08 | -0.82 | 0.10 | 0.15 | 0.03 |
| BUL_SC31 | 28389 | -0.44 | 0.06 | -0.67 | 0.10 | -0.80 | 0.11 | 0.06 | 0.03 |
| BUL_SC32 | 25750 | -0.53 | 0.06 | -0.65 | 0.09 | -0.82 | 0.10 | 0.15 | 0.03 |
| BUL_SC33 | 23709 | -0.61 | 0.06 | -0.69 | 0.10 | -0.90 | 0.12 | 0.20 | 0.02 |
| BUL_SC34 | 32041 | -0.53 | 0.06 | -0.59 | 0.09 | -0.78 | 0.11 | 0.17 | 0.03 |
| BUL_SC35 | 25997 | -0.56 | 0.05 | -0.66 | 0.09 | -0.85 | 0.10 | 0.17 | 0.03 |
| BUL_SC36 | 24278 | -0.59 | 0.05 | -0.64 | 0.08 | -0.85 | 0.10 | 0.21 | 0.02 |
| BUL_SC37 | 38711 | -0.68 | 0.06 | -0.75 | 0.09 | -0.99 | 0.10 | 0.20 | 0.03 |
| BUL_SC38 | 25633 | -0.46 | 0.06 | -0.64 | 0.10 | -0.79 | 0.12 | 0.08 | 0.03 |
| BUL_SC39 | 41129 | -0.47 | 0.06 | -0.64 | 0.11 | -0.79 | 0.12 | 0.08 | 0.02 |
| BUL_SC40 | 25729 | -0.52 | 0.05 | -0.57 | 0.08 | -0.76 | 0.10 | 0.16 | 0.02 |
| BUL_SC41 | 25665 | -0.50 | 0.05 | -0.56 | 0.07 | -0.74 | 0.08 | 0.15 | 0.03 |
| BUL_SC42 | 18649 | -0.79 | 0.06 | -0.88 | 0.10 | -1.15 | 0.11 | 0.26 | 0.04 |
| BUL_SC43 | 25012 | -0.36 | 0.07 | -0.36 | 0.11 | -0.50 | 0.13 | 0.11 | 0.03 |
| BUL_SC44 | – | – | – | – | – | – | – | – | – |
| BUL_SC45 | 13776 | -0.43 | 0.08 | -0.32 | 0.14 | -0.49 | 0.15 | 0.22 | 0.03 |
| BUL_SC46 | 12608 | -0.40 | 0.08 | -0.23 | 0.14 | -0.40 | 0.16 | 0.24 | 0.04 |
| BUL_SC47 | 6294 | -1.18 | 0.07 | -1.20 | 0.10 | -1.65 | 0.12 | 0.31 | 0.03 |
| BUL_SC48 | 6965 | -1.09 | 0.06 | -1.00 | 0.08 | -1.44 | 0.10 | 0.35 | 0.03 |
| BUL_SC49 | 6299 | -0.99 | 0.06 | -0.86 | 0.08 | -1.26 | 0.09 | 0.35 | 0.04 |
To check our measurements we cross-identified stars in our catalogue with the Tycho-2 catalogue (Høg et al. 2000). We selected from our catalogue objects with proper motions higher than 10 mas yr-1 and measured with a significance above 3, to avoid mis-identification. Most high proper motion stars in Tycho-2 are saturated in OGLE images. We found 65 Tycho-2 stars in our catalogue and their proper motions: (thin) and (thick) are presented in Fig. 12. Here OGLE proper motions have been transformed into the inertial frame by equations (3) and (4). We can see a very good correlation between OGLE and Tycho-2 measurements. Dashed lines indicate , and solid lines represent best fit with fixed unit slope and a possible offset. A good correspondence between Tycho-2 and OGLE-II proper motions gives us certain confidence in our measurements. Slightly larger offsets in imply that the error in absolute proper motion is at a level of 1 mas yr-1, which can be improved by using QSOs in the near future.
We also compared the measurements in BUL_SC1 made by Sumi, Eyer & Woźniak 2003 (hereafter SC1′) with the proper motions presented in this paper, for which our measurements are above the level of accuracy. The two sets of proper motions for 1368 cross-identified stars are shown in Fig. 13 together with the best fit line. The offset between the two sets, and the differences between individual measurements are within estimated errors. Note: the scale is different than in Fig. 12. Large reduced chi square in are because Sumi, Eyer & Woźniak 2003 didn’t correct systematic distortions (see §3), though their systematic distortions have been reduced at a level of 2 mas yr-1 by dividing images into small chunks.
We compared the measurements done by us in one of the overlap regions: between fields BUL_SC1 and BUL_SC45. The proper motions of 115 cross-identified stars, and the best fit with a small offset between zero points, are presented in Fig. 14. Here proper motions have been transformed into the inertial frame by equations (3) and (4). Good correlations between them with a rather small zero point offsets: mas yr-1 and mas yr-1 gives us certain confidence in our measurements and in equations (3) and (4) in terms of the relative the zero point. The scatter is also consistent with the estimated errors.


7 Possible problems
There can be various problems associated with proper motions of variable stars. Our fields are very crowded, hence many stars may be blended. In the case of blending we measure an average position of a blend of several stars within a seeing disk. If a variable star is blended with other stars which have slightly different positions within a seeing disk, the average position of the blended image may change while one component of the blend varies. This change might mimic a proper motion.
As an example we present the time variation of the position of a very long timescale microlensing event candidate (Smith 2003) in the top panel of Fig. 15. The -band light curve of this event is shown in the bottom panel of Fig. 15 (ID=2859 in variable star catalogue of Woźniak et al. 2002). In the top panel we can see an apparent proper motion in the first year which is coincident with the apparent brightness fading, as shown in the bottom panel. After the second year the proper motion seems to be small, and the position data points are sparse, which coincides with the low brightness of the star and may reflect the presence of a blend – in poor seeing DoPHOT cannot resolve the two stars, hence there are very few data points in the upper panel. The blend was actually found in the higher resolution OGLE-III images in 2002.
A plausible interpretation is that the microlensed star was brighter than the nearby faint ‘companion’ star in 1997, but by 2000 it became the fainter of the two. The position of the ‘companion’ is consistent with the direction of the apparent proper motion. The faint stars seem to have low proper motion. High resolution observations are needed to fully understand this object.
As another example we present in Fig. 16 the time variation of the position of a star ID=309705 in the OGLE-II field BUL_SC39. Filled circles represent measured positions with type=1 (used in this work), which were at a fixed location for the first three years but moved significantly in the fourth season. The star ID=309705 identified these centroids at the edge of the search radius (y=-1) for the first 3 seasons and at the center (y=0) in the 4th season. On the other hand, the neighboring star ID=309653 which has a similar brightness of and position of 0.18 pixels East (positive x) and -1.89 pixels South (negative y), identified the same centroids at the edge of the search radius (y=-1).
To see the details of this object, in Fig. 16 we also plot the position measurements which are categorized as a star blended with other stars (type=3, which are not used in this work) by DoPHOT for this star (crosses) and for a neighboring star ID=309653 (dots), which are shifted by +0.18 pixels in x and -1.89 pixels in y, i.e. these dots are as they are on the CCD, relative to ID=309705. We can see that these positions (crosses and dots) are identified around y=0 (ID=309705) and -2 (ID=309653), respectively, with filled circles in-between them. We also show the -band light curves of ID=309705 (middle panel) and ID=309653 (bottom panel) in Fig. 16. We can see ID=309705 is constant during four seasons but ID=309653 suddenly faded during the 4th season. This is likely to be a R CrB type variable.
The simplest interpretation is as follows; small number of data points in the seasons 1997-99 indicates that DoPHOT found that object which is composite of these two stars only on the bad seeing frames as a single star with type=1, in other cases they are separated but categorized as blended - type=3. In 2000 when the star ID=309653 faded, the centroid of the composite moved and finally the star ID=309705 became a ”single” star with type=1. So the number of data points is large in 2000.
Proper motions of variable stars may have their errors increased not only because of variable contribution of blending, but also because variable stars may change colours, and therefore the coefficient of differential refraction may also change. In rare cases of very long period variables this may be noticeable. Note: we do not treat this kind of objects in a special way, so a reader must be careful when using our catalogue in studies of variable stars.
The effect of blending changes with seeing may contribute to the scatter of data points, but it is not likely to have a seasonal effect. Hence, we think that seeing variations are not a major problem.
The probability of blending is much larger for fainter stars, in particular those close to mag. This may produce a bias in their proper motions, most likely reducing their formal proper motion, as the blended stars may have a different proper motion vector, so the average value is likely to be reduced. We also do not provide a special treatment for this kind of objects, so a reader must be careful when using our catalogue for faint stars.


8 Discussion and Conclusion
We have measured proper motions for 5,080,236 stars in all 49 OGLE-II GB fields, covering a range of and . Our catalogue contains objects with proper motions up to mas yr-1 and -band magnitudes in the range . The accuracy of proper motions in our catalogue is better than 1 mas yr-1 for .
One should keep in mind that all measurements of presented here are not absolute, but relative to the astrometric reference frame which is roughly that of the Galactic Center (GC) with a small offset seen in the lower panel of Fig. 5. However, as demonstrated in §6, by using the crude estimation for the proper motion of the GC in our reference frame and formula equations (3) and (4), we can obtain crude proper motions in an inertial frame. From the comparison with these inertial values and the Tycho2 catalogue, this transformation seems to work well with errors at a level of 1 mas yr-1. From comparison of measured in the overlap region of fields BUL_SC1 and BUL_SC45 (Fig. 14), this transformation works very well in the relative offset from field to field. These zero points for proper motions can be improved by using background quasars which may be detected in the near future using the OGLE-II variability catalogue (Woźniak et al. 2002; Eyer 2002; Dobrzycki et al. 2003).
As demonstrated by Sumi, Eyer & Woźniak (2003), the proper motions based on OGLE-II data can be used to clearly detect the presence of a strong streaming motion (rotation) of stars in the Galactic bar. While the reference frame established from all stars is not well defined with respect to the inertial frame, the relative motions of groups of stars within a given field are well determined.
Though our primary goal is to constrain the Galactic bar model with the future analysis of our catalogue, we provide proper motions for all stars with mag in all 49 OGLE-II GB fields because this catalogue might be useful for a variety of projects. An analysis of the catalogue is beyond the scope of the present study.
Acknowledgments
We are grateful to B. Paczyński for helpful comments and discussions. We acknowledge M. Smith for carefully reading the manuscript and helpful comments. We are also thankful to the referee, F. van Leeuwen for suggestive comments. T.S. acknowledge the financial support from the Nishina Memorial Foundation and JSPS. The paper was partly supported by the Polish KBN grant 2P03D02124 to A. Udalski. This work was partly supported with the following grants to B. Paczyński: NSF grants AST-9820314 and AST-0204908, and NASA grants NAG5-12212, and grant HST-AR-09518.01A provided by NASA through a grant from the Space Telescope Science Institute, which is operated by the Association of Universities for Research in Astronomy, Inc., under NASA contract NAS5-26555.
References
- Afonso et al. (2003) Afonso, C. et al. 2003, A&A in press, preprint (astro-ph/0303100)
- Alcock et al. (1997) Alcock, C. et al. 1997, ApJ, 486, 697
- Alcock et al. (2000) Alcock, C. et al. 2000a, ApJ, 541, 734
- Aubourg et al. (1993) Aubourg, E. et al. 1993, Nature, 365, 623
- Blitz & Spergel (1991) Blitz, L. & Spergel, D. N. S. 1991, ApJ, 379, 631
- Bond et al. (2001) Bond, I. A. et al. 2001, MNRAS, 327, 868
- de Vaucouleurs (1964) de Vaucouleurs, G. 1964. IAU Symp. 20. The Galaxy and the Magellanic Clouds, ed. F. J. Kerr & A. W. Rogers (Canberra: Australian Acad. Science, MSSSO), 195
- Dehnen & Binney (1998) Dehnen, W. & Binney, J. J. 1998, MNRAS, 298, 387
- Dobrzycki et al. (2003) Dobrzycki, A. et al. 2003, AJ, 125, 1330
- Eisenhauer et al. (2003) Eisenhauer, F., Schoedel, R., Genzel, R., Ott, T., Tecza, M., Abuter, R., Eckart, A. & Alexander, T., 2003, preprint (astro-ph/0306220)
- Eyer & Woźniak (2001) Eyer, L. & Woźniak, P. R. 2001, MNRAS, 327, 601
- Eyer (2002) Eyer, L. 2002, Acta Astronomica, 52, 241
- Gould (1996) Gould, A. 1996, PASP, 108, 465
- Häfner et al. (2000) Häfner, R. et al. 2000, MNRAS, 314, 433
- Høg et al. (2000) Høg et al. 2000, A&A, 355, L27
- Kiraga & Paczyński (1994) Kiraga, M., & Paczyński, B. 1994, ApJ, 430, L101
- Kuijken & Rich (2002) Kuijken, K. & Rich, R. M. 2002, AJ, 124, 2054
- Mao & Paczyński (2002) Mao, S. & Paczyński, B. 2002, preprint (astro-ph/0207131)
- Monet et al. (2002) Monet, D. et al. 2002, preprint (astro-ph/0210694)
- Paczyński (1996) Paczyński, B. 1996, ARA&A, 34, 419
- Paczyński & Stanek (1998) Paczyński, B. & Stanek, K. Z. 1998, ApJ, 494, L219
- Popowski et al (2003) Popowski, P. 2003, Invited Review, to appear in ”Gravitational Lensing: A Unique Tool For Cosmology”, Aussois 2003, eds. D. Valls-Gabaud & J.-P. Kneib (astro-ph/0304464)
- Salim & Gould (2003) Salim, S. & Gould, A. 2003, ApJ, 582, 1011
- Schechter, Mateo & Saha (1993) Schechter, L., Mateo, M., & Saha, A. 1993, PASP, 105, 1342S
- Smith (2003) Smith, M. C., 2003, MNRAS, 343, 1172
- Spaenhauer, Jones & Whitford (1992) Spaenhauer, A., Jones, B. F. & Whitford, A. E. 1992, AJ, 103, 297
- Stanek (1996) Stanek, K. Z. 1996, ApJ, 460, 37L
- Stanek et al. (1994) Stanek, K. Z. et al. 1994, ApJ, 429, L73
- Stanek et al. (1997) Stanek, K. Z. et al. 1997, ApJ, 477, 163
- Stanek et al. (2000) Stanek, K. Z. et al. 2000, Acta Astronomica, 50, 191
- Sumi, Eyer & Woźniak (2003) Sumi, T., Eyer, L & Woźniak, P. R. 2003, MNRAS , 340, 1346
- Sumi et al. (2003) Sumi, T. et al. 2003, ApJ, 591, 204
- Sumi (2003) Sumi, T. 2003, preprint (astro-ph/0309206)
- Udalski et al. (1993) Udalski, A. et al. 1993, Acta. Astron., 43, 289
- Udalski et al. (1994) Udalski, A. et al. 1994, Acta Astronomica, 44, 165
- Udalski et al. (2000) Udalski, A. et al. 2000, Acta Astronomica, 50, 1
- Udalski et al. (2002) Udalski, A. et al. 2002, Acta Astronomica, 52, 217
- Udalski, Kubiak & Szymański (1997) Udalski, A., Kubiak, M., & Szymański, M. 1997, Acta Astronomica, 74, 319
- Woźniak et al. (2001) Woźniak, P. R., et al. 2001, Acta Astronomica, 51, 175
- Woźniak et al. (2002) Woźniak, P. R., et al. 2002, Acta Astronomica, 52, 129