The PDS vs. Markarian starburst galaxies: comparing strong and weak IRAS emitter at 12m and 25m in the nearby universe.
Abstract
The characteristics of the starburst galaxies from the Pico dos Dias survey (PDS) are compared with those of the nearby UV-bright Markarian starburst galaxies, having the same limit in redshift ( km s-1) and absolute magnitude (). An important difference is found: the Markarian galaxies are generally undetected at 12m and 25m in IRAS. This is consistent with the UV excess shown by these galaxies and suggests that the youngest star forming regions dominating these galaxies are relatively free of dust.
The FIR selection criteria for the PDS is shown to introduce a strong bias towards massive (luminous) and large size late-type spiral galaxies. This is contrary to the Markarian galaxies, which are found to be remarkably rich in smaller size early-type galaxies. These results suggest that only late-type spirals with a large and massive disk are strong emitter at 12m and 25m in IRAS in the nearby universe.
The Markarian and PDS starburst galaxies are shown to share the same environment. This rules out an explanation of the differences observed in terms of external parameters. These differences may be explained by assuming two different levels of evolution, the Markarian being less evolved than the PDS galaxies. This interpretation is fully consistent with the disk formation hypothesis proposed in Coziol et al. (2000) to explain the special properties of the Markarian SBNG.
keywords:
galaxies: starburst – galaxies: evolution – galaxies: formation1 Introduction
What is the origin of the nuclear star burst observed in many nearby massive galaxies? Theoretically, interaction of galaxies was shown to be one of the most efficient ways by which to fuel gas in the center of a galaxy and start a burst of star formation (Barns & Hernquist 1996; Mihos & Hernquist 1996). From the point of view of observation, however, such scenario seems to fit only a fraction of the starburst galaxies in the nearby universe. In the Markarian sample, for example, Keel & Van Soest (1992) have found that only 35% of the galaxies could be interacting with a nearby companion. A comparable fraction of non-isolated galaxies (24%) was found in the MBG survey (Coziol et al. 1997). The rapid and short duration burst predicted by many interaction models seems also in contradiction with the relatively long period of star formation observed in most starburst galaxies (Coziol 1996; Goldader et al. 1997; Coziol, Doyon & Demers 2001). These observations suggest that other mechanisms, internal to the galaxies, must play a role in triggering or regulating star formation in these systems.
The effect of a bar structure was frequently proposed as a possible burst mechanism. Theoretically, the bar was shown to be capable of funnelling gas in the center of a galaxy and start a nuclear burst. This hypothesis was recently tested by Considère et al. (2000) on a sample of 16 strongly barred Markarian starburst nucleus galaxies (SBNG). The study of the oxygen and nitrogen gradients in these galaxies proved to be incompatible with the expected effect of a bar. Instead, evidence was found that the bars appeared only recently as compared to the possible ages of the bursts. In an accompanying paper, Coziol et al. (2000), it was shown that this phenomenon is typical of the whole Markarian SBNG sample. Taken at face value, these observations suggest that a large fraction of the Markarian galaxies may now be forming a disk.
It would be highly significant to know if the characteristics of the Markarian SBNG, as reported in Coziol et al (2000), are typical of all massive starburst galaxies in the nearby universe. Having previously defined a new sample of such objects, the Pico Dos Dias (PDS) starburst galaxies (Coziol et al 1998a), a comparison of their characteristics with those of the Markarian SBNG seemed, therefore, like the next logical step.
The plan of the article is the following. Section 2 explains the selection criteria used to define the two samples. The different particularities in the Far-Infrared (FIR) and the physical characteristics that are compared are also presented and discussed in this section. The comparison of the two samples, supported by a statistical analysis, takes place in Section 3. This is followed, in Section 4, by a discussion on the possible causes of the differences observed. The consequences of these differences for the nature of the starburst phenomenon in nearby massive galaxies and for galaxies at higher redshift are also discussed in this section. A brief conclusion is presented in section 5, followed by an appendix explaining in detail the results of the statistical tests used for this analysis.
2 Description of the two samples
2.1 Selection criteria and source of the data
The main characteristics of the PDS starburst galaxies were already presented and discussed in Coziol et al. (1998a). This sample consists of 200 galaxies, selected from the IRAS Point Source Catalog using the following FIR criteria: 1) all the galaxies have high or intermediate quality flux density at 12m, 25m, 60m and 100m; 2) they have an infrared spectral index in the range and an infrared spectral index in the range (where , and is the flux in Janskys at wavelength ). In Coziol et al. (1998a) it was shown that these criteria allow distinguishing starburst from AGN galaxies with a confidence level approaching 99%.
The PDS starburst galaxies were found to be relatively luminous (M). The fact that the FIR criteria introduce a strong bias against dwarf starburst galaxies (HII galaxies) is not surprising, considering the low metallicity and dust content of these galaxies (Salzer, MacAlpine & Gordon 1988).
The physical parameters that are considered in this article were all taken from the same source: the Lyon Meudon Extragalactic Database (LEDA). In LEDA, raw data, having a different origin, are homogenized, using specific rules, to form a uniform catalogue(LEDA is the basis of the RC3 catalogue of galaxies). A complete description of the normalization process used in LEDA can be found in de Vaucouleurs et al. (1991) and Paturel et al. (1997). Keeping only galaxies for which complete information (except for kinematics) is available in LEDA reduces the number of PDS starburst galaxies to 168.
The comparison sample of Markarian SBNG is composed of all the galaxies with M, having, like for the PDS, information in LEDA. This yields a sample of 505 galaxies. Comparing the redshift of these galaxies with those of the PDS in Figure 1, it is obvious that the Markarian are located at higher redshift. To eliminate the effects of Malmquist bias, a limit on the distance must be applied. For comparison, therefore, only galaxies which are nearer than 7500 km s-1 are kept in the two samples (this corresponds to 100 Mpc, adopting H km s-1 Mpc-1). This limit was chosen in order to exclude the smallest number of PDS galaxies, while keeping the largest number of Markarian galaxies. This reduce the final PDS and Markarian samples to 154 galaxies and 325 galaxies respectively.

| IRAS | MB | Morph. | T | vh | log(D25) | log(Vmax) | isolated | |
|---|---|---|---|---|---|---|---|---|
| (km s-1) | (0.1 arcmin) | (mag arsec-2) | (km s-1) | |||||
| 00013+2028 | -20.8 | Sbc | 4.1 | 2308.03 | 1.54 | 23.37 | 2.23 | yes |
| 00022-6220 | -20.2 | SBbc | 3.9 | 4539.00 | 1.05 | 22.82 | yes | |
| 00073+2538 | -21.5 | SBa | 1.2 | 4564.64 | 1.29 | 22.93 | 2.45 | no |
| 00345-2945 | -20.1 | S0/a | 0.3 | 3564.14 | 1.19 | 23.09 | 2.02 | yes |
| 01053-1746 | -20.8 | Irr | 10.0 | 6077.20 | 0.84 | 21.84 | 2.32 | yes |
The complete table is available in the electronic issue of the journal. A digital version is also available on demand to the author.
| Mrk # | MB | Morph. | T | vh | log(D25) | log(Vmax) | isolated | |
|---|---|---|---|---|---|---|---|---|
| (km s-1) | (0.1 arcmin) | (mag arsec-2) | (km s-1) | |||||
| Mrk0002 | -20.6 | SBa | 0.6 | 5543.45 | 0.85 | 22.06 | 2.25 | no |
| Mrk0004 | -20.6 | SBc | 6.0 | 5258.60 | 1.28 | 24.14 | 2.11 | yes |
| Mrk0007 | -19.9 | Sd | 7.8 | 3063.23 | 0.94 | 22.01 | 2.01 | yes |
| Mrk0008 | -20.1 | Sbc | 4.1 | 3602.21 | 0.97 | 22.30 | 2.07 | no |
| Mrk0011 | -19.8 | E/S0 | -3.0 | 3909.15 | 0.96 | 22.69 | no |
The complete table is available in the electronic issue of the journal. A digital version is also available on demand to the author.
2.2 Overlap of the samples: FIR particularity of the Markarian SBNG
Because 72% of the Markarian galaxies were also detected in IRAS, a large overlap between the two samples was therefore expected. However, after comparing the galaxy names in the two samples, only 17 Markarian galaxies (5%) were found to be common to the two samples (this represents only 11% of the PDS galaxies). The reason for such low overlap is easy to understand. It is because most of the Markarian galaxies are undetected at 12m and/or 25m in the IRAS Point Source Catalogue, which is one of the condition to be part of the PDS sample. Since this is an important difference between the two samples, and an unrecognized FIR characteristics for the UV-bright Markarian galaxies, a more thorough investigation seems in order.
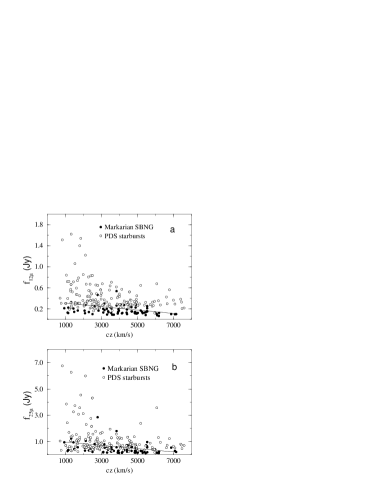
The reason why the Markarian SBNG are not detected at 12m and 25m in the Point Source Catalogue is not obvious. In part, this is due to a lack of sensitivity. Using the IRAS Faint Source Catalogue instead of the Point Source Catalogue, for instance, increases to 29% the fraction of Markarian SBNG detected in the four bands. However, it still leaves most of the galaxies (71%) as either undetected in one (33%) or all (38%) of the four IRAS bands (see Table 5 in Bicay et al. 1995).
Comparing the 12m and 25m fluxes of the galaxies detected in the Faint Source Catalogue in figure 2, it can be seen that the level of flux at these two wavebands is significantly lower in the Markarian galaxies. The continuous lines are linear regressions on the Markarian flux values. The slope of these regressions go contrary to what is expected for an observational bias, which suggests that we are still far from the observational limits. The low detection at 12m and 25m looks, therefore, as a physical trait of these galaxies: the Markarian SBNG are generally weak FIR emitter at 12m and 25m.
In a sense, the above particularity may be the only one consistent with the UV-brightness of these galaxies. The presence of a UV excess implies that a high number of young star forming regions present in these galaxies are relatively free of dust. If these young and dusty free star forming regions dominate over heavily dusty ones, then the Markarian are not expected to be particularly bright at 12m and 25m, since only these young star forming regions can heat dust sufficiently to be visible at these two wavelengths. The lower detection rate of the Markarian SBNG at 12m and 25m in IRAS marks, therefore, an intrinsic difference between the two samples: galaxies in the Markarian sample are either less dusty or less homogeneously covered in dust than galaxies in the PDS sample.
This new characteristic of the Markarian SBNG is quite important. It suggests that UV-bright and FIR bright selected samples may differ also in other important manners. This is what this analysis will now determine.
For comparison sake, the 17 galaxies common to the two samples will be erased from the Markarian sample and considered as part of the PDS sample only. Table 1 lists the characteristics of the 154 PDS starburst galaxies as found in LEDA: column 1 gives the IRAS name, followed by the absolute magnitude in B, column 2, the morphology and morphological index, , column 3 and 4, the mean heliocentric redshift, column 5, the logarithm of the apparent corrected diameter, , column 6, the surface brightness, column 7, and the logarithm of the maximum rotation velocity, column 8. The last column indicates if the galaxy is considered to be isolated (see section 3.2). Similar characteristics for the Markarian SBNG are listed in Table 2.
3 Comparison of the samples
3.1 Differences in mean values
| PDS | PDS | Mrk | Mrk | |
| unbarred | barred | unbarred | barred | |
| N | 83 | 71 | 247 | 61 |
| v | 3618 | 2834 | 4824 | 4129 |
| std Dev. | 1746 | 1406 | 1522 | 1659 |
| M | -20.27 | -20.54 | -19.65 | -20.15 |
| std Dev. | 1.04 | 0.80 | 0.80 | 0.82 |
| 23.01 | 23.11 | 22.99 | 22.94 | |
| std Dev. | 0.59 | 0.47 | 0.69 | 0.67 |
| T | 2.7 | 3.4 | 1.4 | 3.7 |
| std Dev. | 2.9 | 1.5 | 3.7 | 2.1 |
| log D | 22.47 | 25.33 | 17.18 | 20.64 |
| std Dev. | 10.38 | 11.49 | 7.74 | 7.53 |
| 74% | 87% | 35% | 74% | |
| log V | 2.23 | 2.21 | 2.16 | 2.14 |
| std Dev. | 0.20 | 0.15 | 0.87 | 0.18 |
is the fraction of galaxies with kinematics information in LEDA.
The mean values for the physical parameters compared are presented in Table 3. Since the presence or absence of a bar was shown to be of importance in Coziol et al. (2000), the mean values were estimated by making this distinction in each sample.
In order to evaluate if the mean values are significantly different statistically, one-way ANOVA tests are run on all the samples. The kind of test applied (parametric or non-parametric) is determined by verifying if the samples have normal distribution. Once a significant difference is observed, the usual post-tests are performed in order to determine the origin and nature of this difference. Complete explanations for the tests, their interpretations and the results are presented in the appendix.
Except for the surface brightness, , all the other parameters were found to be significantly different, at a confidence level of 99%. The following is a summary of what Table 3 and the statistical post-tests (Tables A2) reveal.
For the blue absolute magnitude, MB, the unbarred Markarian SBNG are found to be less luminous than the other galaxies. The barred Markarian SBNG are also found to be marginally less luminous than the PDS barred starburst galaxies.
For the morphology index, T, the unbarred Markarian SBNG are found to be more numerous in early-type galaxies than all the other galaxies, the difference being more pronounced compared to the barred galaxies (Markarian and PDS). From table 3, one can note also a large fraction of unbarred galaxies in the Markarian sample (80% compared to 46% in the PDS sample).
For the velocity recession, vh, it is found that the Markarian SBNG, barred and unbarred, are located at higher redshift than the PDS starburst galaxies. In both samples the unbarred galaxies seem also to be marginally farther away than the unbarred ones.
For the dimension of the galaxies, D25, the unbarred Markarian SBNG are found to be smaller in size. A marginal difference between the Markarian barred and PDS barred is also observed, the former being slightly smaller than the latter. The statistical results found for the size of the galaxies are similar to the one observed for the luminosity.
Although the information about rotational velocity is still incomplete (see Vmax) in Table 3), the statistical tests suggest that the unbarred Markarian SBNG have smaller maximum velocity rotation than the other galaxies. The results are consistent with the size differences observed between the samples.
| Barred | Unbarred | Total | |
|---|---|---|---|
| PDS starburst | 34% | 34% | 34% |
| Markarian SBNG | 39% | 34% | 35% |
| PDS | PDS | Mrk | Mrk | |
| isolated | pair/gr. | isolated | pair/gr. | |
| N | 102 | 52 | 201 | 107 |
| v | 3256 | 3258 | 4728 | 4606 |
| std Dev. | 1598 | 1737 | 1566 | 1589 |
| M | -20.38 | -20.42 | -19.71 | -19.82 |
| std Dev. | 1.00 | 0.90 | 0.81 | 0.85 |
| 23.03 | 23.09 | 23.04 | 22.88 | |
| std Dev. | 0.54 | 0.52 | 0.66 | 0.72 |
| T | 2.9 | 3.4 | 1.9 | 1.8 |
| std Dev. | 2.6 | 1.9 | 3.6 | 3.6 |
| log D | 23.08 | 25.18 | 18.02 | 17.57 |
| std Dev. | 9.90 | 12.79 | 7.88 | 7.69 |
| 76% | 86% | 43% | 42% | |
| log V | 2.22 | 2.22 | 2.07 | 2.31 |
| std Dev. | 0.17 | 0.18 | 0.20 | 1.19 |
is the fraction of galaxies with kinematics information in the sample.
3.2 Difference of environment
Because the environment of a galaxy may have some influence on its evolution, it seems important to check if the two samples show any difference on this matter. One way to do this is to compare the fraction of galaxies in pair or group in the two samples.
Since LEDA does not give information on the environment of galaxies, NED (the NASA/IPAC Extragalactic Database) was used to search for the presence of companion galaxies in the close environment of all the galaxies in the samples. The method followed is identical to the one used by Campos-Aguilar & Moles (1991) and more recently Noeske et al. (2001). A galaxy is considered to be non isolated when an objects is found within a projected separation Mpc and its difference in velocity is km s-1. The angular search radius was done using the mean heliocentric redshift as found in LEDA.
The fraction of galaxies in pair or group is presented in Table 4. The same tendency is found for the PDS starburst galaxies and Markarian SBNG. No significant relation is noted between the environment and the presence of a bar.
The mean characteristics of the samples separated based on the isolation criteria are presented in Table 5. The mean values look more similar than when the samples are separated based on the presence or absence of a bar.
The environment comparison is conclusive. It shows that whatever the differences are, they cannot be explained by different environmental effects.
4 Discussion
The criteria used to select the PDS seem to imply important differences in the characteristics of the galaxies sampled. It is important, however, to verify that these differences are not due to spurious observational biases. Observational biases (like Malmquist bias) are usually detected by looking for a relation between the parameter observed and the redshift. This method was already used in Figure 2 to show that an observational bias cannot explain why the Markarian galaxies are not detected at 12 and 25 in IRAS. A bias would have cause the detected fluxes to increase with the redshift. On the contrary, the decreasing slopes in Figure 2 indicate the real observational limits in these bands were not reached.
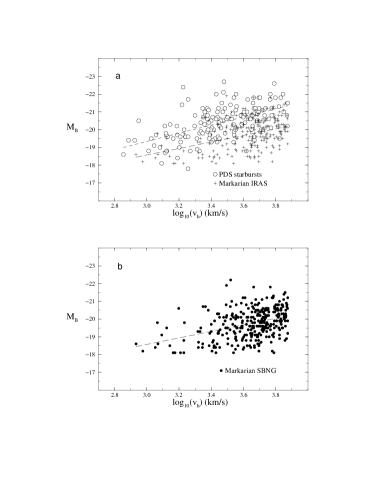
Applying the same kind of test for the absolute magnitude in Figure 3, it can be seen that the luminosity of the galaxies is increasing with the redshift. This is a Malmquist bias. Although the bias seems less severe for the Markarian SBNG, the effect is insufficient to explain the difference in luminosity between the two samples. What Figure 3 shows also is that the PDS are more luminous than the Markarian SBNG at all redshift. For some reasons, therefore, the PDS sample seems to contain only the most luminous galaxies.
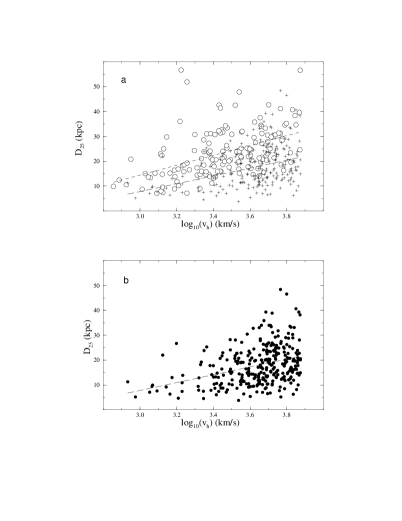
The above result is consistent with the size difference observed between the galaxies in the two samples. Assuming the luminosity in B is correlated to the size of a galaxy, the PDS starburst galaxies being more luminous than the Markarian SBNG are naturally expected to have bigger size. This is verified in Figure 4. The similarity between Figure 3 and Figure 4 (Malmquist bias included) is obvious. It suggests that the large size of the PDS starburst galaxies is due to a bias in luminosity. But, how is this possible, since no condition on the B luminosity was applied?
The B luminosity bias is not trivial. In fact, the only way one could obtain such a bias is through the FIR PDS selection criteria. By picking galaxies that emit in the four IRAS bands, only FIR luminous galaxies are selected. This was already noted in Coziol et al. (1998a). Now, assuming the FIR luminosity of a galaxy is correlated to its mass (which is consistent with the analysis in Coziol, Doyon & Demers 2001) and the mass is correlated to the B luminosity, then, FIR luminous galaxies are also expected to be luminous in B. Therefore, the B luminosity preference observed is not an observational bias, but a result of the FIR selection criteria used: by selecting IRAS galaxies that emit in the four IRAS bands, we pick only FIR luminous galaxies, which turn out to be massive (luminous in B) and large size galaxies.
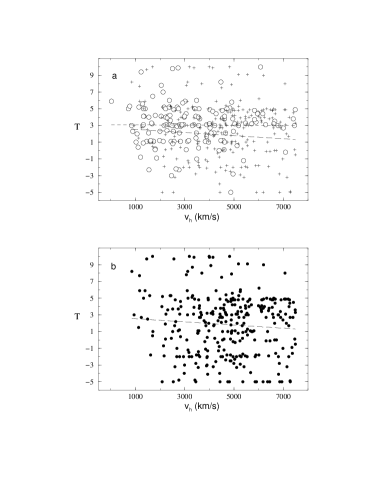
A strong indication that this interpretation is correct is the preference in morphology shown by the PDS. The morphology of the galaxies as a function of the redshift is examined in Figure 5. No significant relation (bias) is observed with the redshift. It can be seen that the PDS are mostly late-type spiral galaxies. Late-type spiral galaxies being richer in dust than early-type ones are obviously favoured by the FIR selection criteria.
Implicit in the definition of an observational bias, there is also a notion of incompleteness (some objects are left aside). Obviously, such incompleteness does not apply to the PDS sample. The PDS is a sub-sample of the IRAS galaxy survey, which is an all sky survey (complete up to a certain magnitude). The PDS contains, therefore, all the nearby galaxies (non AGN) that emit in the four IRAS bands.
The only galaxies that are missing in the present PDS sample are those emitting in the four IRAS bands, but that were not classified as starburst in Coziol et al. (1998a). The properties of the galaxies in this sample (the PDS normal galaxies) are presented in Table 6. The same preference towards massive (luminous) large size late-type spiral galaxies is observed. This is independent from the fact that these galaxies are less luminous in the FIR than the PDS starbursts (L, compared to L for the PDS starburst).
| unbarred | barred | |
|---|---|---|
| N | 74 | 83 |
| M | -20.2 | -20.4 |
| 23.1 | 23.1 | |
| T | 3.7 | 4.2 |
| log D | 25 | 26 |
| log V | 2.28 | 2.25 |
It is important to remember that the Markarian SBNG are also a sub-sample of the IRAS galaxies. In the present sample, 72% of the Markarian galaxies were detected at 100m and/or 60m in IRAS. These are shown with the PDS in Figure 3, 4 and 5. These IRAS starburst galaxies are not included in the PDS sample because they do not emit at 12m and 25m. If we relax this criterion the two samples merge together and we loose all distinction between the PDS and Markarian starburst galaxies. We then have a sample of IRAS starburst galaxies covering all ranges in luminosity, size and morphology.
From the above analysis, it is concluded that there is a strong correlation between the physical characteristics of the galaxies sampled and the fact that they are weak or strong emitter at 12m and 25m in IRAS. It seems therefore secure to state that the only galaxies that emit in these bands in the nearby universe are massive (luminous) large size late-type spiral galaxies. Equivalently, we can also state that the reason the Markarian SBNG are not detected in these bands is because they are too small and have too early morphology.
Note that the high number of early-type galaxies in the Markarian sample may already explain the large difference in barred galaxies observed in the different samples (see Table 3). In the Markarian sample, 111 of the unbarred galaxies are early-type (). Since bars are less frequent (or more difficult to detect) in these galaxies, their high number in this sample leads naturally to a lower frequency of barred galaxies. Eliminating the 111 early-type unbarred galaxies, for example, increases the fraction of barred galaxies to 31%, which is still low, but more comparable to the 46% barred galaxies observed in the PDS sample.
One important question is why are the Markarian SBNG so numerous in early-type galaxies? One possibility is to assume a special burst mechanisms. Merger of galaxies is usually recognized as a mechanism capable of producing early-type galaxies. This mechanism may also be fatal for a pre-existing spiral disk and a bar. If merger is the main burst mechanism of the Markarian SBNG, a high number of early type galaxies in this sample is thus understandable.
In the case of the PDS galaxies, their different properties may be the result of gas accretion. In Coziol et al. (1998b), using a chemical evolution model, it was shown that a starburst galaxy that is accreting gas forms a late-type spiral with a metallicity that is high as compared to a merger case. Having a high metallicity, these galaxies are expected to be rich in dust and to possibly emit in the four IRAS bands.
One difficulty with the above explanation is that nothing indicates what could trigger one mechanism instead of the other. The fact that the galaxies in the two samples were shown to share the same environment excludes an explanation in terms of external causes.
Another possibility is to assume that we are observing a unique population of starburst galaxies where galaxies are observed at different level of evolution. As previously shown, this would be equivalent to relaxing the FIR criteria used to select the PDS. The problem now is to identify the process that corresponds to the evolutionary sequence observed.
To explain the characteristics of the Markarian SBNG, it was proposed in Coziol et al. (2000) that they are presently forming a disk. Assuming this process is not instantaneous, we should then expect to find, in a single population, examples of galaxies at different stage of formation of their disk. According to this interpretation, the Markarian SBNG are simply at a less advanced stage than the PDS starbursts.
One could easily test the above hypothesis. It would be sufficient to determine if the PDS have different metallicity and metallicity gradients (O/H and N/O) than the Markarian SBNG (Considère et al. 2000). Assuming the PDS are more evolved, a strong influence of the bar would also be expected in these galaxies.
In Coziol et al. (2000), the proposition that the Markarian galaxies are in the process of forming a disk was said to be consistent with observations of galaxies in the HDF, suggesting that large size spiral galaxies become less frequent at higher redshift (van den Bergh et al. 2000). However, assuming the same process happens for galaxies in the HDF, we would then expect to also see a difference in size between the early-type and late-type galaxies in this sample. The fact that this difference was recently observed (Cohen et al. 2003) may be one new argument in support of the disk formation model.
5 conclusion
The goal of this article was to verify if other nearby starburst galaxies share the characteristics noted for the Markarian SBNG in Coziol et al. (2000). Using the PDS starburst galaxies, which were selected based on FIR criteria, it was found that the type of galaxy detected differs quite significantly. These differences were then shown to be strongly correlated to the fact that the PDS are strong emitter at 12m and 25m in IRAS. In particular, it suggests that only massive and large size late-type spiral galaxies in the nearby universe have sufficiently hot dust to be observed in these two bands.
The differences observed between the two samples are not in contradiction with the interpretation proposed in Coziol et al. (2000), which is that a large number of Markarian SBNG are in the process of forming a disk. If such process extends over a significant period of time, it is naturally expected to find, in a single population, examples of galaxies at different stages of the formation of their disk. The characteristics expected for galaxies at a more advanced stage are similar to those observed for the PDS. This interpretation is consistent with the observation that the PDS starburst and Markarian SBNG share the same environment.
Similarities with what is observed in the HDF (van den Bergh et al. 2000; Cohen et al. 2003) suggests that we may see the same phenomenon at high and low redshift. This supports the view that nearby starburst in massive galaxies are examples of galaxy in formation.
The author thanks the referee for important comments. This research was supported by CONACyT grant EX-000479. For this analysis, the Lyon-Meudon Extragalactic Database (LEDA), operated by the Lyon and Paris-Meudon Observatories (France) and the NASA/IPAC Extragalactic Database (NED) which is operated by the Jet Propulsion Laboratory, California Institute of Technology, under contract with the National Aeronautics and Space Administration were used.
References
- (1) Barns, J. E., Hernquist, L. 1996, ApJ, 471, 115
- (2) Bicay, M. D., Kojoian, G., Seal, J., Dickinson, D. F., Malkan, M. A. 1995, ApJS, 98, 369
- (3) Campos-Aguilar, A., Moles, M. 1991, A&A, 241, 358
- (4) Considère, S., Coziol, R., Contini, T., Davoust, E. 2000, A&A, 356, 89
- (5) Coziol, R. 1996, A&A, 309, 345
- (6) Coziol, R., Demers, S., Peña, M., Barnéoud, R. 1997, AJ, 113, 1548
- (7) Coziol, R., Torres, C. A. O., Quast, G. R.,Contini, T., Davoust, E. 1998a, ApJS, 119, 239
- (8) Coziol, R., Contini, T., Davoust, E., Considère, S. 1998b, in ASP conf. ser. Vol. 147, Abundance profiles: Diagnostic Tools for Galaxy History, ed. D. Friedli, M. G. Edmunds, C. Robert, L. Drissen (San Francisco: ASP), 219
- (9) Coziol, R., Considère, S., Davoust, E., Contini, T. 2000, A&A, 356, 102
- (10) Coziol, R., Doyon, R., Demers, S. 2001, MNRAS, 325, 1081
- (11) de Vaucouleurs G., Vaucouleurs A. de, Corwin H.G. Jr., Buta R.J., Paturel G., Fouqué, P., 1991, Third Reference Catalogue of Bright Galaxies, Springer-Verlag (RC3)
- (12) Goldader, J. D., Joseph, R. D., Doyon, R., Sanders, D. B. 1997a, ApJ, 474, 104
- (13) Keel, W. C., van Soest, E. T. M. 1992, A&AS, 94, 553
- (14) Mihos, J. C., Hernquist, L. 1996, APJ, 464, 641
- (15) Noeske, K. G., Iglesias-Páramo, J., Vílchez, J. M., Papaderos, P., Fricke, K. J. 2001, A&A, 371, 806
- (16) Paturel G., Bottinelli L., Di Nella H., Durand N., Garnier R., Gouguenheim L., Lanoix P., Marthinet M.C., Petit C., Rousseau J., Theureau G., Vauglin I., 1997, Astronom. Astrophys. Suppl. Ser. 124, 109
- (17) Salzer, J. J., MacAlpine, G. M., Gordon, M. 1988, AJ, 96, 1192
- (18) Cohen, S. H., Windhorst, R. A., Odewahn, S. C., Chiarenza, C. A., Driver, S. P. 2003, AJ, 125, 1762
- (19) van den Bergh, S., Cohen, J. G., Hogg, D. W., Blandford, R. 2000, AJ, 120, 2190
Appendix A One-way analysis of variance: description and results
The one-way analysis of variance (ANOVA) test compares three or more unmatched groups of data, based on the assumption that the two populations are Gaussian. The P value answers this question: if the populations really have the same mean, what is the chance that random sampling would result in means as far apart as observed?
The post tests (like Tukey’s and Dun’s post tests) are modifications of the t test. They account for multiple comparisons, as well as for the fact that the comparisons are interrelated. The unpaired t test computes the t ratio as the difference between two group means divided by the standard error of the difference (computed from the standard errors of the two group means, and the two sample sizes). The P value is then derived from t. The post tests work in a similar way. Instead of dividing by the standard error of the difference, they divide by a value computed from the residual mean square. Each test uses a different method to derive a P value from this ratio.
For the difference between each pair of means, the tests report the P value as , , or . If the null hypothesis is true (all the values are sampled from populations with the same mean), then there is only a 5% chance that any one or more comparisons will have a P value less than 0.05.
For comparison the data for the PDS and Markarian starbursts were separated in 4 groups: group A, the PDS unbarred galaxies, group B, the PDS barred, group C, the Markarian unbarred and group D, the Markarian barred. Before performing the analysis, Kolmogorov-Smirnov tests were used to verify the normality distribution of the data. The only group of data that did not pass this test is the maximum rotation velocity for the Markarian unbarred galaxies (group C). A non-parametric test (Kruskall-Wallis) and Dunn’s post test were used for this parameter.
Results of the one-way ANOVA and non-parametric tests are reported in Table A1. The results for the post tests, when the means were shown to varied significantly, are reported in Table A2.111For this analysis, the program Prism, version 3.00, for Windows was used. This program was made by GraphPad software, San Diego California USA (www.graphpad.com).
| Parameters | P | Means signif. different |
|---|---|---|
| MB | yes | |
| 0.4637 | no | |
| T | yes | |
| vh | yes | |
| D25 | yes | |
| Vmax | yes |
| groups | MB | T | vh | D25 | Vmax |
|---|---|---|---|---|---|
| A vs B | |||||
| A vs C | |||||
| A vs D | |||||
| B vs C | |||||
| B vs D | |||||
| C vs D |