Are we missing baryons in Galaxy Clusters?
Abstract
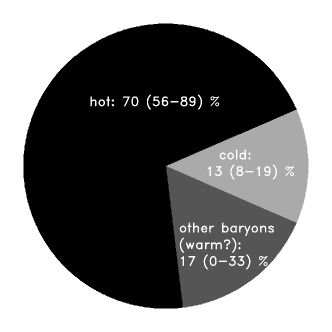
The recent constraints on the cosmological parameters put from the observations of the WMAP satellite limit the cosmic baryon fraction in a range that is larger than, and marginally consistent with, what is measured in galaxy clusters. This rises the question whether or not we are considering all the ingredients of cluster baryonic budget. Carefully weighing the baryons in X-ray emitting plasma and stars in cluster galaxies, I conclude that the cluster baryonic pie is made by 13 (with a range of 8–19) per cent of stars, 70 (56–89) per cent of intracluster hot medium and 17 (0–33) per cent, and a probability of 73 per cent of being larger than 0, of “other” baryons, presumably in the form of warm ( Kelvin) material.
keywords:
galaxies: cluster: general – galaxies: fundamental parameters – intergalactic medium – X-ray: galaxies – cosmology: observations – dark matter.1 INTRODUCTION
The recent analysis of the angular power spectrum of the Cosmic Microwave Background (CMB) obtained from WMAP (Bennett et al. 2003) has provided constraints on the cosmological parameters (Spergel et al. 2003) that confirms with greater accuracy the current energy density of the Universe to be comprised by about 73 per cent of dark energy and 27 per cent of matter, mostly non-baryonic and dark. In particular, the quoted constraint on the baryon density, , is , and on the total matter density, , is . Consequently, the cosmic baryon fraction, , is equal to and the ratio between baryon and cold dark matter density, , is equal to . These values are expected to be maintained in regions at high overdensities that collapse to form galaxy clusters.
The clusters baryon budget is composed mainly from the X-ray luminous baryons, , of the intracluster medium (ICM) that becomes hotter upon falling into the cluster dark matter halo by gravitational collapse. Other contributions come from the baryonic stellar mass in galaxies, , and from other “exotic” sources, like intergalactic stars and a still poorly defined baryonic dark matter. Given the large uncertainties on the relative contribution from baryons that are not accounted for in either or , I qualify these as “other baryons”, , as already done in a previous work (Ettori 2001) in which I discussed the constraints on cluster baryon budget from BOOMERANG and MAXIMA-I data. The tighter constraints on the cosmological parameters provided from WMAP allow now more firm conclusions.
Therefore, one can put the following relation between the relative amount of baryons in the Universe and in clusters with total gravitating mass, :
| (1) |
where , ( in Fukugita et al. 1998), , and is the parameter representing the cosmic depletion of baryons at the virial radius with respect to the global value ( from the hydrodynamical simulations of the Santa Barbara Project; Frenk et al. 1999). I parametrize the uncertainties on the measurements of the total gravitating mass and gas mass through the factors and , respectively. These factors act to increase the total mass estimates (i.e. ) if corrections to the hydrostatic equilibrium equation are required for bulk motions of the ICM or non-thermal pressure support, and to lower the true gas mass (i.e. ) if clumpiness is present in the ICM that is assumed to be smoothly distributed (e.g. Mathiesen et al. 1999).
In this Letter, I will analyze the equation 1 (i) to assess the consistency between the cosmic and the cluster baryon budget and (ii) to put significant constraints on . In a consistent way, I adopt the WMAP results on the Hubble constant, , of km s-1 Mpc-1 to rescale all the measured quantities.


2 The cosmic baryon budget from WMAP
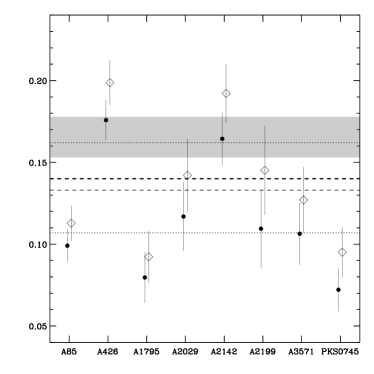
Figure 1 shows the allowed region from the WMAP results on the cosmic baryon budget with respect to the observed gas and baryon fraction for a sample of relaxed galaxy clusters both at low and high redshift. All these values are estimated at the overdensity of 200 with respect to the critical density (i.e. within the cluster region that numerical simulations show to be virialized in a independent way; see, e.g., Evrard et al. 2002). Using a Bayesian approach (Press 1996), I measure the average gas (baryon) fraction and confirm that is consistent between the two samples: and (the error-weighted means of the gas fraction distribution are and in the low and high sample, respectively. Note that these values do not include any correction by the baryonic depletion that is expected to raise the gas/baryon fraction by about 8/6 per cent at this overdensity. See also Fig. 1 and text that follows). These estimates are consistent with other, independent, recent determinations (e.g. Allen et al. 2001, Pratt & Arnaud 2002) and consistently lower than the baryon budget required from WMAP results. It is worth noticing that only the highest estimates of the gas (baryon) mass fraction (e.g. A426, A2142, RXJ1350) are perfectly consistent with WMAP results, whereas the other clusters are systematically below them.
To investigate the systematics that could affect this estimate, I change the values of the factors and and study their influence on the baryon fraction. The factor , which parametrizes the uncertainties on is expected to be between 1 and 1.15 from the cluster mass profiles recovered from both X-ray and lensing data (e.g. Allen et al. 2001). The factor represents the level of clumpiness that affects the estimate of in X-ray analysis and that simulations show to be lower than 1.2 (Mathiesen et al. 1999).
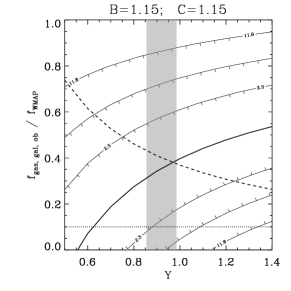
Figure 2 shows that higher values of and require a more relevant role to be played by , giving a positive detection for typical value of when and are 15 per cent larger than the null hypothesis of reliable estimates of both and from X-ray analysis.
Moreover, I can estimate from the observables the ratio and to evaluate the probability that and a no-zero value of is required from the data (see Fig. 3). I obtain values of between 1.3 () and 1.7 (), with an interval accepted at the 95 per cent confidence level of 0.5–2.7. More significantly, this ratio has to be larger than 1 at 76.6 () and 92.5 () per cent confidence level. This result gives a high confidence to the conclusion that a significant amount of baryons has to be present apart from what is observed both at X-ray and optical wavelength.


3 Conclusions
By comparing the recent cosmological constraints from measurements of the angular power spectrum of the temperature anisotropy in the CMB done with WMAP with the observed distribution of the gas mass fraction in clusters of galaxies, I conclude that
-
1.
galaxy clusters with the highest observed gas/baryon fraction are well in agreement with the WMAP estimate of the cosmic baryon budget. On average, however, a disagreement in the order of 15–20 per cent is present, the observed cluster baryon fraction being a lower estimate of the cosmic one. This implies that estimates of the cold dark matter density, , done by applying mean results from large sample of objects tend to overestimate it. In this perspective, a more “realistic” result is provided from the highest estimate in the distribution of the cluster gas (baryon) mass fraction;
-
2.
this dark baryonic component appears to be between a fraction, and up to 2 times, the measured gas fraction. Values of larger than 1 are required from the data with a level of confidence of about 80 per cent and more, if we are underestimating (overestimating) the total (gas) mass. The most probable values are 0.3 () and 0.7 (), and lower than 1.7 at 95 per cent confidence level.
It is very unlikely that galactic objects, such as “colored” (red, brown, white, beige) dwarfs, stellar remnants and other species of MACHOs (see review in Gilmore 1999 and Evans 2003), or intergalactic ones formed from tidal disruption of cluster dwarfs, like planetary nebulae (e.g. Ciardullo et al. 2002), red-giant-branch stars (e.g. Ferguson et al. 1998) and supernovae (Gal-Yam et al. 2003), can be responsible for such amount of baryons. It is reasonable to believe that they can contribute by about 0.2 times , or .
The most plausible suspect to give so large contribution is then a X-ray warm ( K K) intracluster medium (W-ICM). Large scale cosmological and hydrodynamical simulations by Cen & Ostriker (1999) and Davé et al. (2001) show that the mass fraction at redshift 0 is largely dominated from a warm medium, with a relative contribution in mass that is about 2 times larger than the amount of hot ( K) baryons. However, less than 30 per cent of it falls in overdensities that are typical for bound structures in a CDM universe. Furthermore, Bonamente et al. (2002) present evidence of excess in the soft X-ray emission between 0.2–0.4 keV in 50 per cent of the 38 clusters in their sample of Rosat PSPC observations. They list several suggestions on how to explain this excess, originally observed in extreme ultraviolet (Lieu et al. 1996), both as thermal and non-thermal component. If we assign this emission to the baryons that are lacking in our budget, we interpret it as thermal emission due either to the diffuse/halo component of unresolved X-ray faint cluster galaxies or W-ICM. In the first case, we are forced to consider an inexplicable large amount of X-ray emitting member galaxies. More plausible is then the hypothesis of W-ICM, even though its cooling time tends to be very short with the bulk of the radiation in emission line if this gas is not primordial. Fabian (1997) suggested that it can be located in turbulent mixing layers lying between embedded cold clouds and the ICM. However, the traditional picture on the efficiency of cooling processes in the cluster cores is not supported anymore after that XMM and Chandra observations did not report evidence of gas cooler than 1–2 keV (e.g. Peterson et al. 2003) and showed a strong interplay between ICM, the central active galaxy (e.g. Fabian 2002) and merging cool clumps (e.g. Markevitch et al. 2000, Mazzotta et al. 2003). On the other side, the production of thermal energy per particle due to supernovae related to the star formation activity is in the order of keV for a given efficiency in converting the kinetic energy of the explosion into thermal energy through galactic winds, and adopting typical values of the cluster gas mass and number of type II supernovae as required from the observed ICM metallicity. While this energy per gas particle is not enough to stop cooling the hot ICM, it can easily accommodate for the survival of the warm component.
Intriguingly, the stronger soft excess detected in Rosat data from Bonamente et al. (2002) is measured in objects like A85 and A1795, that are the ones lacking most of the baryons with respect to the cosmic budget as plotted in Fig. 1. Significant detection is also present in A2029, A2199 and A3571, whereas a marginal detection is associated to A2142. Nevalainen et al. (2003; see also Kaastra et al. 2003) confirm with XMM the excess in the soft X-ray emission in A1795 and that this excess is best fitted by a thermal component with a characteristic temperature of 0.8 keV, which is about an order of magnitude higher than what required from Rosat data but still consistent with our energetic arguments. Using their estimation of the atom density of the W-ICM in the core of A1795, and assuming that it is broadly distributed like the ICM, one can infer a . In general, values of between 0.1 and 0.5 are expected.
To summarize, clusters seem to have similar behavior in accumulating the same relative amount of baryons. It is then their peculiar thermal history due to the interplay of merging actions and/or activity of the central active galaxy that provides the baryonic ingredients and cook the baryonic pie that we taste and show in Figure 4. To prepare it, I have considered only the eight nearby clusters which provide a more reliable estimate of and are less affected from systematics in the determination of (see discussion in Ettori et al. 2003). I have also corrected the gas fraction by the depletion factor . The baryonic pie is then made of 70 per cent of hot ICM, with range between 56 and 89 per cent and a distribution of the calculated that spans between 28 and 143 per cent at confidence level (higher upper limit observed in A426 that has a most probable value of 115 per cent). The cold, stellar component is responsible for 13 (: 8–19) per cent, with an observed distribution in the sample between 2 and 37 per cent ( lower and upper limit, with the latter reached in A2199, which has a central value of 21 per cent). Finally, a third ingredient, probably a warm ICM, contributes by about 17 (0–33) per cent (and a probability to be larger than 0 of 73 per cent) with a distribution that goes from –2915 per cent in A426 to 4012 per cent in A1795, one of the objects with the largest detected soft excess (Bonamente et al. 2002, Kaastra et al. 2003).
ACKNOWLEDGEMENTS
I am grateful to Hans Böhringer and Andy Fabian that pointed out a relevant weakness in the assumptions done in the original manuscript.
References
- [] Allen S.W., Schmidt R.W., Fabian A.C., 2001, MNRAS, 328, L37
- [] Bennett C. et al., 2003, ApJ, in press (astro-ph/0302208)
- [] Bonamente M., Lieu R., Joy M.K., Nevalainen J.H., 2002, ApJ, 576, 688
- [] Cen R., Ostriker J., 1999, ApJ, 514, 1
- [] Ciardullo R., Feldmeier J.J., Krelove K., Jacoby G.H., Gronwall C., 2002, ApJ, 566, 784
- [] Davé R. et al., 2001, ApJ, 552, 473
- [] Ettori S., 2001, MNRAS, 323, L1
- [] Ettori S., De Grandi S., Molendi S., 2002, AA, 391, 841
- [] Ettori S., Tozzi P., Rosati P., 2003, AA, 398, 879
- [] Evans, N.W., 2003, in the proceedings of ”The 4th International Workshop on the Identification of Dark Matter ”, eds. N. Spooner and V. Kudryavtsev, World Scientific, in press (astro-ph/0211302)
- [] Evrard A.E. et al., 2002, ApJ, 573, 7
- [] Fabian A.C., 1997, Science, 275, 84
- [] Fabian A.C., 2002, in ”Lighthouses of the Universe”, eds. M. Gilfanov, R. Sunyaev et al., Springer-Verlag, p.24 (astro-ph/0201386)
- [] Ferguson H.C., Tanvir N.R., von Hippel T., 1998, Nature, 391, 461
- [] Frenk C. et al., 1999, ApJ 525, 554
- [] Fukugita M., Hogan C.J., Peebles P.J.E., 1998, ApJ 503, 518
- [] Gal-Yam A., Maoz D., Guhathakurta P., Filippenko A.V., 2003, AJ, 125, 1087
- [] Gilmore G., 1999, in the proceedings of ”The 2nd International Workshop on the Identification of Dark Matter ”, eds. N. Spooner and V. Kudryavtsev, World Scientific, p.121 (astro-ph/9812277)
- [] Girardi M., Manzato P., Mezzetti M., Giuricin G., Limboz F., 2002, ApJ, 569, 720
- [] Kaastra J.S., Lieu R., Tamura T., Paerels F.B.S., den Herder, J.W., 2003, A&A, 397, 445
- [] Lieu R., Mittaz J.P.D., Bowyer S., Breen J.O., Lockman F.J., Murphy E.M., Hwang C.-Y, 1996, Science, 274, 1335
- [] Lin Y.T., Mohr J.J., Stanford S.A., 2003, ApJ, in press (astro-ph/0304033)
- [] Markevitch M. et al., 2000, ApJ, 541, 542
- [] Mathiesen B., Evrard A.E., Mohr J.J., 1999, ApJ, 520, L21
- [] Mazzotta P., Edge A., Markevitch M., 2003, ApJ, submitted, astro-ph/0303314
- [] Nevalainen J.H., Lieu R., Bonamente M., Lumb D., 2003, ApJ, 584, 716
- [] Peterson J.R., Kahn S.M., Paerels F.B.S., Kaastra J.S., Tamura T., Bleeker J.A.M., Ferrigno C., Jernigan J.G., 2003, ApJ, 588, 299
- [] Pratt G.W., Arnaud M., 2002, A&A, 394, 375
- [] Press W.H., 1996, in “Unsolved Problems in Astrophysics”, Proceedings of Conference in Honor of John Bahcall, ed. J.P. Ostriker, Princeton University Press (astro-ph/9604126)
- [] Spergel M. et al., 2003, ApJ, in press (astro-ph/0302209)