Nonthermal Emission from the Arches Cluster (G0.121+0.017) and the Origin of -ray Emission from 3EG J1746-2851
Abstract
High resolution VLA observations of the Arches cluster near the Galactic center show evidence of continuum emission at 3.6, 6, 20 and 90cm. The continuum emission at 90cm is particularly striking because thermal sources generally become optically thick at longer wavelengths and fall off in brightness whereas non-thermal sources increase in brightness. It is argued that the radio emission from this unique source has compact and diffuse components produced by thermal and nonthermal processes, respectively. Compact sources within the cluster arise from stellar winds of mass-losing stars (Lang, Goss & Rodriguez 2001a) whereas diffuse emission is likely to be due to colliding wind shocks of the cluster flow generating relativistic particles due to diffuse shock acceleration. We also discuss the possibility that -ray emission from 3EG J1746–2851, located within 3.3′ of the Arches cluster, results from the inverse Compton scattering of the radiation field of the cluster.
1 Introduction
Near-IR observations of the Galactic center region have identified a remarkable young (1–2 Myr) cluster of massive stars, the Arches cluster or G0.121+0.017 (e.g., Cotera et al. 1996; Figer et al. 2002). The Arches cluster has an angular size of with the greatest concentration of stars lying in the inner 9′′ (0.36 pc at the distance of 8.5 kpc). Recently, radio continuum emission from individual stars in the Arches cluster was detected between 45 and 8.5 GHz (Lang et al. 2001a). The radio spectra, near-IR spectral types of several stars in the Arches cluster and X-ray studies of this cluster are all consistent with colliding ionized stellar winds arising from mass-losing WN and/or Of stars (Cantó et al. 2000; Raga et al. 2001; Yusef-Zadeh et al. 2002a). Here, we present sensitive observations at 327 MHz and present evidence for nonthermal emission from the Arches cluster.
2 Observations & Results
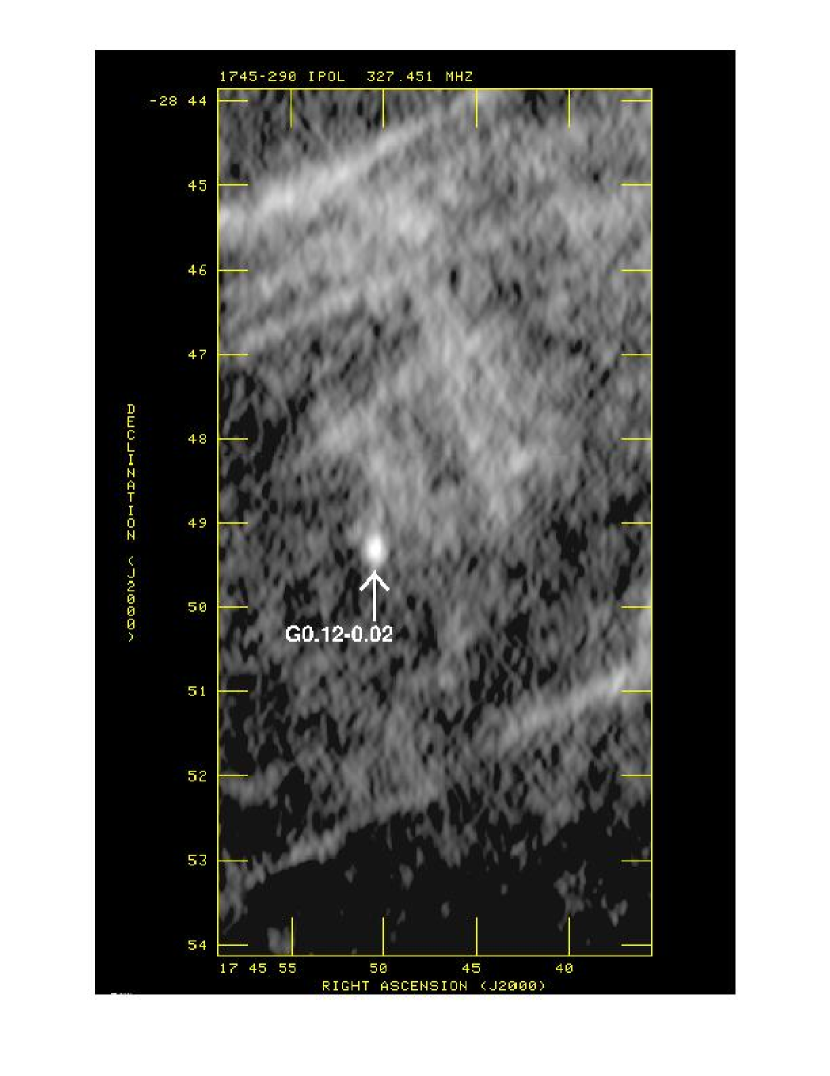
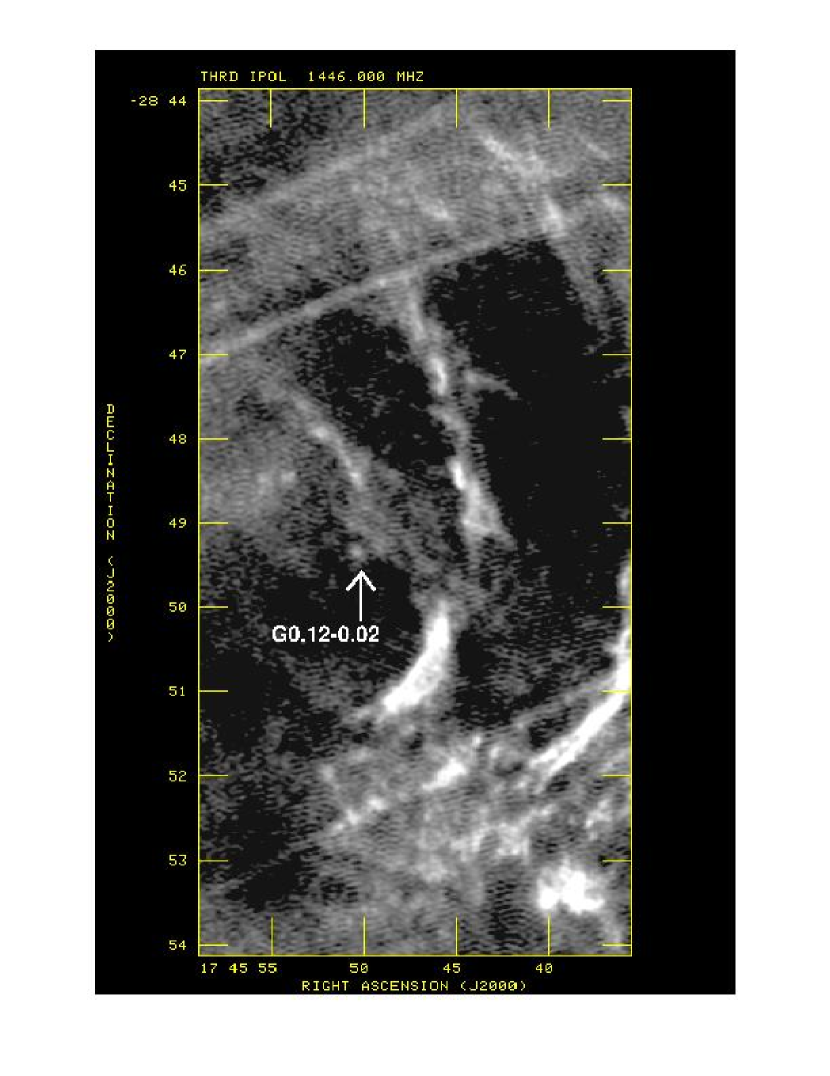
Radio Data: The Very Large Array (VLA) of the National Radio Astronomy Observatory777The National Radio Astronomy Observatory is a facility of the National Science Foundation, operated under a cooperative agreement by Associated Universities, Inc. was used in a number of configurations to observe the Galactic center at 330 MHz with a spatial resolution of 7 and rms noise of 1.7 mJy. A detailed account is given in Nord et al. (2003). We also used archival 1.4, 5, 8.5 GHz observations of the cluster which were based on multiple VLA configurations (Morris & Yusef-Zadeh 1989; Lang et al. 2001a). Figure 1a shows a grayscale image of the Arches cluster at 327 MHz with a resolution of 7. A bright radio source with a flux density of 91 mJy appears to coincide with the Arches cluster at , [2000] = 5081, . Statistical astrometry was used to determine the positions of the point sources in the image. The source is resolved to a size of 7.1. Faint filamentary structures are detected to the north and south of the Arches cluster (Nord et al. 2003). Figure 1b shows the identical region at 1.4 GHz with a resolution of 3.9. Although the 1.4 GHz continuum emission is dominated by bright HII regions associated with arched filaments and nonthermal filaments of the Arc, there is localized emission from the position of the Arches cluster at a number of frequencies including the 1.4 GHz data. The peak brightness of the cluster at 1.4 GHz is located at , [2000] = 5036, , coincident with the 327 MHz peak brightness within positional uncertainties.
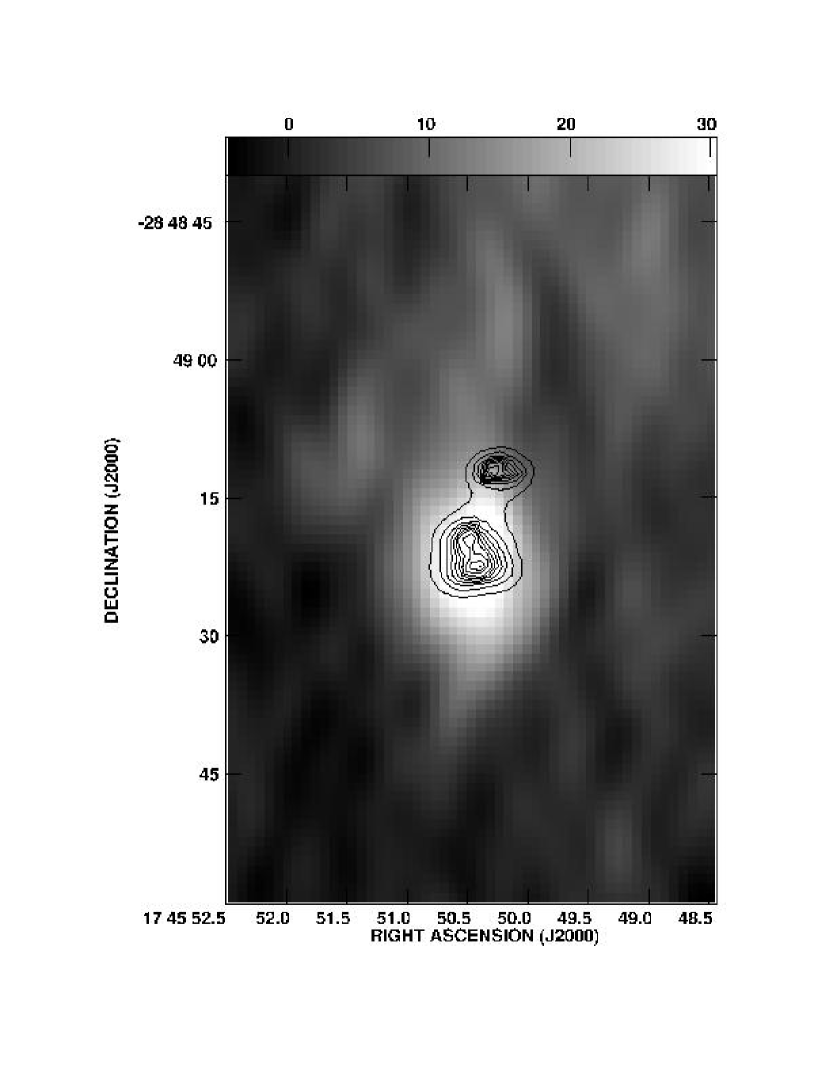
X-ray Data X-ray emission from the Arches cluster has recently been detected by Chandra (ObsID 945) (Yusef-Zadeh et al. 2002a). Five X-ray sources (A1 to A5) were detected in the region surrounding the Arches cluster with A1 being the brightest source arising from the core of the cluster. The spectral and the spatial distributions of the A1 component of the X-ray emission were extracted from all available archival Chandra observations (ObsIDs 945, 2276, 2284). The 327 MHz emission coincides with the brightest X-ray component A1 which arises from the core of the Arches cluster. Figure 2 shows contours of X-ray emission superimposed on a grayscale continuum image at 327 MHz. It is clear that source A1, which is now spatially resolved into two components (Law and Yusef-Zadeh 2003), coincides with the peak of the 327 MHz emission from the Arches cluster (Yusef-Zadeh et al. 2002a).
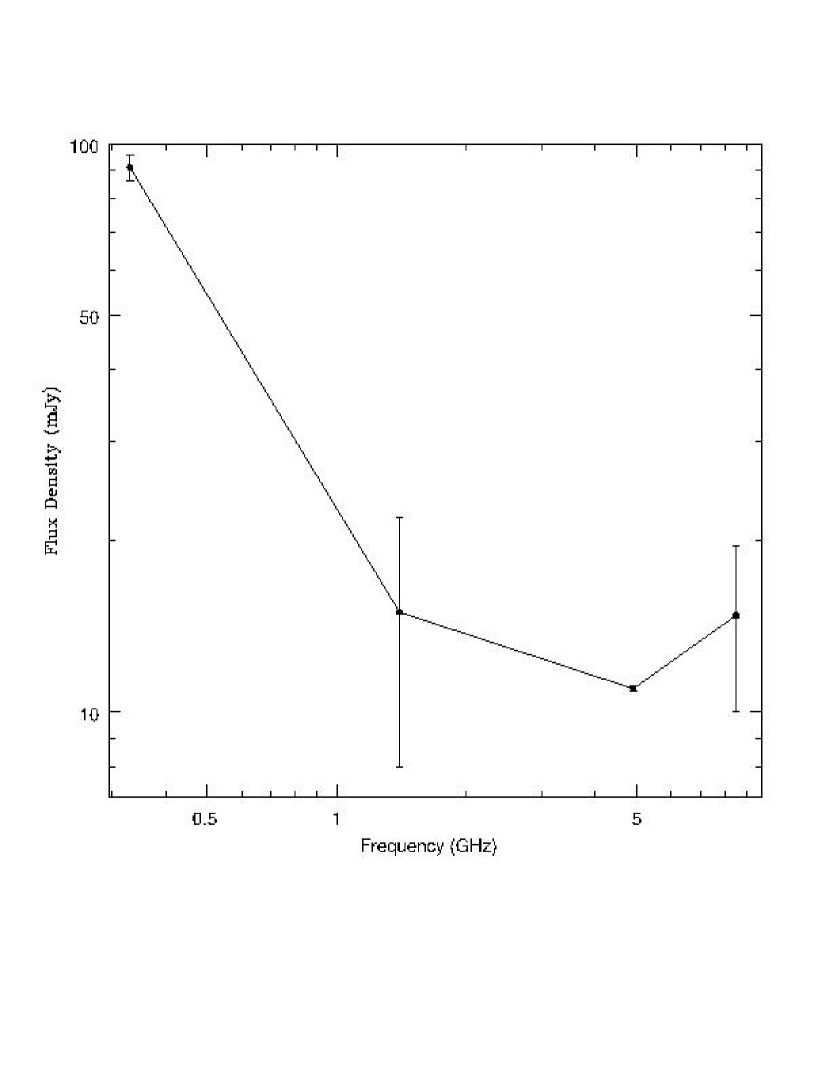
Radio Spectrum: The detection of the continuum emission from the Arches cluster from 327 MHz to 43 GHz (see Fig. 3) suggests both thermal and nonthermal emission. Here we argue that high frequency radio emission from the cluster is compact and arises from stellar sources, whereas the low-frequency radio emission appears diffuse with nonthermal characteristics.
First, the prominent thermal components seen at 1.4 GHz are absent at 327 MHz whereas the nonthermal filaments and the Arched cluster are evident at both frequencies. The typical brightness of HII regions associated with the Arched filaments drops by a factor of 20 from 1.4GHz to 327 MHz whereas the continuum emission from the Arches cluster increases at 327 MHz. These suggest that the bright compact source at 327 MHz coincident with the Arches cluster, like the linear features, has nonthermal characteristics. A faint nonthermal stellar source with a flux density 0.4 mJy at 5 GHz (AR6 in Lang et al. 2001a) has been detected toward the Arches cluster but its 327 MHz emission should be insignificant. The thermal emission from ionized stellar wind sources should also be insignificant at low frequencies.
Second, if the continuum source coincident with the Arches cluster due to free-free emission at a temperature of 104K, the emission measure E (cm-6 pc) estimated from the 8.5 GHz data is cm-6 pc. The 8.5 GHz flux density is 14.8 mJy with a resolved source size of 5.5. The predicted optical depth at 327 MHz is then 0.65. However, the observed flux density at 327 MHz is much higher, indicating the presence of nonthermal diffuse emission at low frequencies. The large free-free optical depth at 327 MHz detected toward the Arched filaments (Anantharamaiah et al. 1991), but not toward the Arches cluster and the nonthermal filaments, implies that the Arches cluster and nonthermal filaments are on the near side of the HII region. A similar geometry has been suggested by Lang et al. (2001b) based on H92 observations of the Arched filaments.
The flux density of the 327 MHz emission, 91 mJy (see Table 1), is a reasonable estimate of nonthermal emission from the Arches cluster because of: i) the low frequency, ii) properly subtracted background emission and iii) its isolation from the rest of thermal gas which is optically thick at 327 MHz. The best estimate of the thermal component is estimated from 8 GHz and higher frequency observations. Sub-arcsecond resolution images of the Arches cluster show a total flux of 3.2 mJy from a collection of ionized stellar wind sources detected at 8.5 GHz (Lang et al. 2001a). A Gaussian fit with a linear background subtraction to the 8 GHz radio continuum data having a resolution of 6.6 gives a flux density of 14.84.8 mJy (see Table 1). This value is much higher than the total flux density of compact stellar sources, thus implying a new diffuse component associated with the Arches cluster.
The flux measurements of the Arches cluster at 5 and 1.4 GHz at the resolution of 327 MHz observations may be contaminated by the extended HII region. In order to remedy this situation, we used higher resolution 5 and 1.4 GHz images of the Arches cluster with a resolution of 3.1 and 3.2 in order to obtain a more accurate measure of radio continuum flux from the Arches cluster. The corresponding flux densities at 5 and 1.4 GHz are 11 and 15 mJy, respectively. These estimates assume that the emission from the background HII region is resolved, and has been removed by background subtraction. The fluxes at different frequencies are listed in Table 1 and are shown in Figure 3. The flux values tend to be lower near 5GHz, indicating a transition region between thermal and nonthermal components.
The high resolution continuum images resolve the Arches cluster at 327, 1.4 and 5 and 8.5 GHz and deconvolved sizes as listed in Table 1. Considering the strong background emission at high frequencies and strong scattering of the source at 327 MHz, the measured size of the source has large uncertainties. Nevertheless, the measured size of the radio emission appears to be consistent with a diffuse extended component with a size approximately similar to the actual size of the stellar cluster . The spectral index , where the flux density S, between 1.4 GHz and 327 MHz is determined to be –1.2. If we use low resolution 1.4 GHz data with identical uv coverage to that of 327 MHz data, the flux density is measured to be 88 mJy and the spectral index is estimated to be . The low-resolution 1.4 GHz continuum image of the Arches cluster is clearly contaminated by the background HII emission. Taking the mean of these values, is estimated to be , consistent with a nonthermal spectrum.
X-ray Spectrum: The emission from A1 was fit with an absorbed, two temperature model using a distant background region (Yusef-Zadeh et al. 2002). The majority of the observed flux (1/2-2/3) comes from the low temperature component (kT 1keV). However, there is significant contribution to the flux, particularly the high energy line emission, due to a high temperature thermal component (kT 6 keV). If the spectrum was fit with a one-temperature/powerlaw model, the flux is dominated by the low temperature component (kT 1.5keV), and only about 1/6th of the observed flux can be attributed to the powerlaw. The quality of both fits is roughly the same with (using the Gehrels statistic, which is more accurate when the number of counts in each bin is small), whereas a one-temperature model gives a . Unfortunately, the unabsorbed flux from the powerlaw component is very difficult to constrain. The value of the photon index is basically unrestricted due to the relatively small contribution of the powerlaw to the total observed flux. Thus, the unabsorbed flux of the powerlaw component is unconstrained.
3 Discussion
The collision of stellar winds in a dense cluster environment produces X-ray emission from a wind escaping from the outer boundary of the cluster ( Cantó et al. 2000, Raga et al. 2001). Shocking of the most powerful stellar winds produces discrete X-ray sources and the overall cluster outflow produces diffuse X-ray emission. The detection of diffuse X-ray emission from the Arches cluster supported this picture (Yusef-Zadeh et al. 2002). These measurements suggest that nonthermal emission can be produced by the acceleration of thermal X-ray gas to relativistic energies by diffusive shock acceleration (e.g. Bell 1978). Nonthermal emission could result from the contributions of shocked stellar winds in binary systems of the cluster and shocked cluster flow. Nonthermal emission from massive binary systems have been detected in many systems (e.g. Chapman et al. 1999), and is understood theoretically (Eichler & Usov 1993). The X-ray luminosity from the Arches cluster is whereas the nonthermal and thermal luminosities are ergs s-1, respectively. The ratio of X-ray to radio luminosity is , similar to that detected in binary WR binary systems.
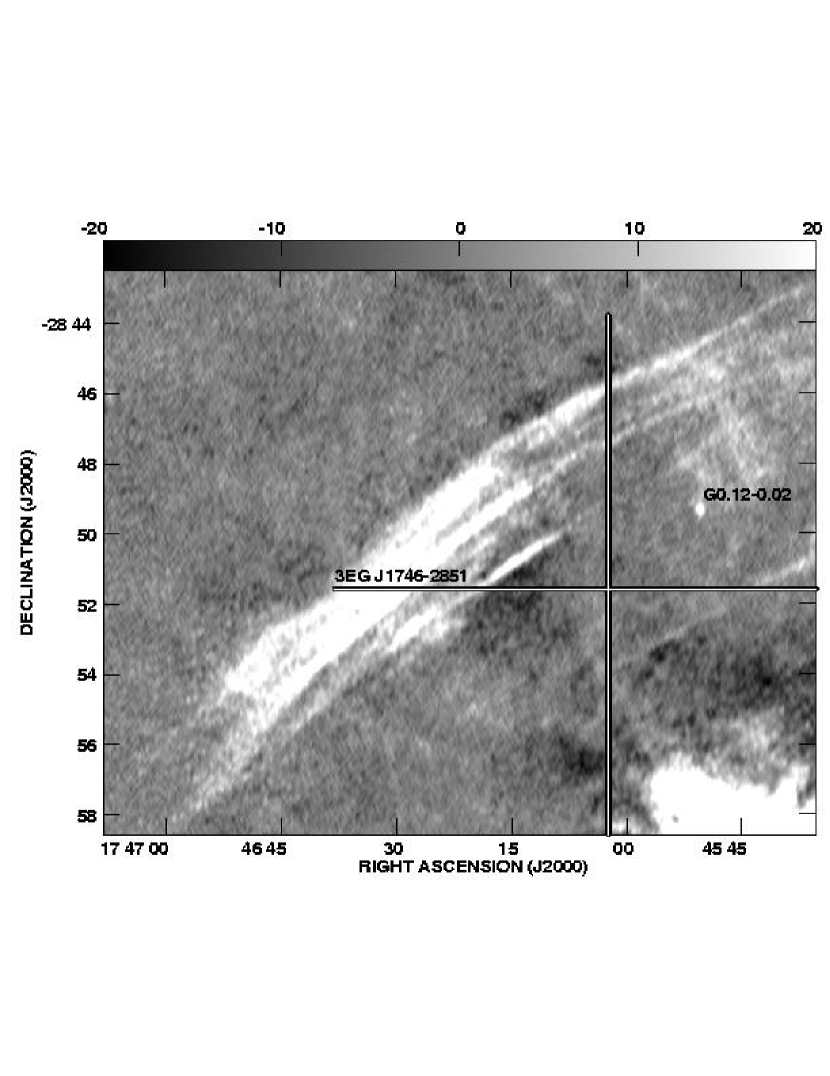
The existence of nonthermal particles within the core of a luminous young stellar cluster suggests that the nonthermal X-ray or -ray emission could result from upscattering of the radiation field by nonthermal particles (Ozernoy, Genzel & Usov 1997). In fact, the Arches cluster, is displaced by from the nominal position of the unidentified EGRET source 3EG J1746–2851 (Hartman et al. 1999), located well within the 95% error radius . Other possible associations are with the radio Arc and G0.13-0.13 (Pohl et al. 1997; Yusef-Zadeh et al. 2002b) where inverse Compton scattering of FIR radiation by the energetic electrons of the nonthermal filaments and brehmsstrahlung by the high-energy tail of the high electron energy distribution are used to reproduce the -ray emission. Both these suggestions suffer from an unestablished interaction picture of the nonthermal filaments and adjacent molecular clouds. However, the Arches cluster is the closest candidate source to the centroid of 3EG J1746–2851 and the -ray emission is expected to arise from the cluster itself. Figure 4 shows the distribution of radio and -rays from the region near the Arches cluster. The cross shows the position of 3EG J1746–2851. This steady, strong -ray source has photon index 1.7 and a flux 1.2 photons cm-2 s-1 with energies greater than 100 MeV. The photon spectrum could be produced by inverse Compton scattering from a distribution of relativistic electrons emitting synchrotron radiation with a spectral index of =–0.7, consistent with the nonthermal radio emission from the Arches cluster.
To estimate the gamma-ray flux produced by inverse Compton scattering, we must first adopt parameters for the relativistic electron population and the stellar radiation field within the Arches cluster. We adopt a nonthermal synchrotron flux of 91 mJy at 327 MHz, with spectral index . The radiating electrons then have an energy spectrum, which we assume extends between 10 MeV and 10 GeV. The stellar radiation field in the Arches cluster is approximated by a diluted black body with temperature K; the dilution factor can be estimated from the total cluster luminosity (Figer et al. 2002), and cluster radius pc, as . With these nominal values, the inverse Compton flux above 100 MeV is where is the pitch angle of the relativistic electrons. The -ray flux decreases for stronger magnetic fields because fewer relativistic electrons are required to match the observed synchrotron flux. We conclude that if the EGRET source is a result of inverse Compton scattering from the synchrotron-emitting electrons, the magnetic field in the emitting regions is of order 20 microgauss. This conclusion is insensitive to source geometry or filling factors because the synchrotron and gamma-ray emitting regions are identical and source geometry factors therefore scale out of equation (1).
Inverse Compton scattering may contribute to the X-ray emission from the center of the cluster, as 10 MeV electrons scatter photons with K into the X-ray band. For the numbers adopted above, the band-integrated X-ray flux is , roughly 1/4 of that from X-ray component A1 (Yusef-Zadeh et al. 2002). This is consistent with the one-temperature/power law fit to the spectrum of A1 showing that 1/6 of the observed flux can be attributed to the power law.
The ratio of magnetic field and relativistic electron energy densities does depend on source geometry. For a spherical source of radius 0.2 pc (5” at 8.5 kpc), the inferred field strength is sub-equipartition: the electron energy density is roughly a thousand times the energy density in the field - the equipartition field (neglecting ions) would be about 140 Gauss. Introducing a filling factor would increase the equipartition field further. The relativistic particle pressure, while dominating the magnetic field, is several hundred times smaller than the ram and thermal pressure associated with colliding winds from the most massive stars in the cluster. It is therefore plausible that these particles are accelerated in shocks formed by colliding stellar winds and are then advected outwards in the resultant cluster wind.
In summary, we have reported the first evidence of diffuse nonthermal radio continuum emission from the Arches cluster, one of the youngest and densest stellar clusters in the Galaxy. The origin of -ray emission from 3EG J1746-2851 is accounted for from upscattering of intense radiation field in the cluster by relativistic particles generated from colliding winds. Future, high-resolution observations using the VLA, Chandra, XMM and Integral should be able to examine the spectrum and the spatial distribution of nonthermal emission from this cluster over a wide range of frequencies and determine the true spectrum of the Arches cluster.
References
- (1)
- (2) Anantharamaiah, K.R., Pedlar, A., Ekers, R.D. & Goss, W.M. 1991, MNRAS, 249, 262
- (3) Bell, A.R. 1978, MNRAS, 182, 147
- (4)
- (5) Cantó, J., Raga, A.C. & Rodriguez, L.F. 2000, ApJ, 536, 896
- (6)
- (7) Chapman, J.M., Leitherer, C., Koribalski, B., Bouter, R. & Storey, M. 1999, ApJ, 518, 890
- (8)
- (9) Cotera, A., Erickson, E., Colgan, S., Simpson, J., Allen, D. & Burton, M. 1996, ApJ, 461, 750
- (10)
- (11) Eichler, D. & Usov, V. 1993, ApJ, 402, 271
- (12)
- (13) Figer, D.F. Najarro, F., Gilmore, D., Morris, M., Kim, S. S.; et al. 2002, ApJ, 581, 258
- (14)
- (15) Hartman, R.C. et al.: 1999, ApJS, 123, 79
- (16)
- (17) Lang, C.C., Goss, W.M. & Rodriguez, L. 2001a, ApJ, 551, L143
- (18)
- (19) Lang, C.C., Goss, W.M. & Morris, M. 2001b, AJ, 121, 2681
- (20)
- (21) Law. C. & Yusef-Zadeh, F. 2003, Astron. Nachr., Vol. 324, No. S1 (2003)
- (22)
- (23) Morris, M. & Yusef-Zadeh, F. 1989, ApJ, 343, 703
- (24)
- (25) Nord et al. 2003, in preparation
- (26)
- (27) Ozernoy, L.M., Genzel, R. & Usov, V. 1997, MNRAS, 288, 237
- (28)
- (29) Pohl, M. 1997, A&A, 317, 441
- (30)
- (31) Raga, A.C., Velazquez, P.F., Cantó, Masiadri, E. & Rodriguez, L.F. 2001, ApJ, 559 L33
- (32)
- (33) Yusef-Zadeh, F., Law, C., & Wardle, M. 2002b, ApJ, 568, L121
- (34)
- (35) Yusef-Zadeh, F., Law, C., Wardle, M., Wang, Q. D., A. Fruscione, Lang, C.C. & Cotera, A. 2002a, ApJ, 570, 665
- (36)
- (37)
- (38)
- (39)
| Frequency | Flux Density | Background | Deconvolved Size | Resolution | |
|---|---|---|---|---|---|
| (mJy) | (mJy beam-1) | () | () | ||
| 330 MHz | 914.8 | 4.9 | 7.113.5 | 712 | |
| 1.4 GHz | 157 | -0.2 | 4.86.2 | 3.23.5 | |
| 4.9 GHz | 110.1 | 1.7 | 4.86.6 | 3.13.8 | |
| 8.5 GHz | 14.84.8 | 8.8 | 5.58.7 | 6.67.8 |