Far-UV Emissions of the Sun in Time: Probing Solar Magnetic Activity and Effects on Evolution of Paleo-Planetary Atmospheres111Based on observations made with the NASA-CNES-CSA Far Ultraviolet Spectroscopic Explorer. FUSE is operated for NASA by the Johns Hopkins University under NASA contract NAS5-32985.
Abstract
We present and analyze Far Ultraviolet Spectroscopic Explorer (FUSE) observations of six solar analogs. These are single, main-sequence G0–5 stars selected as proxies for the Sun at several stages of its main-sequence lifetime from 130 Myr up to 9 Gyr. The emission features in the FUSE 920–1180 Å wavelength range allow for a critical probe of the hot plasma over three decades in temperature: K for the H i Lyman series to K for the coronal Fe xviii 975 line. Using the flux ratio C iii 1176/977 as diagnostics, we investigate the dependence of the electron pressure of the transition region as a function of the rotation period, age and magnetic activity. The results from these solar proxies indicate that the electron pressure of the stellar 105-K plasma decreases by a factor of 70 between the young, fast-rotating ( d) magnetically active star and the old, slow-rotating ( d) inactive star. Also, we study the variations in the total surface flux for specific emission features that trace the hot gas in the stellar chromosphere (C ii), transition region (C iii, O vi), and corona (Fe xviii). The observations indicate that the average surface fluxes of the analyzed emission features strongly decrease with increasing stellar age and longer rotation period. The emission flux evolution with age or rotation period is well fitted by power laws, which become steeper from cooler chromospheric ( K) to hotter coronal ( K) plasma. The relationship for the integrated (920–1180 Å) FUSE flux indicates that the solar far-ultraviolet (FUV) emissions were about twice the present value 2.5 Gyr ago and about 4 times the present value 3.5 Gyr ago. Note also that the FUSE/FUV flux of the Zero-Age Main Sequence Sun could have been higher by as much as 50 times. Our analysis suggests that the strong FUV emissions of the young Sun may have played a crucial role in the developing planetary system, in particular through the photoionization, photochemical evolution and possible erosion of the planetary atmospheres. Some examples of the effects of the early Sun’s enhanced FUV irradiance on the atmospheres of Earth and Mars are also discussed.
Subject headings:
stars: late-type — stars: atmospheres — stars: chromospheres — stars: coronae — stars: activity — ultraviolet: stars1. Introduction
The Sun’s magnetic activity is expected to have greatly decreased with time (Skumanich 1972; Simon, Boesgaard, & Herbig 1985; Dorren & Guinan 1994; Guinan, Ribas, & Harper 2002) as the solar rotation slows down because of angular momentum loss in the stellar wind and resultant reduction in magnetic dynamo-related activity. The study of the young Sun’s far-ultraviolet (FUV) fluxes using solar proxies provides important diagnostics for the state of the younger Solar System and the physics of the much more active early Sun. The comprehensive “Sun in Time” project, begun in 1988 (Dorren & Guinan 1994), focuses on the study of the long-term evolution of the outer atmosphere of an early G star, from the zero-age main sequence to the terminal-age main sequence. A crucial component of the program is a carefully-selected sample of nearby solar analogs (Güdel, Guinan, & Skinner 1997) with spectral types confined between G0-5 V and with well-determined physical properties (including temperatures, luminosities, and metal abundances). We have obtained extensive photometry () of these stars from ground-based observatories for over a decade to determine their rotation periods, investigate starspots and possible activity cycles. In addition, we have been able to estimate the stellar ages by making use of their memberships in clusters and moving groups, rotation period–age relationships, and, for the older stars, fits to stellar evolution models.
The sample of solar proxies within the “Sun in Time” program (see Guinan, Ribas & Harper 2002) contains stars that have masses close to 1 M☉ and cover most of the Sun’s main sequence lifetime from 130 Myr to 9 Gyr. Basically, the program stars have similar convective-zone depths and chemical abundances to those of the Sun and vary only by their age and rotation periods (), and hence dynamo-generated magnetic activity, i.e., chromospheric, transition region (TR), and coronal emissions. In essence, we use these one solar mass stars with between 2.7 and 35 days as laboratories to study and test solar and stellar dynamo theories by varying essentially only one parameter: rotation period.
The “Sun in Time” is a comprehensive and multi-frequency program that addresses a variety of topics: study of short- and long-term magnetic evolution; physics and energy transfer mechanisms of the chromosphere, transition region (TR) and corona; evolution of the spectral irradiances of the Sun and their effects on paleo-planetary environments and atmospheres. To this end we utilize observational data spanning almost the entire electromagnetic spectrum, which allows us to probe the structure of stellar/solar atmospheres. The FUV has not been readily accessible until the successful launch of the Far Ultraviolet Spectroscopic Explorer (FUSE). FUSE allows a critical probe of the hot plasmas over nearly three decades in temperature: e.g., K for the H i Lyman series (Ly, Ly, …) through O vi 1032, 1038 at K, and the recently identified Fe xviii 975 coronal emission feature at K. Several of the strongest emission features, such as C iii 977,1176 and O vi 1032,1038, originate in TR plasmas, and are pivotal for understanding the mechanisms of chromospheric and coronal heating. Thus, spectrophotometry with FUSE fills the energy gap between IUE/HST (1160–3200 Å) and EUVE (80–720 Å) to yield a complete and comprehensive picture of a solar-type star’s atmosphere at different ages and rotation periods.
In this paper we present and analyze FUSE observations of six bright solar analogs that span a wide range of rotation periods (and ages) from 2.7 days (130 Myr) to 35 days (9 Gyr). The stars, whose properties are listed in Table 1 along with the Sun’s, are: EK Dra, UMa, Cet, Com, Hyi, and 16 Cyg A. The present study focuses on two particular aspects of the “Sun in Time” program that can be effectively addressed with FUV observations: 1.) The flux ratios between the C iii 1176 and C iii 977 lines (both within the FUSE spectral range) yield empirical measures and estimates of the electron pressure () of the TR; 2.) Integrated fluxes for selected emission lines can be used to study the evolution of the solar FUV irradiances at different ages and rotation periods.
2. Observations
FUV observations of the six targets discussed here were obtained with FUSE. The FUSE instrument consists of four spectroscopic channels (LiF1, LiF2, SiC1, and SiC2) that cover a combined wavelength range 905–1187 Å. Detailed information on the FUSE mission and its on-orbit performance are provided by Moos et al. (2000) and Sahnow et al. (2000).
The observations of the targets were secured during FUSE Cycles 1, 2 and 3. Spectra of three stars ( Cet, Com, and Hyi) were taken as part of the Guest Investigator program A083 (P.I. Guinan), one star ( UMa) was observed as part of the program B078 (P.I. Guinan), and to additional stars (EK Dra and 16 Cyg A) were acquired within program C102 (P.I. Guinan). The large aperture (LWRS) was employed in all cases to minimize photon losses due to telescope misalignments, and this caused a fairly severe contamination of day-time spectra from geocoronal emission lines and scattered solar radiation. Information on the dates and exposure times of the observations is provided in Table 2.
The FUSE data were retrieved from the Multimission Archive at Space Telescope (MAST), and then re-calibrated with CALFUSE 2.0.5222http://fuse.pha.jhu.edu/analysis/calfuse.html. For each star, the time-tagged data for the sub-exposures were combined into a single dataset. The spectral extraction windows were individually aligned to ensure correct extraction of the stellar spectra. We employed the CALFUSE 2.0.5 event burst screening and default background subtraction. The data were then calibrated and screened separately for orbital night and day, allowing us to estimate any contamination of the stellar spectra from “airglow” and scattered solar light. The scattered light was found to be negligible compared to the stellar source, except for the faint FUV target 16 Cyg A, which could suffer from some contamination especially in the O vi features.
The calibrated spectra are oversampled so they were re-sampled by binning over four wavelength intervals, thereby increasing the signal-to-noise ratio. A comparison of the emission line fluxes from different channels, e.g., C iii 977 Å SiC2A and SiC1B, provides an independent check on data artifacts, and whether the star was in both apertures for the same length of time.
3. Analysis
For illustration we show the extracted spectrum of Cet in Figure 1. Note that we only show the night-time data that presents less contamination by terrestrial airglow and geocoronal emission. Thus, all features in Figure 1 are of stellar origin, although the H i Lyman series still has some geocoronal contamination. The FUV spectra of the other four targets are qualitatively similar, and only the spectrum of EK Dra and UMa are somewhat noisier. For these two stars the increased noise arises from the failure of the SiC2A and LiF2A observations and the consequent use of the less sensitive segment B of detector 1 (SiC1B and LiF1B) for those parts of the spectra. As can be seen in Figure 1, the continuum level is negligible and the flux is in the form of emission lines. Individual channels are represented in the figure because the FUSE effective area is heavily dominated by only one channel at each wavelength. In this case, SiC2A, LiF1A, and LiF2A spectra are shown in the upper, central, and lower panels, respectively.
Studies of FUSE observations of late-type stars, AB Dor and Capella, have been presented by Ake et al. (2000) and Young et al. (2001), respectively. The authors carried out thorough investigations of the chromospheric and TR emission features in the FUSE wavelength range and provided identification spectra. A comparison with our sample spectrum in Figure 1 indicates a striking resemblance to these spectra, except for small to moderate changes in the relative strengths of some features. We have thus been able to identify the most significant features in our spectra by using the results of Ake et al. (2000) and Young et al. (2001). Among the strongest FUV emission lines in coronal spectra of late-type stars are the C iii singlet at 977.020 Å, the C iii multiplet around 1176 Å, and the O vi doublet at 1031.925 Å and 1037.614 Å. We focus here primarily on the analysis of stellar features that are not significantly affected by geocoronal contamination and day-time spectra can be used without any loss of accuracy. We thus combined the night-time and day-time data by using a exposure-time weighting scheme.
All of our FUSE spectra show clean profiles for these lines that permit reliable integrated flux measurements, which were carried out by means of NOAO/IRAF tasks. Different methods (plain addition, Gaussian fitting) were employed to measure the integrated line fluxes, study the associated uncertainties, to check the line profiles, and also to assess the possible presence of interstellar absorption (see below for further discussion). The total integrated fluxes for each star and their intrinsic uncertainties (random errors) are provided in Table 2.
The ratio of the fluxes for the C iii 1176 and 977 emission features is provided in Table 6. This ratio, which yields an excellent electron pressure/density diagnostic, is the topic of discussion for §5. The ratio of the two O vi features (1038/1032) is not provided in Table 6 but it is in all cases very close to 1:2. This is the value expected for an effectively-thin plasma where the flux ratio is proportional to the ratio of the collision strengths for the two transitions, which for O vi is very close to 1:2 (Zhang, Sampson, & Fontes 1990).
Plasma model fits to extensive X-ray observations of the three youngest stars in the sample (EK Dra, UMa, and Cet) indicate the presence of high-temperature coronal material (Güdel et al. 1997). As discussed by Feldman & Doschek (1991), Young et al. (2001) and Redfield et al. (2003), coronal emission lines of highly-ionized ions arising from forbidden transitions are expected in the FUSE wavelength range. A coronal Fe xviii forbidden line at 974.85 Å was identified for the first time in FUSE spectra of Capella (Young et al. 2001). FUSE spectra of EK Dra, UMa and Cet also clearly show this emission feature (see Figure 2 for an example). Very recently, Redfield et al. (2002) have reported the detection of a coronal Fe xix 1118 emission line in the FUSE spectra of several nearby cool stars. The FUSE spectra of EK Dra, UMa and Cet show weak Fe xix 1118 features barely above the noise level. As pointed out by Redfield et al. (2003), this line can be corrupted by a nearby C i multiplet. Because of the poor S/N of the flux measurements for Fe xix 1118 and concerns with nearby line contamination have focused only on the clean Fe xviii 975 line as a tracer of the hot coronal plasma. Integrated flux measurements have been carried out using the same method described above and are reported in Table 2. No trace of this feature is detected for the older stars in the sample down to the noise level of the spectra, and flux upper limits are therefore provided in Table 2.
In addition to integrating the fluxes, we also obtained line centroid positions and FWHM measurements for the selected features in Table 2. The motivation for such measurements was the search for possible line shifts or broadenings that could arise from plasma outflows or extended material. A critical point when measuring line shifts is an accurate wavelength scale. Aperture centering problems caused by misalignments may result in systematic velocity shifts among the different channels. Redfield et al. (2002) used ISM features to derive the absolute wavelength scale of their spectra. In our case ISM absorption features are not measurable and we followed a different approach. Namely, we aligned the O vi 1032,1038 doublet, which is available in all four channels, using the LiF1 channel as the reference (this is the channel used for guiding). This procedure should ensure relative velocities accurate to 5–10 km s-1 in all channels. The velocity corrections were generally quite relevant with values up to 40 km s-1. With a corrected wavelength scale, we measured the line centroids and velocity shifts for several features. The results are given in Table 3. No significant line shifts with respect to the photospheric velocity were observed down to the precision of the measurements. The expected 10 km s-1 redshift of TR features (e.g., Redfield et al. 2002) is only observed in the most active star of the sample, EK Dra. The rest of the stars actually exhibit slightly blueshifted TR features, albeit with very low statistical significance.
FWHM measurements for all the emission lines in Table 2 yielded relatively small widths of Å, which are equivalent to velocities of km s-1. Only EK Dra, the most active of our targets, was found to have broader line profiles. In this case, the measured FWHM was about 0.35 Å or 110 km s-1. (The actual rotational velocity of this star is km s-1.) A closer inspection of the C iii 977 and O vi 1032 line profiles revealed extended line wings in some of the targets. This is a well-known phenomenon (see, e.g., Linksy & Wood 1994) that is usually modeled by assuming double Gaussians with components of different widths. For the stars in our sample, only EK Dra shows unambiguous evidence of a broad component, whereas UMa and Cet show somewhat extended line wings but the two-component fits yielded inconclusive results. Two-Gaussian fits to the O vi 1032 line of EK Dra indicate a ratio between the broad component flux and the total flux of 0.38. Thus, extended line profiles appear to correlate with stellar activity (and age), in agreement with the results of Redfield et al. (2002) and Wood, Linsky, & Ayres (1997). The presence of broad and narrow components in high-temperature lines is still not well understood. A plausible model (Wood et al. 1997) suggests that these may arise from high-velocity nonthermal motions during magnetic reconnection events (microflares).
3.1. Interstellar absorption corrections
Before analyzing and modeling the line integrated fluxes, the possible effects of interstellar medium (ISM) absorption must be investigated. The C iii 977 line and the H i Lyman series lines are the most sensitive to attenuation effects because of possible superimposed ISM absorption. As shown in Table 1, the stars in the sample are nearby and lie within 7–34 pc of the Sun and have negligibly small values of from ISM dust. However, even for the small ISM column densities at these close distances ( cm-2; Redfield & Linsky 2000), one expects some absorption in the lines mentioned above because they are among the strongest ISM features in the entire spectrum. Unfortunately, both the resolution and S/N of our FUSE spectra are not sufficiently high for reliable direct estimations of the (expected weak) ISM FUV absorptions. We therefore adopted an alternative procedure and carried out indirect determinations of the flux corrections for the individual spectral features.
To estimate the ISM column densities in the line of sight of our targets we made use of the local ISM observations and model by Redfield & Linsky (2002). These authors analyzed high-resolution observations of Fe, Mg and Ca features to determine column densities of these elements toward stars within 100 pc of the Sun. One of our targets, Cet, is included in Redfield & Linsky’s study and thus direct ISM measurements are available. For the other five targets we adopted the local ISM characteristics of neighboring stars with direct measurements: DK UMa for EK Dra and UMa, HZ 43 for Com, Dor for Hyi, and Cyg for 16 Cyg A. The C abundance was computed from the observed column densities of Mg ii and Ca ii and local ISM log abundances (relative to H) of , and for C, Mg ii, and Ca ii, respectively, from Wood et al. (2002b) and Redfield & Linsky (2000). The C iii column density was subsequently obtained by adopting the local ISM ionization ratio of C iii/C ii0.02 from Wood et al. (2002b). (Note that C ii is the dominant ionization species in the ISM.)
The ISM absorption equivalent widths were estimated from the C iii column densities and the transition oscillator strengths through the curve of growth method (see Spitzer 1978). For the C iii 977 transition, despite its strength, the ISM absorption features for all our targets were found to be relatively weak (unsaturated) because of the small column densities. Then, using the ISM component velocities and the observed C iii line profile, we calculated the fraction of stellar flux absorbed by the ISM. Our results indicate that the flux corrections for the C iii 977 line are very small (3-7%) for EK Dra, UMa, Cet, and Com, and somewhat larger (11-13%) for Hyi and 16 Cyg A.
3.2. The H i Lyman series and total FUSE fluxes
In addition to the features mentioned above, we attempted an estimation of the total integrated fluxes within the FUSE bandpass (920–1180 Å). However, even when restricting to night-time spectra, contamination of the stellar H i Lyman features by geocoronal emission is very significant. This is because FUSE observations in this program were obtained through the large aperture to ensure, where possible, that the important C iii 977 Å emission line was detected in the SiC channels. As a consequence, the Lyman geocoronal emission is much broader than for the medium aperture, reaching about km s-1 near Ly. This emission overlies and in most cases completely dominates the stellar emission profile. The stellar signal is expected to be a self-reversed emission feature with a dark ISM absorption core.
To estimate the stellar fluxes for Ly we took the difference between the night and day spectra, and assumed that the shape of geocoronal emission remains constant. A fraction of this geocoronal emission was then subtracted from the night spectra so that the residual flux at the location of the ISM feature is consistent with the flux predicted by a simulation of the stellar profile attenuated by the ISM. If emission peaks remained in the subtracted spectrum we assummed that the remaining signal was stellar. Only Cet and UMa had any significant signal to satisfy these requirements. To estimate the shape of the underlying stellar emission profile, required to estimate the total stellar flux, we used the functional form of the “universal” profile for strong partially coherent scattered lines derived by Gayley (2002). This allowed us to use the observed flux in the wings, which is relatively uncontaminated by geocoronal emission, to extrapolate towards line center and provide a total flux estimate. The model stellar profile was then attenuated by an ISM model (described above) and convolved with a PSF of to mimic the FUSE spectral resolution. From the fits we obtained total Ly fluxes of 4.010-13 erg s-1 cm-2 and 2.410-13 erg s-1 cm-2 for UMa and Cet, respectively. Given the uncertainty of the spectra, the adopted ISM model and the assumed stellar profile shapes, we expect that the accuracy of estimated stellar flux is no better than a factor of 1.5–2. Future observations of H Ly and MDRS observations of Ly are warranted and required to improve the quantification of the total stellar FUV emission.
A correction to account for the rest of the H i Lyman series was derived by comparison with SOHO SUMER spectra for the Sun. We roughly estimate that the total flux contributed by the H i Lyman lines within the FUSE bandpass is about 1.6 times the Ly flux. Then, the total flux in the range 920–1180 Å was calculated by adding the contributions from the individual features discussed above and the integrated H i Lyman series. We obtained values of 10.510-13 erg s-1 cm-2 and 8.710-13 erg s-1 cm-2 for UMa and Cet, respectively. Our integrations indicate that the H i Lyman features in this wavelength range (Ly, Ly, etc) are important contributors (40–60%) to the total flux of both UMa and Cet. This is also presumably the case of the remaining solar-type stars in the sample but the weak stellar signal and strong geocoronal contamination of the FUSE observations prevented us from carrying out reliable measurements.
4. Emission line fluxes in the FUV
One straightforward application of the measured line fluxes presented in Table 2 is the analysis of their evolution along the main sequence of a one solar mass star. To compare the absolute irradiances, we scaled the observed fluxes to surface fluxes at a radius of 1 R⊙. To estimate the actual radius of each target we made use of the stellar luminosity (computed from the Hipparcos distances and apparent magnitudes) and effective temperature (obtained from spectroscopic measurements in the literature). The radii of the targets are included in Table 1 and using these we calculated the equivalent flux for a star of 1 R⊙ in radius. As can be seen in Table 1, the radii of all stars but Hyi and 16 Cyg A are very close to 1 R⊙ (within 5-8%) and the correction was typically very small. The situation is somewhat different for Hyi because of its advanced evolutionary stage and its mass being about 1.1 M⊙. In this case the flux correction was quite significant.
The adopted final stellar surface fluxes for the four emission features studied are provided in Table 4. Also in this table are the total integrated FUV fluxes in the FUSE wavelength range (920–1180 Å) for two of the targets ( UMa and Cet). All fluxes have been corrected for ISM absorption (see §3.1 and 3.2). Before proceeding with a numerical analysis of these data, an illustrative visual impression of the surface flux changes for the targets stars can be seen in Figure 3. We have plotted details of the spectra (flux corrected to the stellar surface) in a narrow 10-Å wavelength interval that contains the O vi doublet at 1032,1038. A rough comparison of the line variations as a function of stellar age does reveal a clear and definite trend or decreasing strength with increasing age.
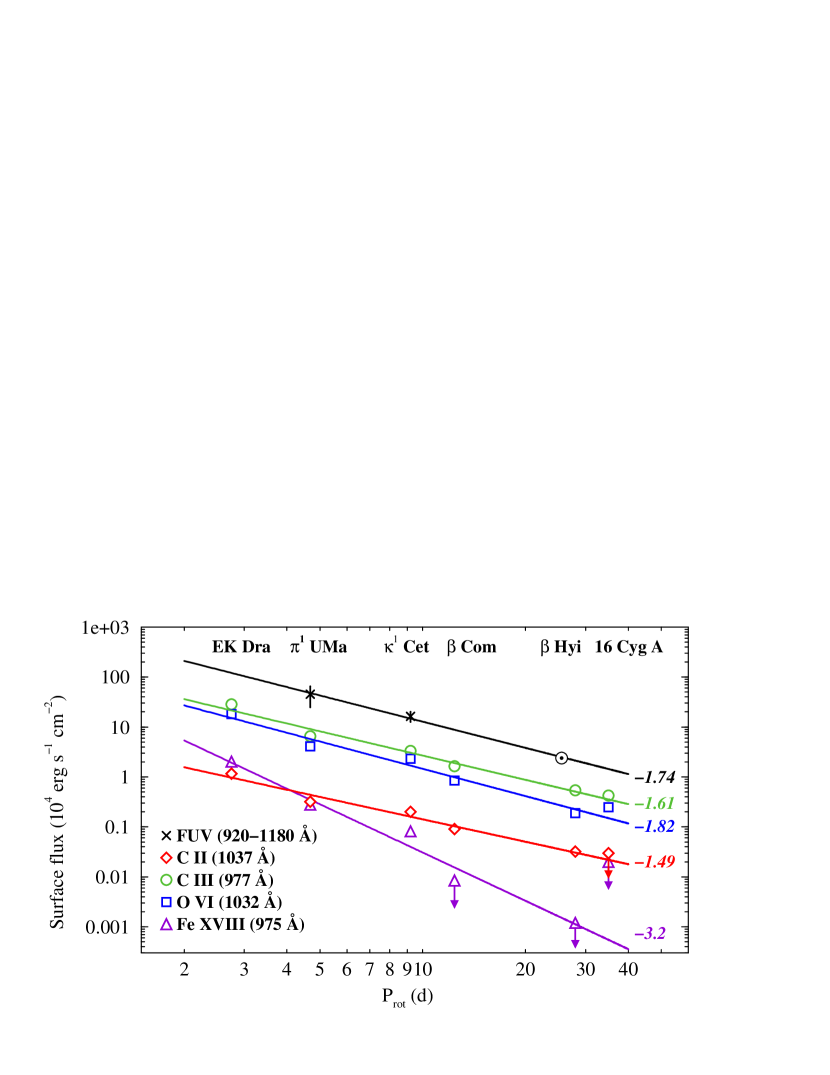
For a more quantitative analysis we used the integrated surface fluxes in Table 4, which are plotted in Figure 4 as a function of the stellar rotation period. The features represented are C ii 1037, C iii 977, O vi 1032, and Fe xviii 975. The typical peak formation temperatures of the C ii, C iii, O vi, and Fe xviii ions are approximately K, K, K, and 6 MK, respectively (Arnaud & Rothenflug 1985). Thus, these lines probe a wide interval of plasma temperatures. As can be seen, the newly-detected coronal line of Fe xviii is very important to our investigation because it extends the coverage to the hot plasma component. Note the much smaller surface fluxes of Hyi with respect to the younger solar analogs for all the features studied. Roughly, Hyi’s flux levels are comparable to, or slightly smaller than, those of today’s Sun. In addition, Figure 4 also depicts the total integrated FUV fluxes in the FUSE bandpass for UMa and Cet.
The random measurement errors affecting the fluxes in Figure 4 are discussed in §3. However, additional systematic uncertainties can be caused by the intrinsic stellar activity cycle. From an analogy with the Sun, we expect peak-to-peak cycle amplitudes in the FUV of about 30–50%. Since the target stars are observed at different stages of their activity cycles, these activity variations can be a source of scatter in the irradiance plot. Fortunately, this activity-related scatter is rendered negligible by the large relative differences between the fluxes of the targets (with factors of over 30 in flux).
The fluxes of Figure 4 can be fit to good accuracy with power laws of different slopes. These are listed in Table 5, which contains the power-law slopes using both rotation period () and age as independent variable. Note that only two FUSE measurements are available for the total flux within 920–1180 Å. To constrain the fit we used the flux values for the quiet sun obtained through integration of the solar reference spectrum by Heroux & Hinteregger (1978) in the FUSE wavelength window. The resulting surface flux was 2.4104 erg s-1 cm-2.
Interestingly, the slopes not only change from line to line, but also they show a clear trend. The power law becomes steeper as we move from cooler to hotter material. The most extreme trend is that of the flux for the coronal ion Fe xviii. The results indicate that the flux is reduced by a factor of over 1000 when the rotation period increases ten-fold. To serve as a reference, plasma of similar (or maybe slightly lower) temperature is probed when analyzing fluxes in the X-ray domain. Güdel et al. (1997) studied X-ray fluxes (0.1–2.4 keV) of about a dozen solar analogs covering also a wide period range. A power law fit to the data yielded a slope of , which is in very good agreement with our value for the decrease of the Fe xviii flux.
The results indicate that the emission from hotter plasma decreases more rapidly than that from cooler plasma. Analogous behavior was observed by Güdel et al. (1997) when comparing the emission measures derived from observations in hard and soft X-rays. A possible scenario to explain the steeper flux decrease for hotter plasma could be the weakening of the stellar dynamo as the stars spin down with age and the corresponding decline in the efficiency of heating mechanisms (e.g. flares) and in the strength of magnetic fields that confine the gas.
It should be noted that our program stars, except for age and rotation period, have similar properties to the Sun (mass, radius, effective temperature, metal abundance). Importantly, these stars should all have similar convection zone depths, which together with rotation, is an important parameter in most modern magnetic dynamo theories. Thus, the stars in our sample can serve as laboratories for testing the generation (and dissipation) of magnetic dynamo-related energy and heating in solar-type stars where rotation (angular velocity) is the only important variable. The observed power law dependencies on rotation of the various emission line fluxes should be important as inputs for testing and constraining stellar/solar dynamo theories.
5. Electron pressures in the transition region
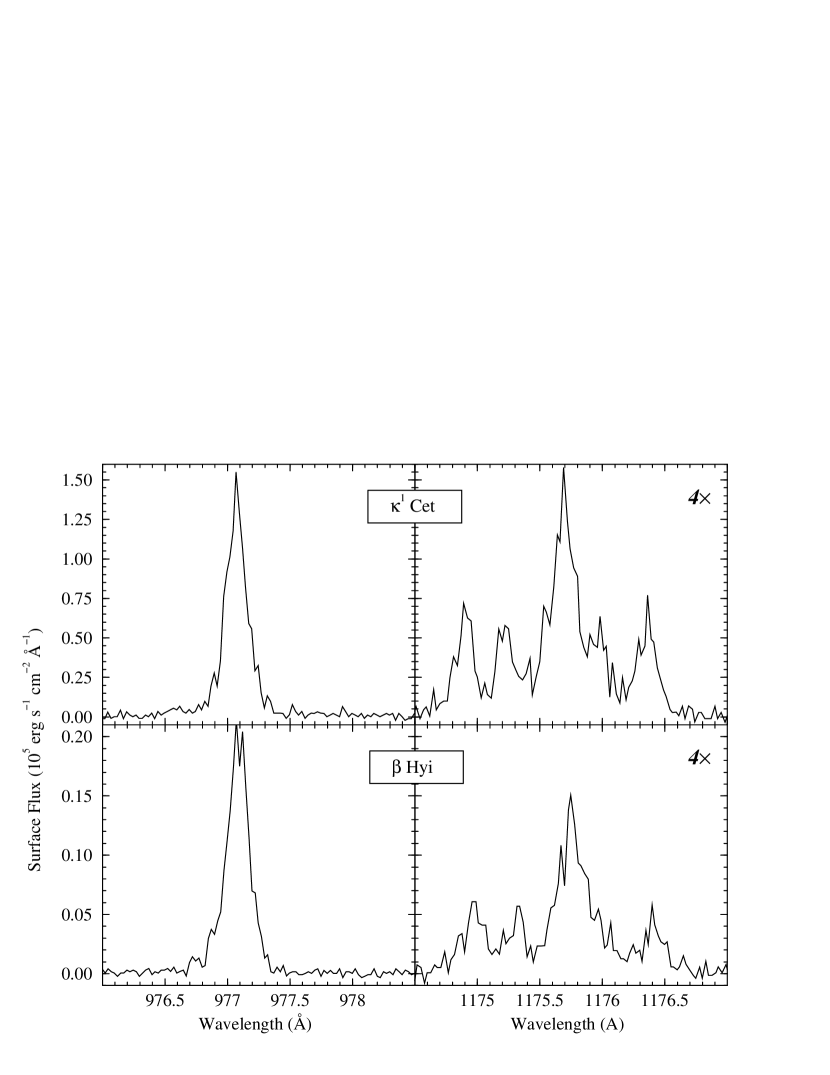
The C iii emission line at 977 Å and the C iii multiplet at 1176 Å occur in the FUSE wavelength region. The ratio of the C iii 1176/977 emission line fluxes has long been recognized to be a sensitive diagnostic for measuring the electron pressure () of hot (60,000 K), optically-thin plasmas (e.g., Dupree, Foukal, & Jordan 1976; Keenan & Berrington 1985). FUSE offers an excellent opportunity to exploit the full potential of this important diagnostic () because both C iii features can be measured simultaneously. Furthermore, unlike the UV C iii] 1909 line, these FUV features are not contaminated by the stellar continuum or nearby line emissions. Details of the C iii 977 and 1176 emission features for two of the targets in the sample are shown in Figure 5.
To compute ratios we adopted a simple C iii model which includes the first 10 fine-structure levels. The energy levels are taken from Moore (1970), the highest level in the model being at . The electric dipole oscillator strengths are taken from the compilation of Allard et al. (1990), except for transitions calculated by Tachiev & Froese Fischer (1999; 2002, priv. comm.) and Fleming, Hibbert, & Stafford (1984). The electric quadrupole and magnetic dipole oscillator strengths are from Nussbaumer & Storey (1978) and Tachiev & Froese Fischer (1999) and the and magnetic quadrupole strengths are from Shorer & Lin (1977) and Tachiev & Froese Fischer (1999), respectively. The electron collision strengths are taken from Berrington (1985) and Berrington et al. (1985). The proton collision rates for transitions within are from Ryans et al. (1998) and within are from Doyle, Kingston, & Reid (1980). We solved the statistical equilibrium equations, under the assumption that the plasma is in steady state, with no photo-excitation from external sources. The ratios presented here are computed under the assumption that all the C iii transitions are optically thin. We have also computed the ratios under optically thick conditions using escape probabilities with hydrogen columns of and assuming solar abundances (Grevesse & Sauval 1998). We find that is quite insensitive to optical depth effects under these conditions, in agreement with the findings of Bhatia & Kastner (1992).
The 1176/977 flux ratio of Be-like C iii is well known to be sensitive to both electron density and temperature and is therefore sensitive to the shape of the emission measure distribution between and 4.9. The density sensitivity arises from collisional thermalization of the lower levels of the 1176 multiplet () which connect to the ground state () by an intercombination electric dipole and a weak magnetic quadrupole transition at 1908.7 Å and 1906.7 Å, respectively. The contribution functions for 1176 Å and 977 Å contain the product of the collisional excitation which increases with , the ionization balance of C iii which peaks near (Arnaud & Rothenflug 1985), and the shape of the emission measure distribution between and 4.9 which is a strong declining function of , e.g., Jordan et al. (1987). The peak contribution is expected to lie below . For example for the Sun, Judge et al. (1995) find a peak as low as for the 977-Å transition, while MacPherson & Jordan (1999) find . For the solar analog transition regions, we consider that the C iii emission lines are formed at a constant electron pressure, and we derive the ratio as a function of electron pressure rather than at a (less realistic) single temperature.
The emission measure distribution at C iii temperatures may change as a function of stellar magnetic activity. However, as pointed out by Jordan (2000), both the analyses of main sequence stars by Jordan et al. (1987) and the similarity of the C iv/C ii UV emission line ratios for a wide range of active coronal stars (Oranje 1986), indicate that the shape of the emission measure distribution in the C iii forming region approximately follows the shape of the inverse of total radiative loss curve between and 5.3. If the density sensitivity of the ionization balance and abundance gradients can be neglected, then the relative electron pressures derived for our sample should be reliable.
To quantify the effects of assuming differential emission measure distributions (DEM) with different slopes, we adopt a form
| (1) |
where and are the electron and hydrogen densities, respectively, and is the radial coordinate. Here we assume that the shape of DEM is similar to the emission measure over the C iii 977 Å formation region. Note that is a reasonable approximation to the radiative power-loss function for this temperature range. For each pressure we integrate over temperature from to 5.3, where the fractional abundance of C iii exceeds 0.01, for each DEM to derive the total fluxes and derive . In Figure 6 we show the ratio for =1.5, 2.0, and 2.5. This figure shows that the resulting ratio is not too sensitive to uncertainties in the shape of the emission measure distribution. Indeed, uncertainties in the collision strengths lead to greater uncertainties in the electron pressure.
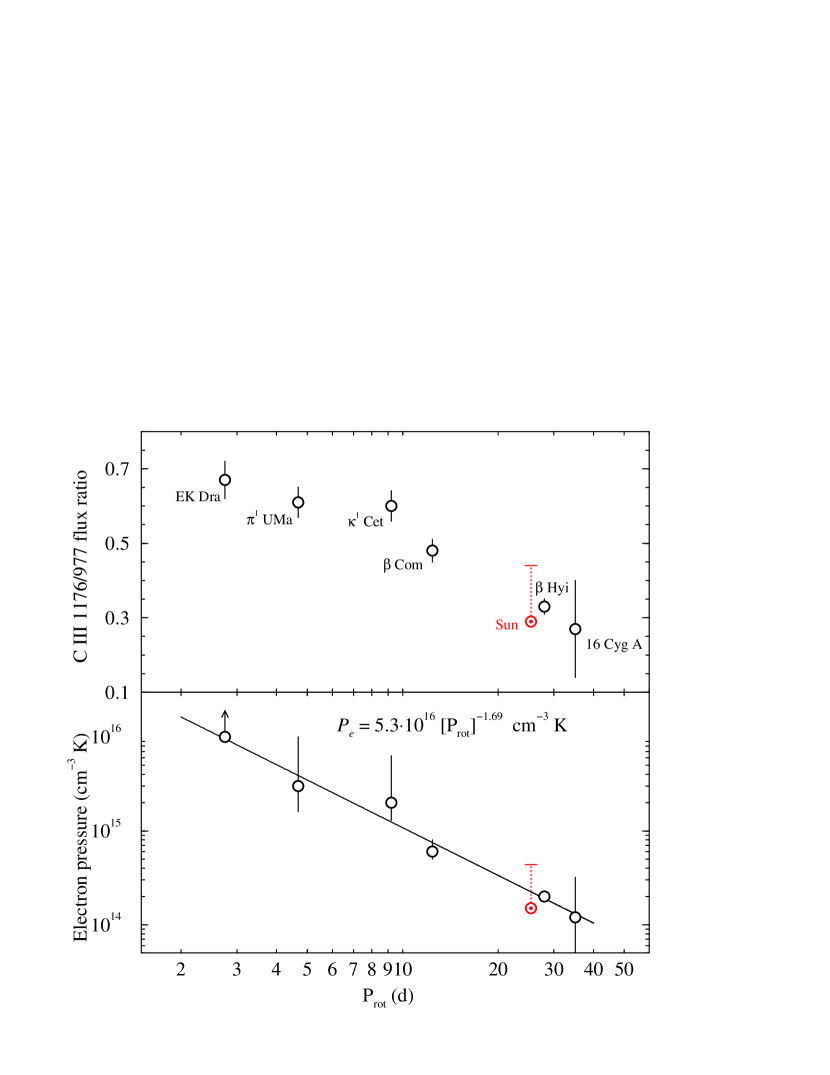
The empirical C iii ratios computed for the six stars in the sample are given in Table 6. Also provided are the values corrected for ISM absorption. From these one can estimate the electron pressures through the relationship discussed above. When doing so, we obtain values between and cm-3 K, approximately. The actual electron pressures computed for each of the stars in the sample are given in Table 6. Both the values and the derived plasma electron pressures are plotted in in Figure 7 as a function of the stellar rotation period. For comparison, the value for the quiet Sun was determined to be =0.29 (Dupree, Foukal, & Jordan 1976), and the active Sun (measured in solar active regions such as sunspots) has a C iii ratio of =0.44 (Noyes et al. 1985; Doyle et al. 1985). Note that the values determined for our stars correspond to the integrated stellar disk average, thus including both active and inactive regions, weighted towards region of large areal filling factor and high . Interestingly, the observed data for the target stars suggest a strong correlation between the activity level of the star (= age or ) and or .
The elusive density of the TR has been probed for the first time along the evolutionary path of a solar-type star, from ZAMS to TAMS. Our results show that the electron pressure of the TR decreases monotonically as the star spins down (and magnetic dynamo activity decreases). From the fit in Figure 7 we infer a power-law relationship with a slope of . This suggests that the electron pressure of the solar TR may have decreased by about a factor of 40 since the beginning of its main sequence evolution. A likely explanation for the greater plasma electron pressure for the young and active (rapidly rotating) stars is a stronger magnetic confinement of the emitting material.
Most notably, the power-law slope for the electron pressure and the C iii 977 Å flux are very similar, namely . Note, however, that the flux power-law relationship has been computed from the integrated flux and it thus represents an average over the stellar surface. If, however, the emitting TR plasma only occupies a fraction (; ) of the surface, known as filling factor, then the specific flux emitted by the active regions will be correspondingly larger. The pressure power-law does not depend on the area factor if only one atmospheric component dominates. Thus, assuming that the same fraction of C iii 977 Å is emitted over the same interval for our sample then we can adopt
| (2) |
where represents the surface integrated flux. Using the power-law relationships derived above, one can write
| (3) |
as a function of the rotation period. Thus, with empirically measured filling factors for the solar proxies or with a reliable relationship between and (or Rossby number333The Rossby number (), which is proportional to the rotation period of the star and inversely proportional to the turnover time at the base of the convective zone, is commonly used as a measure of the activity level of a star. For our targets, which have very similar masses and spectral types, one can safely assume that the Rossby number is simply proportional to .) the relationship above can yield an estimate of the dependence of the electron temperature gradient with age. For example, using the empirical fit of Montesinos & Jordan (1993) that relates the magnetic filling factor with the Rossby number, we can write for our solar proxies
| (4) |
and thus, the temperature gradient can be expressed as
| (5) |
A representation of the relative variations of the temperature gradient, the electron pressure and the specific C iii 977 flux (i.e., flux divided by filling factor) are provided in Figure 8. Note that these relationships are only represented for rotation periods shorter than that of the Sun, where the filling factor is better defined. Strikingly, the specific C iii 977 flux remains relatively constant with rotation period: as the filling factor increases, the total stellar flux increases correspondingly. However, since the electron density increases with decreasing rotation period, the temperature gradient must also increase to keep the specific flux relatively constant. It is worth noting that, given the large change in the implied temperature gradient across the sample, one or more of the several assumptions on which Eq. 3 is based may no longer hold.
6. FUV irradiances and effects on paleo-planetary atmospheres
The relationships obtained from the solar proxies indicate that the total solar FUSE/FUV flux was about twice the present value 2.5 Gyr ago and about 4 times the present value about 3.5 Gyr ago. Note also that the FUSE/FUV flux of the Zero-Age Main Sequence Sun could have been stronger than today by as much as 50 times.
As discussed by Canuto et al. (1982, 1983), Luhmann & Bauer (1992), Ayres (1997), Guinan, Ribas & Harper (2002) and others, the strong FUV and UV emissions of the young, more active Sun could have played a major role in the early development and evolution of planetary atmospheres – especially those of the terrestrial planets. The expected strong X-ray–UV irradiance of the young Sun can strongly influence the photochemistry and photoionization (and possible erosion) of the early planetary atmospheres and even surfaces (in the case of Mercury, Moon and Mars) and also may play a role in the origin and development of life on Earth as well as possibly on Mars. For example, Canuto et al. (1982, 1983) discuss the photochemistry of O2, O3, CO2, H2O, etc, in the presumed outgassed CO2-rich early atmosphere of the Earth. Ayres (1997) discusses the effect of the young Sun’s increased ionizing X-ray–UV flux, and possible accompanying enhanced solar wind, on the erosion of the early atmosphere of Mars about 3–4 Gyr ago. Also, Lammer et al. (2003) utilize irradiance data from the “Sun in Time” project and solar-wind estimates by Wood et al. (2002a) to evaluate the mechanisms for loss of water from Mars and study the implications for the oxidation of the Martian soil.
Similarly, our data can also provide insights into the so-called Faint Sun Paradox. The paradox arises from the fact that standard stellar evolutionary models show that the Zero-Age Main Sequence Sun had a luminosity of 70% of the present Sun. This should have led to a much cooler Earth in the past while geological and fossil evidence indicate otherwise. A solution to the Faint Sun Paradox proposed by Sagan & Mullen (1972) was an increase of the greenhouse effect for the early Earth. The gases that have been suggested to account for this enhanced greenhouse effect are carbon dioxide (CO2), ammonia (NH3) or methane (CH4). However, recent results for atmospheric composition of the early Earth (Rye, Kuo, & Holland 1995) are in conflict with the high levels of CO2 and H2O needed to explain the stronger greenhouse effect. Moreover, ammonia is a likely candidate except that it is quickly and irreversibly photodissociated. However, Sagan & Chyba (1997) proposed that hydrocarbon-based aerosols could shield the ammonia from damaging incoming solar radiation. Another alternative explanation for the enhanced greenhouse effect is from atmospheric methane as discussed by Pavlov et al. (2000). Methane is a very strong greenhouse gas (103–104 times stronger than CO2) and the necessary amount of CH4 could have been provided by methanogenic bacteria in the proposed early Earth’s reducing atmosphere.
In addition to the stronger greenhouse effect, the expected higher X-ray–UV irradiance of the young Sun should heat up the upper atmosphere of the early Earth. Although the stronger high-energy solar radiation cannot by itself explain the Faint Sun Paradox, the photoionization and photodissociation reactions triggered could play a major role in what greenhouse gases are available. For example, the high levels of FUV-UV radiation of the young Sun could strongly influence the abundances of ammonia and methane in the pre-biotic and Archean planetary atmosphere some 2-4 Gyr ago. Similarly, the photochemistry and abundance of ozone (O3) is of great importance to study life genesis in the Earth. Ozone is an efficient screening mechanism for the enhanced UV radiation of the young Sun, thus protecting the emerging life on the Earth’s surface.
To fully evaluate the influence of FUV radiation in the developing planetary system one must first estimate the flux contribution of the strong H i Ly feature, which is not included in the FUSE wavelength range. Preliminary estimates using HST/STIS spectra indicate that Ly 1216 contributes a significant fraction (up to 90%) of the total FUV flux. Further observations and measurements in the near future will allow us to obtain this missing piece of information and complete the FUV irradiance study.
7. Conclusions
In this study we have utilized FUV spectra acquired with the FUSE satellite to investigate the FUV emission characteristics of solar analogs. Our six targets are well-known G0–5 solar-type stars especially selected to serve as proxies for the Sun at different ages, nearly covering the entire solar main sequence lifetime from 130 Myr to 9 Gyr. Here we have focused on two aspects of the “Sun in Time” program which are the study of TR plasma electron pressures (using C iii 1176/977 line ratio diagnostics) for stars that differ only in rotation period (and age) and the evolution of irradiances for specific features covering emitting plasma with temperatures from K to K.
To analyze the plasma density of the TR we have used a theoretical relationship between the ratio of C iii 1176 and 977 emission line fluxes and the electron pressure () of the material responsible for the emission. Fortunately, both C iii transitions are within the FUSE wavelength range so that they can be measured simultaneously. Our results indicate a power-law relationship between the electron pressure and the stellar rotation period and overall magnetic-related activity (both related to age). The slope of this relationship has been found to be 1.7, which suggests that the electron pressure of 105-K material in the Sun has decreased significantly since the beginning of its main sequence evolution. The higher values of electron pressure found for the more active stars are best explained by stronger magnetic confinment of the TR plasma.
The measured fluxes for four emission features – C ii 1037, C iii 977, O vi 1032, and Fe xviii 975 – were referred to a radius of 1 and also corrected for ISM absorption whenever necessary. The typical formation temperatures of the studied features are K, K, K, and 6 MK, respectively. Our analysis indicates that the evolution of these fluxes with stellar rotation period or age can be accurately fit with power-law relationships of different slopes. Interestingly, the slopes not only change from line to line, but also they show a clear trend: The power law becomes steeper as we move from cooler to hotter plasmas, with the most extreme trend being that of the coronal ion Fe xviii. Also, the evolution total integrated flux in the FUSE wavelength range (920–1180 Å) can be fit with a power-law relationship with a slope of 1.7, which indicates a factor of 50 flux decrease along the solar main sequence evolution as the magnetic dynamo activity decreases.
The high levels of FUV line emission fluxes (and related high-energy emission) of the early Sun could have played a crucial role in the photochemistry and photoionization of terrestrial and planetary atmospheres. To address this point we are completing spectral irradiance tables covering 1 Å to 3200 Å for our program stars that can serve as input data for evolution and structure models of the paleo-atmospheres of the Solar System planets. The FUSE observations fill a critical wavelength and energy gap in the “Sun in Time” program and complement observations of the same stars in the X-ray and EUV regions (corona) made with ROSAT, SAX, ASCA, XMM, Chandra, and EUVE, and in the UV (TR and chromosphere) made using IUE and HST. The only missing piece of information is the evolution of the irradiance of the strong chromospheric H i Ly 1216 FUV feature. We are currently carrying out this part of the study and we expect to complete it shortly. Full spectral irradiance tables for five solar proxies are thus nearing completion and will be made available in a forthcoming publication (Ribas & Guinan 2003, in preparation).
We anticipate that these irradiance results will be important for the study of paleo-atmospheres of the Solar System planets. In particular, preliminary analyses indicate that the high X-ray and EUV emission fluxes of the early Sun could have produced significant heating of the planetary exospheres and upper-atmospheres thus enhancing processes such as thermal escape. The early Sun’s strong FUV and UV fluxes penetrate further into the atmosphere and probably influenced the photochemistry of, e.g., methane and ammonia, which are important greenhouse gases. Thus, this study has strong implications for the evolution of the pre-biotic and Archean atmosphere of the Earth as well as for the early development of life on Earth and possibly on Mars.
References
- (1) Ake, T. B., Dupree, A. K., Young, P. R., Linsky, J. L., Malina, R. F., Griffiths, N. W., Siegmund, O. H. W., & Woodgate, B. E. 2000, ApJ, 538, L87
- (2) Allard, N., Artru, M.-C., Lanz, T., & Le Dourneuf, M. 1990, A&AS, 84, 563
- (3) Arnaud, M., & Rothenflug, R. 1985, A&AS, 60, 425
- (4) Ayres, T. R. 1997, JGR, 102, 1641
- (5) Berrington, K. A. 1985, J. Phys. B.: At. Mol. Phys., 18, L395
- (6) Berrington, K. A., Burke, P. G., Dufton, P. L., & Kingston, A. E. 1985, Atomic Nucl. Data Tables, 33, 195
- (7) Bhatia, A. K., & Kastner, S. O. 1992, ApJS, 79, 139
- (8) Canuto, V. M., Levine, J. S., Augustsson, T. R., & Imhoff, C. L. 1982, Nature, 296, 816
- (9) Canuto, V. M., Levine, J. S., Augustsson, T. R., Imhoff, C. L., & Giampapa, M. S. 1983, Nature, 305, 281
- (10) Dorren, J. D., & Guinan, E. F. 1994, in IAU Coll. 143, The Sun as a Variable Star, eds. J. M. Pap, C. Frölich, H. S. Hudson, & S. K. Solanki (Cambridge: CUP), 206
- (11) Doyle, J. G., Kingston, A. E., & Reid, R. H. G. 1980, A&A, 90, 97
- (12) Doyle, J. G., Raymond, J. C., Noyes, R. W., & Kingston, A. E. 1985, ApJ, 297, 816
- (13) Dupree, A. K., Foukal, P. V., & Jordan, C. 1976, ApJ, 209, 621
- (14) Feldman, U., & Doschek, G. A. 1991, ApJS, 75, 925
- (15) Fleming, J., Hibbert, A., & Stafford, R. P. 1984, Physica Scripta, 49, 316
- (16) Gayley, K. G. 2002, ApJ, 565, 545
- (17) Grevesse, N., & Sauval, A. J. 1998, Space Science Reviews, 85, 161
- (18) Güdel, M., Guinan, E. F., & Skinner, S. L. 1997, ApJ, 483, 947
- (19) Guinan, E. F., Ribas, I., & Harper, G. M. 2002, in ASP Conf. Ser. 264, Continuing the Challenge of EUV Astronomy: Current Analysis and Prospects for the Future, eds. S. B. Howell, J. Dupuis, D. Golombek, F. M. Walter, & J. Cullison (San Francisco: ASP), 129
- (20) Heroux, L., & Hinteregger, H. E. 1978, JGR, 83, 5305
- (21) Jordan, C. 2000, Plasma Phys. Control Fusion, 42, 415
- (22) Jordan, C., Ayres, T. R., Brown, A., Linsky, J. L., & Simon, T. 1987, MNRAS, 225, 903
- (23) Judge, P. G., Woods, T. N., Brekke, P., & Rottman, G. J. 1995, ApJ, 455, L85
- (24) Keenan, F. P., & Berrington, K. A. 1985, Solar Phys., 99, 25
- (25) Lammer, H., Lichtenegger, H., Kolb, C., Ribas, I., Guinan, E. F., & Bauer, S. J. 2003, Icarus, in press
- (26) Linsky, J. L., & Wood, B. E. 1994, ApJ, 430, 342
- (27) Luhmann, J. G., & Bauer, S. J. 1992, in Venus and Mars: Atmospheres, ionospheres, and solar wind interactions, Proceedings of the Chapman Conference (Washington, DC: American Geophysical Union), 417
- (28) MacPherson, K. P., & Jordan, C. 1999, MNRAS, 308, 510
- (29) Montesinos, B., & Jordan, C. 1993, MNRAS, 264, 900
- (30) Moore, C. E. 1970, NSRDS-NBS 3 NBS, Washington, D.C.
- (31) Moos, H. W., Cash, W. C., Cowie, L. L., et al. 2000, ApJ, 538, L1
- (32) Nussbaumer, H. & Storey, P. J. 1978, A&A, 64, 139
- (33) Noyes, R. W., Raymond, J. C., Doyle, J. G., & Kingston, A. E. 1985, ApJ, 297, 805
- (34) Oranje, B. J. 1986, A&A, 154, 185
- (35) Pavlov, A. A., Kasting, J. F., Brown, L. L., Rages, K. A., & Freedman, R. 2000, JGR, 105, 11981
- (36) Redfield, S., & Linsky, J. L. 2000, ApJ, 534, 825
- (37) Redfield, S., & Linsky, J. L. 2002, ApJS, 139, 439
- (38) Redfield, S., Ayres, T. R., Linsky, J. L., Ake, T. B., Dupree, A. K., Robinson, R. D., & Young, P. R. 2003, ApJ, 585, 993
- (39) Redfield, S., Linsky, J. L., Ake, T. B., Ayres, T. R., Dupree, A. K., Robinson, R. D., Wood, B. E., & Young, P. R. 2002, ApJ, 581, 626
- (40) Ryans, R. S. I., Foster-Woods, V. J., Reid, R. H. G., Keenan, F. P., & Copeland, F. 1990, A&A, 336, 393
- (41) Rye, R., Kuo, P. H., & Holland, H. D. 1995, Nature, 378, 603
- (42) Sagan, C., & Mullen, G. 1972, Science, 177, 52
- (43) Sagan, C., & Chyba, C. 1997, Science, 276, 1217
- (44) Sahnow, D. J., Moos, H. W., Ake, T. B., et al. 2000, ApJ, 538, L7
- (45) Shorer, P., & Lin, C. D. 1977, Phys. Rev. A., 16, 2068
- (46) Simon, T., Boesgaard, A. M., & Herbig, G. 1985, ApJ, 293, 551
- (47) Skumanich, A. 1972, ApJ, 171, 565
- (48) Spitzer, L. 1978, Physical Processes in the Interstellar Medium (New York: John Wiley)
- (49) Tachiev, G., & Froese Fischer, C. 1999, J. Phys. B., 32, 5805
- (50) Wood, B. E., Linsky, J. L., & Ayres, T. R. 1997, ApJ, 478, 745
- (51) Wood, B. E., Müller, H.-R., Zank, G., & Linsky, J. L. 2002a, ApJ, 574, 412
- (52) Wood, B. E., Redfield, S., Linsky, J. L., & Sahu, M. S. 2002b, ApJ, 581, 1168
- (53) Young, P. R., Dupree, A. K., Wood, B. E., Redfield, S., Linsky, J. L., Ake, T. B., & Moos, H. W. 2001, ApJ, 555, L121
- (54) Zhang, H. L., Sampson, D. H., & Fontes, C. J. 1990, Atomic Data Nucl. Data Tables, 44, 31
| Name | HD | Sp. | d | Mass | Radius | Age | Age | ||
|---|---|---|---|---|---|---|---|---|---|
| Typ. | (pc) | (K) | (M⊙) | (R⊙) | (d) | (Gyr) | indicator | ||
| EK Dra | 129333 | G0 V | 33.9 | 5818 | 1.07 | 0.95 | 2.75 | 0.13 | Pleiades str. |
| UMa | 72905 | G1.5 V | 14.3 | 5840 | 0.98 | 0.97 | 4.68 | 0.3 | UMa str. |
| Cet | 20630 | G5 V | 9.2 | 5700 | 1.01 | 0.94 | 9.2 | 0.65 | -Age rel. |
| Com | 114710 | G0 V | 9.2 | 5950 | 1.11 | 1.08 | 12.4 | 1.6 | -Age rel. |
| Sun | – | G2 V | 1 AU | 5777 | 1.00 | 1.00 | 25.4 | 4.6 | Isotopic dating |
| Hyi | 2151 | G2 IV | 7.5 | 5800 | 1.09 | 1.88 | 28 | 6.7 | Isochrones |
| 16 Cyg A | 186408 | G2 V | 21.6 | 5740 | 0.99 | 1.27 | 35 | 9 | Isochrones |
| Name | Obs ID | Date Obs. | texp (ks) | ||||||
|---|---|---|---|---|---|---|---|---|---|
| EK Dra | C1020501 | 2002 May 14 | 24.2 | 11.10.7 | 7.60.4 | 7.30.3 | 3.40.2 | 0.470.07 | 0.810.19 |
| UMa | B0780101 | 2001 Dec 5 | 16.5 | 14.70.7 | 9.30.5 | 9.60.3 | 4.80.2 | 0.740.09 | 0.650.26 |
| Cet | A0830301 | 2000 Sep 10 | 13.0 | 16.40.7 | 10.70.4 | 12.40.4 | 6.20.2 | 1.070.12 | 0.440.14 |
| Com | A0830401 | 2001 Jan 26 | 15.0 | 11.00.5 | 5.50.2 | 5.90.2 | 2.80.1 | 0.630.08 | 0.06bb1- upper limits |
| Hyi | A0830101 | 2000 Jul 1 | 18.0 | 15.10.5 | 5.80.2 | 6.10.2 | 2.80.1 | 1.020.09 | 0.04bb1- upper limits |
| 16 Cyg A | C1020101 | 2002 Jul 30 | 35.0 | 0.660.14 | 0.200.09 | 0.430.05 | 0.200.03 | 0.05bb1- upper limits | 0.04bb1- upper limits |
| Name | Phot | Cii | Ciii | Ovi | Fexviii | ||||
|---|---|---|---|---|---|---|---|---|---|
| Hel | Hel | Shift | Hel | Shift | Hel | Shift | Hel | Shift | |
| EK Dra | 30.5 | 23 | 8 | 15 | 16 | 25 | 6 | 26 | 5 |
| UMa | 12.0 | 23 | 11 | 24 | 12 | 19 | 7 | 51: | 39: |
| Cet | 19.9 | 12 | 8 | 16 | 4 | 16 | 4 | 1 | 19 |
| Com | 6.1 | 3 | 3 | 0 | 6 | 4 | 2 | – | – |
| Hyi | 22.7 | 6 | 17 | 20 | 3 | 16 | 7 | – | – |
| 16 Cyg A | 25.6 | 40: | 14: | 29 | 3 | 22 | 4 | – | – |
| Name | |||||
|---|---|---|---|---|---|
| EK Dra | 1.170.18 | 28.41.7 | 18.20.8 | 2.020.51 | – |
| UMa | 0.320.04 | 6.520.33 | 4.100.12 | 0.280.11 | 4520 |
| Cet | 0.200.02 | 3.300.15 | 2.320.07 | 0.0820.025 | 16.43.8 |
| Com | 0.0900.011 | 1.640.07 | 0.8420.030 | 0.0085 | – |
| Hyi | 0.0320.003 | 0.5430.019 | 0.1900.007 | 0.0012 | – |
| 16 Cyg A | 0.03 | 0.4230.090 | 0.2460.028 | 0.02 | – |
| Wav. region/ion | Plasma (K) | Slope ()aaPower law slope corresponding to the following functional form: , where is the exponent listed in the column | Slope (age)bbPower law slope corresponding to the following functional form: , where is the exponent listed in the column |
|---|---|---|---|
| FUV (920–1180 Å) | 1.74 | 1.03 | |
| C ii | 1.49 | 0.88 | |
| C iii | 1.61 | 0.95 | |
| O vi | 1.82 | 1.07 | |
| X-rays (0.1–2.4 keV)ccFrom Güdel et al. 1997 | 2.64 | ||
| Fe xviii | 3.2 | 1.9 |
| Name | aa | ||
|---|---|---|---|
| EK Dra | 0.680.05 | 0.670.05 | 16.0 |
| UMa | 0.630.05 | 0.610.04 | |
| Cet | 0.650.04 | 0.600.04 | |
| Com | 0.500.03 | 0.480.03 | |
| Hyi | 0.380.02 | 0.330.02 | |
| 16 Cyg A | 0.300.15 | 0.270.13 |