XMM-Newton spectral properties of the Narrow-Line Seyfert 1 galaxy IRAS 13224–3809
Abstract
We report on the first XMM-Newton observation of the highly X-ray variable, radio-quiet, Narrow-Line Seyfert 1 galaxy IRAS 13224–3809 obtained during the guaranteed time programme with a 64 ks exposure. The most remarkable spectral feature is a sharp drop, by a factor , in the spectrum at 8 keV. This is a similar, but stronger, feature to that which we found in 1H 0707–495. Significant flattening of the hard X-ray spectrum occurs when the source flux decreases. The flattening of the spectrum can be modelled as an increase in the column density of the absorbing material and/or its covering fraction. Below keV the spectrum is dominated by a giant soft X-ray excess, and at around keV there is a significant absorption feature detected, most probably due to ionized Fe L absorption. The new X-ray spectral properties detected with XMM-Newton in IRAS 13224–3809 support a partial covering interpretation, i.e. the presence of dense material inside the accretion-disc region partially obscuring the emission from the accretion disc. However, the sharpness of the feature, if due to photoelectric absorption, is surprising and may require an alternative explanation. One possibility which does fit the whole spectrum is that it is dominated by ionized reflection rather than absorption. The unusual spectral properties detected with XMM-Newton from Narrow-Line Seyfert 1 galaxies increase the known spectral complexity of active galactic nuclei and should further stimulate a combined theoretical and observational effort to achieve a better understanding of the physics of the innermost regions of AGN.
keywords:
galaxies: active, AGN – galaxies: individual: IRAS 13224–3809 – X-rays: galaxies1 Introduction
ROSAT, ASCA and XMM-Newton have shown many Narrow-Line Seyfert 1 galaxies (hereafter NLS1s; see Osterbrock & Pogge 1985 and Goodrich 1989) to have remarkable X-ray properties compared to Seyfert 1 galaxies with broader Balmer lines. In X-rays NLS1s are generally characterized by strong soft X-ray excesses, steep hard power-law continua and extreme X-ray variability (e.g. Puchnarewicz et al. 1992, Boller, Brandt & Fink 1996, Brandt & Boller 1998, Vaughan et al. 1999, Brandt, Mathur & Elvis 1997). With the arrival of XMM-Newton spectra a new feature was added: a sharp spectral drop above 7 keV without any significant Fe-K line emission in the NLS1 1H 0707–495 (Boller et al. 2002; Fabian et al. 2002). In the case of 1H 0707–495 two physical interpretations were discussed: (i) a partial covering scenario (following Rees 1987; Celotti, Fabian & Rees 1992; Brandt & Gallagher 2000) in which the sharp drop is interpreted as Fe absorption in high column density clouds (Boller et al. 2002) and (ii) a reflection-dominated accretion-disc spectrum (Fabian et al. 2002). Both models provide acceptable spectral fits to the 1H 0707–495 data. The very high iron overabundance in the Boller et al. (2002) interpretation was reduced to a more realistic value by the reanalysis of Tanaka et al. (2003).
IRAS 13224–3809 is one of the most interesting members of the NLS1 class due to its remarkable X-ray variability, huge soft X-ray excess (Boller, Brandt & Fink 1996) and high optical Fe II to H line ratio (Boller et al. 1993). Indeed, IRAS 13224–3809 is among the most X-ray variable Seyfert 1 galaxies known. The first systematic monitoring in soft X-rays in 1996 showed persistent, rapid, giant-amplitude count rate variability. Over the course of the observations the maximum observed amplitude of variability was of a factor of , and a variation by about a factor of 57 in just two days was observed. The ionizing luminosity rises from about erg s-1 to about erg s-1, roughly equivalent to a typical Seyfert 1 like MCG–6-30-15 abruptly increasing its soft X-ray luminosity to become almost as powerful as a quasar (Boller et al 1997).
Due to its extreme X-ray spectral and timing properties, IRAS 13224–3809 was observed during the XMM-Newton guaranteed time programme. In this paper we discuss the results obtained from the 64 ks observation.
2 X-ray observations and data analysis

IRAS 13224–3809 was observed with XMM-Newton (Jansen et al. 2001) on 2002 January 19 during revolution 0387 for about 64 ks. During this time all instruments were functioning normally. The EPIC pn camera (Strüder et al. 2001) was operated in full-frame mode, and the two MOS cameras (MOS1 and MOS2; Turner et al. 2001) were operated in large-window mode. All of the EPIC cameras used the medium filter. The two Reflection Grating Spectrometers (RGS1 and RGS2; den Herder et al. 2001) also gathered data during this time. The Observation Data Files (ODFs) were processed to produce calibrated event lists using the XMM-Newton Science Analysis System (SAS v5.3). Unwanted hot, dead or flickering pixels were removed as were events due to electronic noise. Event energies were corrected for charge-transfer losses. The latest available calibration files were used in the processing. Light curves were extracted from these event lists to search for periods of high background flaring. A significant background flare was detected in the EPIC cameras approximately 20 ks into the observation and lasted for 5 ks. This segment was removed and ignored during the analysis. The total amount of good exposure time selected was 55898 s and 58425 s for the pn and MOS detectors, respectively. The source plus background photons were extracted from a circular region with a radius of 35 arcsec, and the background was selected from an off-source region and appropriately scaled to the source region. Single and double events were selected for the pn detector, and single-quadruple events were selected for the MOS. High resolution spectra were obtained with the RGS. The RGS were operated in standard Spectro+Q mode for a total exposure time of 63963 s. The first-order RGS spectra were extracted using RGSPROC, and the response matrices were generated using RGSRMFGEN. The Optical Monitor collected data through the UVW2 filter (1800–2250 Å) for about the first 25 ks of the observation. The OM data are discussed in Gallo et al. (2003, in preparation). In the following analysis we use the EPIC pn data to constrain the sharp spectral feature at 8 keV, as they contain the highest photon statistics. The energy range up to about 12 keV can be explored with EPIC pn while above that value the spectrum is background dominated. The combined MOS1 and MOS2 spectrum is affected by high background at energies greater than 6 keV. Above 8 keV, we collect a total of 120 source plus background counts, while the number of background photons, normalized to the source cell size, is 68.
3 X-ray spectroscopy
3.1 Mean spectral properties
3.1.1 Discovery of a sharp spectral feature

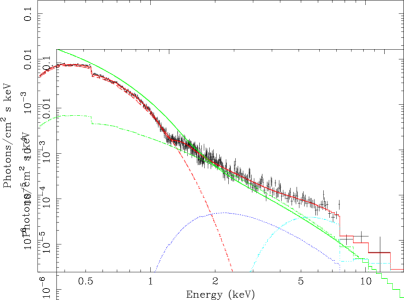
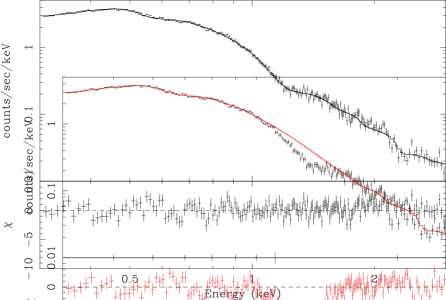
In Fig. 1 we show the time-averaged spectrum of IRAS 13224–3809. We have fitted the 2–7 keV energy band with a simple power-law, which is extrapolated into the soft and hard bands for illustration purposes. The most obvious features are the strong soft X-ray excess emission below about 1.5 keV and the presence of a sharp spectral drop at keV. If the 2–12 keV spectrum is fitted by a simple power-law plus edge model, the edge energy is keV (Fig. 2). The energy of the edge is significantly different from that of the neutral iron absorption edge at 7.1 keV. The flux absorbed by the edge is erg cm-2 s-1. The edge cannot be constrained by the MOS data as the spectrum is background dominated above about 6 keV.
Some positive residuals can be seen at around 6.8 keV (in the rest frame of the object). They are consistent with emission from H and He-like iron with a total equivalent width of about 200 eV. The detection of this emission, judged from an -test, is marginal (at about the confidence level). The strength of the line, when compared with the flux of photons which is absorbed and the likely fluorescent yield (Krolik & Kallman 1987), indicates that the absorber covers a solid angle .
3.1.2 A partial covering model
The observed spectrum shows little low-energy absorption and is consistent with interstellar absorption only. On the other hand, there is what appears to be a deep absorption edge at keV which would correspond to the K-edge of Fe xviii–xx. The sharpness of the edge requires that the ionization states of Fe are confined to a narrow range. The absence of strong (narrow) emission at keV is in contradiction with an explanation in terms of a distant reflector. The observed features can be explained in terms of absorption if allowance is made for partial covering (i.e. a patchy absorber).
A partial-covering model was therefore fitted to the data. The model comprised a multi-component disc (MCD) model for the soft component, and a partially covered power-law for the hard continuum. In addition, this model required a further absorption feature around keV (see Section 3.1.3), which is included by subtracting a Gaussian line. A good fit was obtained () using two absorbed power-laws, but a very steep slope, was required, which appears extremely high given the the present values found in AGN (c.f. Fig. 1 of Brandt, Mathur & Elvis 1997). Allowing for an exponential cut-off in the power-laws did not significantly improve the fit () but gave a more reasonable spectral slope. This model is illustrated in Fig. 3. The best-fit parameters were as follows: the MCD (colour) temperature keV, , keV, and the column densities (and covering fractions) of the line-of-sight absorbers were cm-2 (0.06) and cm-2 (0.77). The Fe abundance was about solar with a 90 per cent confidence lower limit of solar. The average effective slope of the cut-off power-law over keV is approximately .
The temperature and (absorption-corrected) luminosity of the disc require that its inner radius is only about one gravitational radius for a M⊙ black hole. Assuming the soft X-ray excess is physically described by a MCD model then the object would be super-Eddington when bright.
3.1.3 Detection of Fe L absorption
A broad absorption feature at keV, with an intrinsic width keV, is required in the above model with high significance (Fig. 4). The equivalent width is approximately eV. The absorbed flux is erg cm-2 s-1. The RGS1 spectrum is consistent with, but does not constrain, the presence of an absorption feature (no data were collected from RGS2 in that energy range). Other features in the RGS spectra can not be constrained with the available photon statistics.
This deep absorption feature is similar to that reported by Leighly et al. (1997) from the ASCA spectrum. Those authors interpreted the feature in terms of resonant absorption oxygen from a relativistic outflow. A more prosaic explanation was put forward by Nicastro, Fiore & Matt (1999) who interpreted the feature as resonance absorption, primarily by L-shell iron. Their analysis gave a column density of the absorbing material of and an ionization parameter of with an outflowing and dispersion velocity of km s-1 (see also their Fig. 4). Such an absorption model does not simply explain the large observed drop at 8 keV.
3.1.4 An alternative discline explanation
In the case of 1H 0707–495 (Boller et al. 2002) we noted that the sharp drop at 7.1 keV could be the blue wing of a strong, relativistically-blurred iron emission line. This would require some unusual geometry or situation in order that such a strong line is produced; the spectrum needs to be reflection-dominated. Fabian et al. (2002) discuss one possibility involving a corrugated inner accretion disc; an alternative would be gravitational light bending (e.g. Martocchia, Matt & Karas 2002; Fabian & Vaughan 2003). The spectrum of IRAS 13224–3809 can also be fitted by such a model (see Fig 5). Fitting the 2–12 keV spectrum with a power-law continuum plus a emission line with a Laor (1991) profile worked well with an emissivity index , inner and outer radii of and gravitational radii for the disc, and an inclination of deg. The disc inclination and emissivity were covariant in the fitting, and a wide range of inclination angles was possible. The equivalent width of the line is unusually high at 5.6 keV. To see whether such a strong line can be produced, we used a grid of ionized slab models produced by D. Ballantyne (using the code described by Ross & Fabian 1993). With the abundances of metals at 7 times solar and Galactic absorption we obtain a fit over the entire range from keV with a . Some sharp deviations at the 2–3 level occur at keV and again at keV. As with 1H 0707–495 this model requires the X-ray spectrum to be reflection-dominated. The sharp jump in the spectrum at keV is due to strong line and recombination emission by Fe-L, O, and other elements.

3.2 Flux-dependent spectral properties
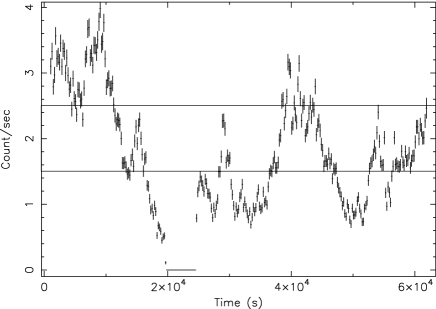
The keV light curve of IRAS 13224–3809 shows strong and rapid variability with flux changes by about a factor of 10 (Fig. 6). We have divided the light curve into four different flux states: (i) two high states with count rates above 2.5 counts s-1 (time intervals less than 20 ks and greater than 30 ks after the beginning of the observations); (ii) a medium state with count rates between 1.5 and 2.5 counts s-1; and a (iii) low state below 1.5 counts s-1.
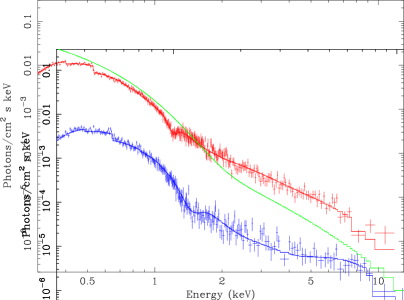
Evidence in support of partial covering is obtained from a comparison of the spectra between a high-flux level and a low-flux level. The high-flux and low-flux spectra are constructed from those intervals were the source count rate is counts s-1 and counts s-1, respectively. The average fluxes of the two are different by a factor of three. These two spectra were fitted simultaneously with the same spectral model as in section 3.1.2 (i.e. a MCD and a cut-off power-law model, and two absorbed power-law components). The Fe abundance was fixed at 3solar. A good fit () was obtained, as shown in Fig. 7. The best fitting parameters were as follows: keV, , keV. The column densities (and covering fractions) of the absorbers for the high-flux spectrum were (0.66) and (0.53), and those for the low-flux spectrum were (0.53) and (0.87), where the column is in units of cm-2. Thus when the flux dropped the absorption increased.
4 Discussion
IRAS 13224–3809 shows an unusual combination of spectral features: (i) a sharp spectral drop by a factor of at keV, (ii) marginal Fe K emission lines, (iii) a flattening of the spectrum above 3 keV towards low flux states, (iv) strong soft X-ray excess emission, (v) a significant Fe-L absorption feature at around 1.2 keV.
The most plausible explanation for the spectral features (i) to (iii) appears to be provided by a partial-covering scenario. The soft X-ray excess is most probably due to a higher temperature of the accretion disc as often seen in NLS1s. Presently it is not clear whether the Fe-L absorption feature is physically connected with the partial covering scenario. The lack of strong emission lines can be explained if the absorber subtends only a small solid angle as seen from the central black hole. An immediate consequence, given the variability in the absorber, is that the absorber must be located close to the central black hole, maybe even within the accretion disc region as suggested by e.g Rees (1987), Celotti, Fabian & Rees (1992) and Brandt & Gallagher (2000). The flattening of the spectrum provides strong evidence for partial covering, as an increased absorbing column and/or a larger covering fraction is expected when the source flux is low. Although the partial coverer model explains the data well, the present photon statistics above the edge still do not allow us to constrain precisely the iron abundance, nor can we disentangle the unique contribution of the covering fraction or the absorbing column.
The sharpness of the feature, if due to a photoelectric edge, is surprising. At 8.2 keV the absorbing matter must be partially ionized (the threshold energies for Fe xix–xxiii are 7.93, 8.07, 8.21, 8.35 and 8.49 keV) in which case a range of ionization states is expected. These make the observed edge broad rather than sharp (e.g. Palmeri et al. 2002). Alternatively the feature may be a neutral edge in approaching matter (say in a wind or jet along the line of sight, e.g. Chartas et al. 2002). The velocity of the matter is then required to be . A further possibility if the absorption is by approaching matter is that the feature is the start of a trough due to resonance absorption (e.g. Krolik et al. 1985, with Fe xxv/xxvi instead of O viii). There is then a significant outflow of mass and kinetic energy from the object.
The extreme spectral properties detected with XMM-Newton increase the known spectral complexity in active galactic nuclei and should further stimulate a combined theoretical and observational effort to improve our understanding of the physics of the innermost regions of AGN. To more precisely constrain the form of the sharp spectral feature in IRAS 13224–3809 and distinguish between different models we need a much stronger signal above 8 keV. This may be possible if the source is observed during one of its giant amplitude fluctuations.
Acknowledgments
Based on observations obtained with XMM-Newton, an ESA science mission with instruments and contributions directly funded by ESA Member States and the USA (NASA). WNB acknowledges support from NASA LTSA grant NAG5-13035.
References
- [1] Boller Th., Trümper J., Molendi S., Fink H., Schaeidt S., Caulet A., Dennefeld M., 1993, A&A 279, 53
- [2] Boller Th., Brandt W.N., Fink H., 1996, A&A, 305, 53
- [3] Boller Th., Brandt W.N., Fabian A.C., Fink H. 1997, MNRAS 289, 393
- [4] Boller Th., Fabian A. C., Sunyaev R., Trümper, J., Vaughan S., Ballantyne D. R., Brandt W. N., Keil R., Iwasawa K., 2002, MNRAS 329, 1
- [5] Brandt W.N., Boller Th., 1998, AN 319, 3, 163
- [6] Brandt W.N., Mathur S., Elvis M., 1997, MNRAS, 285, 25
- [7] Brandt W.N., Gallagher S.C., 2000, New Astronomy Reviews 44, 461
- [8] Celotti A., Fabian A.C., Rees M.J., 1992, MNRAS 255, 419
- [9] Chartas G., Brandt W.N., Gallagher S.C., Garmire, G.P., 2002, ApJ 579, 169
- [10] Fabian A. C., Ballantyne D. R., Merloni, A., Vaughan S., Iwasawa K., Boller Th., 2002, MNRAS 331, 35
- [11] Fabian A. C. & Vaughan, S., 2003, accepted for MNRAS (astro-ph/0301588)
- [12] Goodrich, R. W., 1989, ApJ 342, 234
- [13] den Herder, J. W.; Brinkman, A. C.; Kahn, S. M.; Branduardi-Raymont, G.; Thomsen, K.; Aarts, H.; Audard, M.; Bixler, J. V.; den Boggende, A. J.; Cottam, J. et al. 2001, A&A 365, 7
- [14] Jansen F., Lumb D., Altieri B., Clavel J., Ehle M., Erd C., Gabriel C., Guainazzi M., Gondoin P., Much R. et al., 2001, A&A 365, 1
- [15] Krolik, J. H., Kallman, T. R., Fabian, A. C., Rees, M. J., 1985, ApJ 295, 104
- [16] Laor, A., 1991, ApJ 376, 90
- [17] Leighly K., Mushotzky R.F., Nandra K., Forster K., 1997, ApJL 489, 25
- [18] Martocchia, A., Matt, G., Karas, V., 2002, A&A 383, 23
- [19] Mason, K. O., Breeveld A., Much R., Carter M., Cordova F. A., Cropper M. S., Fordham J., Huckle H., Ho C., Kawakami H. et al. 2001, A&A 365, 36
- [20] Nicastro F., Fiore F., Matt G., 1999, ApJ 517, 108
- [21] Osterbrock, D. E. & Pogge, R. W., 1985, ApJ 297, 166
- [22] Palmeri, P., Mendoza, C., Kallman, T. R., Bautista, M. A., 2002, ApJ 577, L119
- [23] Puchnarewicz E. M., Mason K. O., Cordova F. A., Kartje J., Branduardi-Raymont G. et al. 1992, MNRAS, 256, 589
- [24] Rees M., 1987, MNRAS 228, 47
- [25] Ross, R. R. & Fabian, A. C., 1993, MNRAS 261, 74
- [26] Strüder L., Briel U., Dennerl K., Hartmann R., Kendziorra E., Meidinger N., Pfeffermann E., Reppin C., Aschenbach B., Bornemann W. et al., 2001, A&A 365 18
- [27] Tanaka Y., Boller Th., Ueda, Y., Keil R., 2003, submitted to MNRAS
- [28] Turner M. J. L., Abbey A., Arnaud M., Balasini M. Barbera M., Belsole, E., Bennie P. J., Bernard J. P., Bignami G. F., Boer M. et al., 2001, A&A 365, 27
- [29] Vaughan S., Reeves J., Warwick R., Edelson R., 1999, MNRAS 309, 113