Properties of Faint Distant Galaxies as seen through Gravitational Telescopes
Abstract
This paper reviews the most recent developments related to the use of lensing clusters of galaxies as Gravitational Telescopes in deep Universe studies. We summarize the state of the art and the most recent results aiming at studying the physical properties of distant galaxies beyond the limits of conventional spectroscopy. The application of photometric redshift techniques in the context of gravitational lensing is emphasized for the study of both lensing structures and the background population of lensed galaxies. A presently ongoing search for the first building blocks of galaxies behind lensing clusters is presented and discussed.
Laboratoire d’Astrophysique de l’Observatoire Midi-Pyrénées, UMR5572, 14 Av. Edouard Bélin, F-31400 Toulouse (France)
IASF-MI, via Bassini 15, I-20133 Milano, Italy
2 Astronomy Department, California Institute of Technology, Pasadena, CA 91125
3 Geneva Observatory, 51, Ch. des Maillettes, CH-1290 Sauverny, Switzerland
1. Introduction
The availability of statistically significant samples of galaxies, from to the largest look-back times, covering a large region in the parameter space, is mandatory for constraining the cosmological scenarios of galaxy formation and evolution. Large spectroscopic samples of galaxies at all redshifts have become available during the last ten years, thanks to extended surveys in the different rest-frame wavelength domains (e.g. Lilly et al. 1995; Ellis et al. 1996; Steidel et al. 1996, 1999; Adelberger & Steidel 2000; Chapman et al. 2000; Pettini et al. 2001; Erb et al. 2003). The evolution of the overall properties of galaxies as a function of redshift is particularly important for galaxies at z 1, a redshift domain where galaxies are expected to be strongly affected by merging or assembly processes.
Clusters of galaxies acting as Gravitational Telescopes (hereafter GTs) constitute a particular and powerful tool in this context of high redshift surveys, as it was pointed out by different authors in the early nineties (see Fort & Mellier 1994 for a review). The main advantage of such “telescopes” is that they take benefit from the large magnification factor in the core of lensing clusters, close to the critical lines, which typically ranges between 1 and 3 magnitudes. Thus, GTs can be used to access the most distant and faintest population of galaxies, extending the current surveys towards intrinsically fainter samples of galaxies, allowing to probe the physical properties of the faint end of the luminosity function at moderate and high redshifts. Indeed, GTs have been succesfully used during the last ten years to perform detailed studies of distant galaxies at different wavelengths, from UV to submillimeter. A particular and recent application of GTs is the identification and study of extremely distant galaxies, including the search for the first galaxies formed in the early Universe, up to redshifts of the order of .

The plan of the paper is as follows. Section 2. presents a summary of the latest developments concerning the use of cluster lenses as Gravitational Telescopes. We summarize the state of the art and the recent results aiming at studying the physical properties of distant galaxies beyond the limits of conventional spectroscopy. In Section 3., we briefly describe the photometric redshift approach, as a tool in deep photometric studies, and in particular in the context of gravitational lensing. We emphasize the use of such a tool for the study of both lensing structures and the background population of lensed galaxies. We discuss in Section 4. on the use of Gravitational Telescopes to identify the first building blocks of galaxies, also known as Population III sources. A presently ongoing search for PopIII candidates behind lensing clusters is briefly presented. Conclusions are given in Section 5..
2. Physics of galaxies beyond the limits of conventional spectroscopic samples. State of the art
2.1. Lensing Clusters as Gravitational Telescopes
From the point of view of galaxy evolution studies, GTs can be considered as an alternative way to blank fields to investigate the properties of distant galaxies. GTs allow to construct and to study independent samples of high-z galaxies, less biased in luminosity than standard magnitude-limited field samples, thanks to the magnification factor. For a given limiting magnitude or flux, lensed samples will complement the currently available field surveys towards the faint end of the luminosity function, and towards higher limits in redshift. It is worth noting that only lensing clusters with fairly well constrained mass distributions can be used as efficient GTs for galaxy evolution studies. In order to optimize the surveys, the expected 2D surface density distribution of arclets in clusters can be estimated for lenses with well known mass-distributions. Conversely, the lens-corrected distribution of arclets can be easily retrieved from the cluster cross section (e.g. Kneib et al. 1994, Bezecourt et al. 1998). An interesting property of GTs is that they conserve the surface brightness and the spectral energy distribution (SED) of lensed galaxies. Besides the spatial magnification, sources (or regions of sources) smaller than the seeing will effectively gain in surface brightness. These two effects contribute to increase the interest of GTs in spectroscopic studies.
The use of lensing clusters as genuine GTs is a relatively new research domain. Historically, it started with the spectroscopic confirmation of the first highly amplified source at in A370 (Soucail et al. 1988), and the identification of the spectacular blue arc in Cl2244-02 as a high-z lensed galaxy at (Mellier et al. 1991). The power of GTs to study the spectrophotometrical and morphological properties of high- galaxies was emphasized by different authors in the nineties (e.g. Smail et al. 1993; Smail et al. 1996; Kneib et al. 1996).
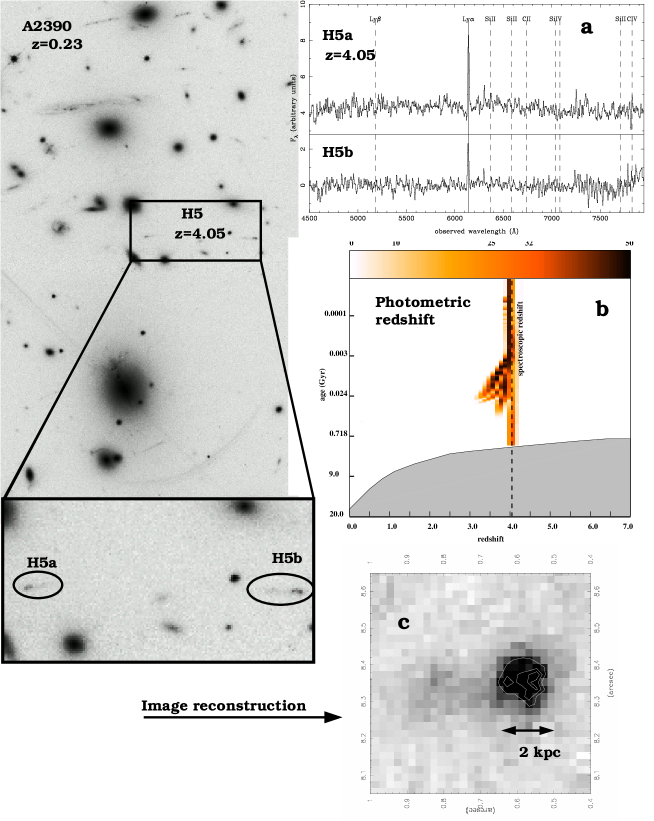
One of the first detailed studies on the physical properties of high- lensed galaxies was carried out by Ebbels et al. (1996), who studied the optical spectrum (obtained with the 4m telescope WHT) and optical-infrared colours of a star-forming galaxy at =2.515 behind A2218. This galaxy exhibits the same properties as typical Lyman Break Galaxies (LBGs, Steidel et al. 1996) in terms of colors, luminosity and star formation rate (see also Leitherer 1999). Another emblematic source is the luminous fold arc cB58, a z=2.7 star-forming galaxy behind the EMSS cluster MS1512+36, which is probably the best studied LBG nowadays (Yee et al. 1996; Seitz et al. 1998; Pettini et al. 2000; Teplitz al. 2000). Four galaxies with were found in the rich cluster Cl0939+47 by Trager et al. (1997), three of them at . Because of the weakness of the common stellar wind features in the spectra of these objects, the authors concluded that they have subsolar metallicities, their properties beeing quite similar to the already known ones in LBGs at . Because these objects, revealed by the GT, are close together both in redshift and space, they were identified by the authors as low-metallicity Population II protospheroid clumps, in other words, the progenitors of today’s spheroids. Another close look towards a star-forming region at was provided by the two lensed galaxies found in the cluster Abell 2390, at (Frye & Broadhurst 1998; Pelló et al. 1999). These galaxies are relatively bright compared to LBGs at , or to the sources in Cl0939+47. They have subsolar metallicities according to the overall fit of their SEDs, and they are clumpy and elongated, as revealed by the lens inversion procedure. They are located kpc apart from each other on the source plane, with similar orientation. Again, these results point towards a merging process of protospheroidal clumps, revealed by the GT. One of the highest redshift objects known in the nineties was also discovered thanks to the GT approach. This object was found in the cluster CL1358+62, with (Franx et al. 1997). Its spectral energy distribution is quite blue, as expected for a young galaxy with the observed restframe UV flux, but Soifer et al. (1998) results pointed towards an important absorption by dust in this object, the first direct evidence for such effect at .
GTs have been also used to address the morphological properties of high- lensed galaxies, in particular using HST images after its refurbishment. Gravitational arcs on these images are detected with diffraction-limited resolution. Therefore, morphological criteria have been introduced to identify lensed sources (Kneib et al. 1996). Smail et al. (1996) used this approach to discuss the properties of a large number of arcs in well known clusters, and they concluded to a strong evolution in the size of star-forming galaxies between and the local universe, distant sources beeing 1.5 to 2 times smaller than local ones. A detailed multi-wavelength study of a ring-like starburst galaxy at , hosting a central active nucleus, was presented by Soucail et al. (1999) as a result of their survey in the field of A370. The comparison between this galaxy and other similar galaxies in the local universe was possible thanks to lens inversion. Also, as mentioned above, several studies of the close environment of lensed sources were conducted with GTs.
When lensed galaxies are selected for subsequent spectroscopic studies, they are usually chosen close to the high- critical lines in order to obtain the largest magnification (typically magnitudes). Number of high- lensed galaxies observed during the nineties were discovered serendipitously, but efficient selection procedures can be defined, based on photometric or lensing criteria. Therefore, number of recent surveys have started using GTs to constitute large samples of intrisically faint objects at intermediate and high redshifts, using the capabilities of present day multi-object spectroscopy facilities in the optical domain. Among them, Campusano et al. (2001) presented a spectroscopic survey of 10 faint lensed galaxies in the core of the cluster AC114 (=0.312), with . Of particular interest are five objects (A, B, C, S and E) with spectroscopic redshift , which are between 0.5 and 1.5 magnitudes fainter than the limiting magnitude in the Steidel et al. (1999) sample of LBGs at similar redshifts. In a recent paper, Mehlert et al. (2002) discussed on the evidence of chemical evolution in the spectra of high- galaxies, by comparing a local sample of galaxies with a VLT/FORS spectroscopic sample at , using the equivalent width of CIV as a metallicity indicator. Part of their sample is constituted by high- lensed galaxies observed in the field of 1E0657-558 (Mehlert et al. 2001), with very large magnifications ( mags.) allowing to compare the abundances measured in faint galaxies in the local and high- universe. These authors conclude that the major trend in their sample is a metallicity enhancement towards low- galaxies, with no overall dependence of metallicity with galaxy luminosity. These results have been derived from a small number of intrinsically faint galaxies, and they have to be confirmed by larger samples of lensed galaxies at high-.
2.2. A few words about sample selection criteria
During the last ten years, samples of high- lensed galaxies have been pre-selected in the core of lensing clusters using different techniques. The fraction of high- galaxies in magnitude-limited samples is relatively small, even in deep photometric surveys, but the same photometric selection techniques usually applied to blank field studies can be adopted to select high- galaxies behind lensing clusters. Broadband color criteria have been successfully used to identify galaxies at redshifts higher than (e.g. Steidel et al 1995; Erb et al. 2003), and more general photometric redshift techniques are likely to produce equally usefull results in this context (see Section 3.). In the paper by Campusano et al. (2001), lensed galaxies were selected in areas close to the high- critical lines predicted by the gravitational lens model of Natarajan et al (1998), using a combination of both lensing and photometric redshift criteria. All galaxies targetted by the spectroscopic follow-up were found to be background galaxies with redshifts values within the interval.
Another selection criterium was proposed by Kneib et. al. (1994) and Kneib et. al. (1996) based on the inversion of the lensing equations and the prediction of redshifts for individual arclets. This is a purely geometrical criterium, based on the averaged shape of lensed sources, and the accurate measurement of the shape and orientation of arclets on high-resolution HST images, although the first applications were obtained on ground-based data (Kneib et. al. 1994). This technique produces statistical results on the redshift distribution of background sources. The spectroscopic verification of this technique on statistical basis was obtained by Ebbels et al. (1998) in the field of A2218. Bezecourt et al. (1999) used this lens inversion method to derive the comoving star formation rate in the range 0.5z2 from UV (WFPC2/F336W) images of the cluster lens A370.
2.3. The near-IR window
Observations in the near-IR window have become widespread during the last years. Indeed, without this wavelength domain, only star forming galaxies will be entering the high-z samples of galaxies defined in the visible bands. Deep observations at longer wavelengths are needed to probe stellar masses, thus constraining the cosmic star formation history. The near-IR window is barely affected by the presence of dust extinction or starbursts, and k-corrections are reduced compared to optical bands. This window is required to consistently follow the stellar population contributing to the flux beyond 4000 Å from all the way to redshift 4, and to map the star-forming and AGN activity up to the highest redshifts (). The evolution of the overall near-IR properties of galaxies (Luminosity Functions, redshift distribution of near-IR samples, color distributions, …) as a function of redshift constitutes a powerful test to discriminate between the different scenarios of galaxy formation, in particular for galaxies at , a redshift domain where GTs are particularly efficient. The Hubble Deep Field data have shown that the fraction of galaxies at reaches 50% typically at K22.5-23. This is indeed a key redshift domain where most galaxies were affected by major merging/assembly processes. In the case of early type galaxies, the formation of massive objects seems to took place at redshifts , i.e. the majority of their masses were already assembled and they only underwent minor mergers at lower redshifts. The main spectral signatures of such assembly process could be identified and studied through optical and near-IR data, the later beeing crucial to determine the photometric redshifts of galaxies within the redshift interval (see Section 3.).
The first results on a recent photometric survey for Extremely Red Objects (EROs), undertaken with the GT on a sample of 10 clusters at , was recently published by Smith et al. (2002). 60 EROs were found with down to . After correction for lensing effects, number counts are found to flatten for magnitudes fainter than –20, a result which could be due to the transition from a population of EROs dominated by evolved galaxies at –2 (–20) to one dominated by dusty starbursts at (–20).
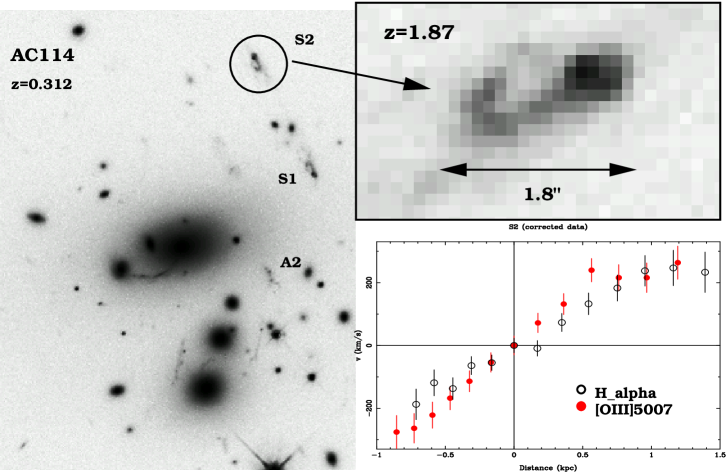
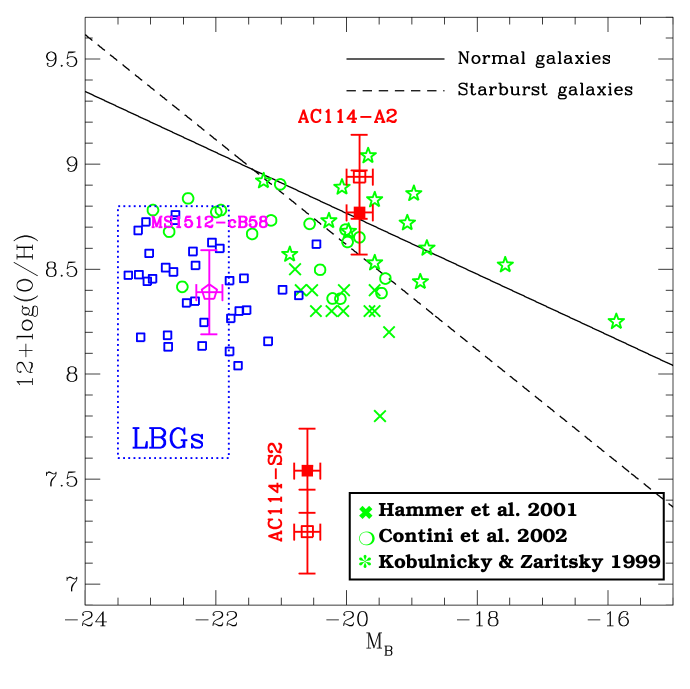
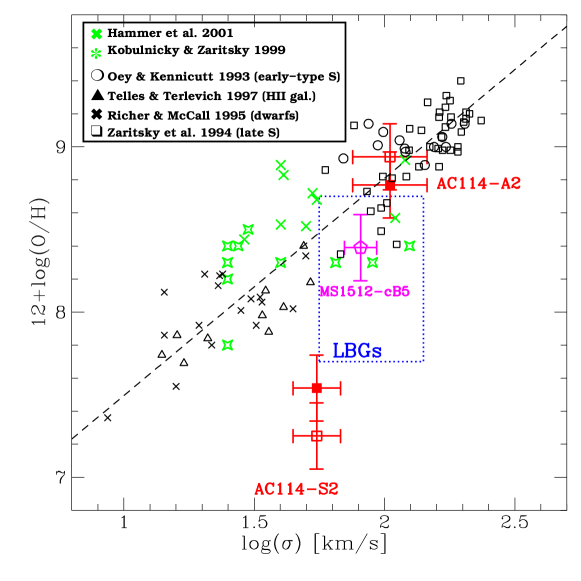
The recent development of near-IR spectrographs on 10m class telescopes has allowed the study of the rest-frame optical properties of high redshift galaxies. Indeed, near-IR spectroscopy allows to access the most relevant emission lines (, , [O II] 3726,3728, [O III] 4959,5007, …), in order to probe the physical properties of galaxies (SFR, reddening, metallicity, kinematics, virial mass, etc), all the way from the local universe to , using the same parameter space and indicators. The pioneering work by Pettini and collaborators (1998, 2001) has shown that the rest-frame optical properties of the brightest Lyman break galaxies (LBGs) at are relatively uniform. A new sample of 16 LBGs at has been recently published by Erb et al. (2003) and, in this case, significant differences are found in the kinematics of galaxies at compared to . In a recent paper, Lemoine-Busserolle et al. (2003) have presented the firsts results on their near-IR spectroscopic survey of high-redshift magnified galaxies at using GTs. Two lensed star-forming galaxies have been studied in the field of the cluster AC 114 (S2 and A2), 1 to 2 magnitudes fainter than LBGs at . Thanks to the large magnification factors obtained for these objects, number of rest-frame optical emission lines have been measured from [O II]3727 to +[N II]6584. Before this paper by Lemoine-Busserolle et al. (2003), there was only one LBG for which chemical abundances have been determined with some degree of confidence: the gravitationally lensed galaxy MS 1512-cB58 at (Teplitz et al. 2000; Pettini et al. 2002a). Figure 3 displays the metallicity–luminosity relationship and the metallicity versus line-of-sight velocity dispersion (, which corresponds to a crude mass–metallicity sequence) for these lensed galaxies compared to reference samples of galaxies at different redshifts. The results obtained up to now on this dramatically small sample suggest that high- objects of different luminosities could have quite different histories of star formation. The sample of LBGs observed in the near-IR aiming to explore the physical properties of galaxies is still poor. The contribution of GTs to these detailed studies is already significant, and there is a good chance that it increases in the following years.
2.4. Extending the wavelength domain
In recent years, GT studies of lensed galaxies have successfully extended to other wavelength windows:
-
•
In the mid-infrared (MIR), ultra-deep observations through the lensing cluster A2390 were obtained with ISOCAM/ISO at 7 and 15 m (Altieri et al. 1999). A large number of sources were identified as high-z lensed galaxies, and number counts computed to unprecedent depth. These results ruled out non-evolutionary models and favour of a very strong evolution (see also Metcalfe, L., this Conference).
-
•
In the sub-millimeter domain, the pioneering work by Smail et al. (1997) with SCUBA/JCMT, on the lensing clusters A370 and Cl2244-02, showed that the majority of lensed sources detected at 450 and 850 m lie at redshifts above . In more recent papers (Smail et al. 1998; Blain et al. 1998, 1999; Ivison et al. 2000; Smail et al. 2002; see also Kneib, this Conference), GTs have been used to trace the dust obscured star-formation activity at high-, thanks to enlarged samples of faint submillimeter-selected sources. It appears from these developments that the bulk of the 850m background radiation could be originated in distant ultraluminous galaxies, and that a large fraction of sources could be missing from optical surveys.
2.5. Identification and study of extremely high- sources
Nowadays, one of the most exciting challenges for GTs is the identification and study of extremely high- sources. Number of devoted surveys, using different techniques, are specifically tuned up to search for galaxies using GTs (see also Kneib, this Conference).
The first results of these systematic searches for galaxies in GTs have appeared during the last two years. A z double-imaged galaxy has been detected in the field of A2218 (Ellis et al. 2001). This source corresponds to an extremely faint and compact object (I), highly magnified (about a factor of ), with a SED dominated by the Ly emission line. According to the authors, this source could be a stellar system undergoing its first generation of stars. Another galaxy at z has been identified in the field of the cluster A370 by Hu et al. (2002). In this case, the magnification is a factor of for this source, which sets strong constraints on the reionization epoch. We present in Section 4. a particular ongoing project devoted to the identification of Population III candidates in lensing clusters.
3. Photometric Redshifts and Gravitational Telescopes
3.1. Photometric Redshifts, a unique tool in deep universe studies
Today, photometric redshifts (hereafter s) constitute a well established tool in deep universe studies. This technique was originally proposed by Baum (1962), to measure the redshifts of elliptical galaxies in distant clusters, and rediscovered later by several authors in the eighties (Couch et al. 1983, Koo 1985), this time applied to relatively low-redshift samples of galaxies observed in the to Å domain. The interest for this technique has increased later in the nineties, with the development of extremely large and/or deep field surveys.
Indeed, deep photometric galaxy samples have become available during the last decade, in particular the observations by HST of the HDF-N (Williams et al. 1996) and HDF-S (Casertano et al. 2000), and the coordinated complementary observations from the ground at near-IR wavelengths (Dickinson et al. 2001; Labbé et al. 2003). At the same time, reliable photometric redshift techniques have been developed by different authors, allowing distance estimates of faint galaxies for which no spectroscopic redshifts can be obtained nowadays, even with the most powerful telescopes (e.g. Connolly et al. 1997; Wang et al. 1998; Giallongo et al. 1998; Fernández-Soto et al. 1999; Arnouts et al. 1999; Bolzonella et al. 2000; Furusawa et al. 2000; Rodighiero et al. 2001; Rudnick et al. 2001; Le Borgne & Rocca-Volmerange 2002; and the references therein).
3.2. Methods and accuracy
There are basically two different techniques for measuring s : the so-called empirical training set method, and the SED fitting method. The first approach was originally proposed by Connolly et al. (1995, 1997). It consists on deriving empirically the relationship between magnitudes and redshifts using a subsample of objects with measured spectroscopic redshifts, i.e. the training set. A slightly modified version of this method was proposed by Wang et al. (1998) to derive redshifts in the HDF-N by means of a linear function of colours. The main advantages of this method are the small dispersion attained, even with a small number of filters, and the fact that it does not make use of any assumption concerning galaxy spectra or galaxy evolution, thus bypassing the problem of a poor knowledge of high redshift spectra. The main disadvantage is that the empirical relation between magnitudes and redshifts has to be recomputed for each filter set and survey, on a well suited spectroscopic subsample, thus making this approach not very flexible. In addition, the redshift range between and had been hardly reached by spectroscopy up to now, because of the lack of strong spectral features accessible to optical spectrographs. And efficient multi-object near-IR spectrographs are still missing on 10m class telescopes. Thus, no reliable empirical relation can be obtained in this interval.
In the SED fitting procedure, the photometric redshift of a given object simply corresponds to the best fit of its photometric SED by the set of template spectra, obtained through a standard minimization procedure. This method obviously relies on the fit of the overall shape of spectra and the detection of strong spectral features, such as the Å break, the Lyman decrement or particularly strong emission lines. In the nineties, this method has been applied to the HDF data, using either observed or synthetic template spectra (e.g. Mobasher et al. 1996; Lanzetta et al. 1996; Gwyn & Hartwick 1996; Sawicki et al. 1997; Giallongo et al. 1998; Fernández-Soto et al. 1999; Arnouts et al. 1999; Furusawa et al. 2000; Bolzonella et al. 2000; Rudnick et al. 2001). A combination of this method with the Bayesian marginalization introducing a prior probability was successfully proposed by Benítez (2000) (see also Coe, this Conference). The advantage of the SED fitting procedure is that no (large) spectroscopic training set is needed, although a control set is highly recommended.
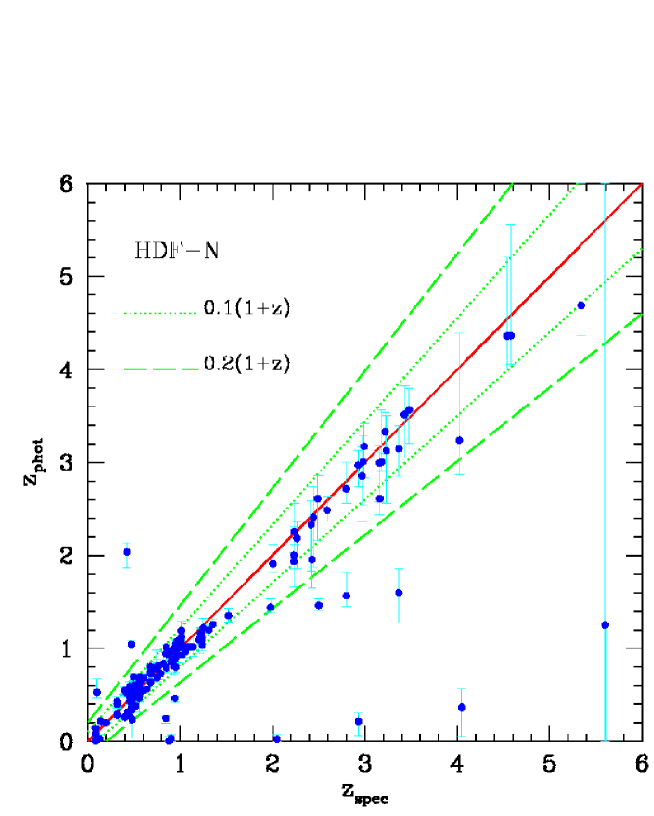
In order to estimate the accuracy of s , a crucial test is the comparison between the photometric and the spectroscopic redshifts obtained on a restricted subsample of relatively bright objects, even if there is no guarantee that we are dealing with the same type of objects in the photometric (faint) and the spectroscopic (bright) samples. A complete discussion on the expected accuracy of s , based on simulations and available spectroscopy in the HDFs, was presented by Bolzonella et al. (2000). In this paper the authors used the public code hyperz, which adopts a standard SED fitting method, but most results should be generalized to other tools. hyperz is available on the web at http://webast.ast.obs-mip.fr/hyperz. Figure 6 displays a comparison between spectroscopic and photometric redshifts in the HDF fields. The rms uncertainties on zphot are typically , and up to , depending on the photometric depth, the redshift of the sources and the spectral coverage of the filter set. Without near-IR data, errors on zphot are relatively higher in the redshift range , due to the lack of strong signatures in the observed SED between 3500Å and 9000Å. The 4000Å break span the near-IR domain at redshifts between 1.2 and 5. The gain using near-IR photometry is also sensible for the determination of rough spectral types, such as early versus late type galaxies, or star-galaxy-qso discrimination. A complete discussion can be found in Bolzonella et al. (2000).
3.3. Photometric Redshifts and lensed sources
Photometric Redshifts techniques in lensing clusters allow to determine the redshift distribution and properties of high- and/or faint samples of lensed galaxies, sometimes invisible otherwise. GTs with well constrained mass distributions enable to recover precisely the lens-corrected redshift distribution of background sources. Thus, s allow not only to select high-z lensed sources for subsequent spectroscopic studies (as seen in Section 2.), but also to obtain robust constraints on the statistical properties of the background population of galaxies.
One of the main issues is the determination of deep number counts, which are strongly related to the evolution of the spectral content of galaxies, a process driven by the star formation history. The cumulative redshift distributions, specially in the near-IR bands, can be used as a direct test for the scenarios of galaxy formation (Kauffmann & Charlot 1998; Fontana et al. 1999; Cole et al. 2000). Photometric Redshifts techniques have been recently applied to the study of galaxy properties up to the faintest magnitudes on the HDFs, to determine the star formation history at high redshift from the UV luminosity density (Lanzetta et al. 2002), the evolution of the luminosity functions (Bolzonella et al. 2002), and also to analyse the stellar population and the evolutionary properties of distant galaxies (e.g. SubbaRao et al. 1996; Gwyn & Hartwick 1996; Sawicki et al. 1997; Connolly et al. 1997; Pascarelle et al. 1998; Giallongo et al. 1998; Fernández-Soto et al. 1999; Poli et al. 2001), or to derive the evolution of the clustering properties (Arnouts et al. 1999; Magliocchetti & Maddox 1999, Arnouts et al. 2002). All these developments can be easily applied to lensing clusters for which deep multicolor photometric surveys are available.
A Monte-Carlo approach has been recently adopted by different authors to compute statistical quantities from photometric redshifts, such as the evolution of luminosity functions in deep photometric surveys, both in blank and strong lensing fields (SubbaRao et al. 1996; Dye et al. 2001). An interesting method was proposed by Bolzonella et al. (2002) to account for the non-gaussianity of the redshift probability functions, and specially to include degenerate solutions in redshift.
An interesting issue for s associated to GTs for the spectroscopic follow-up of faint amplified sources is the optimization of the survey, i.e. selecting the best spectral domain in the visible or near-IR bands in order to observe the strongest spectral features. An additional benefit of s is that this technique efficiently contributes to the identification of objects with ambiguous spectral features, such as isolated emission lines. An example of this is given in Campusano et al. (2001).
An important concern for the different methods is that the training set (or the control set in the case of SED fitting) is constituted by the brightest objects, for which a spectroscopic measure of the redshift could be obtained. There is no guarantee that we are dealing with the same type of objects in the photometric (faint) and the spectroscopic (bright) samples. Thanks to the magnification factor, cluster lenses allow the calibration of s beyond the spectroscopic limits in standard surveys, i.e. enlarging the training/control samples towards the faintest limits in magnitude.
Another interesting and still poorly explored domain is the combination between photometric and lensing redshifts. Indeed, lensing inversion and techniques produce independent probability distributions for the redshift of amplified sources. Therefore, the combination of both methods shall provide a robust way to determine the redshift distribution of the faintest sources, at least at , where the lensing inversion technique produces reliable results (Ebbels et al. 1998). In general, the determination is more accurate than the for individual objects, in particular at . Nevertheless, the combination of both probability distributions is particularly useful when a degenerate solution appears in .
3.4. Photometric Redshifts and lensing clusters
Cluster lenses become useful GTs when their mass distribution is highly constrained by multiple images, revealed by high resolution HST images or multicolor photometry. The technique is particularly useful to identify objects with similar SEDs, and thus to check the compatibility of multiple image configurations. A recent example has been published by Gavazzi et al. (2003), who derived the redshifts of the two main radial and tangential arc systems in the cluster MS2137-23 () from photometry, in order to improve the modeling of the central dark matter distribution. In this case, the redshift of the two arc systems is , in excellent agreement with the subsequent spectroscopic determination. s can be used advantageously when photometric data span a large wavelength range, and particularly if near-IR data are available, because this allows to obtain accurate redshifts in the sensitive region of .
Photometric redshifts are particularly useful to derive the mass from weak shear analysis. We can use s to discriminate between cluster and foreground galaxies to scale the lensing distance modulus in order to compute the mass from the gravitational convergence. The average convergence , which corresponds to the ratio between the surface mass density and the critical value for lensing, may be obtained as a function of the radial distance using different methods (see Mellier 1999 for a review). The mass within an aperture is given by
where are the angular size distances between the cluster (), the observer () and the source (), and is the averaged convergence within the radius . Using the redshift distribution N( ) computed through a suitable filter set, the mean value of can be computed, thus leading to a fair estimate of the mass. This method has been recently applied by Athreya et al. (2002) to determine the mass of the lensing cluster MS1008-1224. King et al. (2002) have used a similar procedure in A1689 to select background galaxies for their first detection of weak gravitational shear at infrared wavelengths. Because of the small projected surface across the redshift space, the effective surface which is “seen” through a cluster lens is relatively small, thus producing a strong variance from field to field. Obtaining the distribution for each cluster helps improving the mass determination.
Another different strategy for cluster mass reconstruction using lens magnification and techniques was proposed by Dye et al. (2001), with an application to Abell 1689. These authors used for the first time the lens magnification inferred from the luminosity function of background sources when scaling the convergence to real lens mass.
Photometric redshifts are also particularly useful to improve the detection of clusters in wide-field surveys, as well as to properly identify the visible counterpart of complex and multiple lenses. Examples of composite lenses recently identified by are MS1008-1224 (Athreya et al. 2002), where a secondary lens exists at in addition to the main cluster, and the Cloverleaf field (Kneib et al. 1998). Thompson et al. (2001) have used a deep optical and near-infrared survey to properly identify a massive cluster of galaxies at z with the X-ray source RX J105343+5735. Photometric redshifts techniques have been recently applied to the ESO Distant Cluster Survey (EDisCS, White et al. 2003, in preparation), which contains two different samples of clusters: a low- sample at , for which BVIK photometry is available, and a high- sample at , with VRIJK photometry. The first comparison between spectroscopic and photometric redshifts (on 500 spectra) confirms the excellent behaviour of , the typical dispersion beeing and for the low and the high- samples respectively. These results illustrate the typical accuracy that we can expect with well suited photometric data, at least up to a redshift of .
4. Looking for the first sources with Gravitational Telescopes
4.1. Recent developments in PopIII studies
One of the main possible applications of GTs is the research and study of the very first stars and galaxies forming from pristine matter in the early Universe, the so-called Population III objects (cf. review of Loeb & Barkana 2001; Weiss et al. 2000; Umemura & Susa 2001). These sources constitute the first building blocks of galaxies. Their detection still remains one of the major challenges of present day observational cosmology. The recent WMAP results seem to place these PopIII objects at redshifts up to 10–30 (Kogut et al. 2003), a redshift domain where the most relevant signatures are expected in the near-IR window. During the last years, modeling efforts have been motivated by future space facilities such as JWST, which should be able to observe these objects at redshifts up to 30. Nevertheless, the detection and first studies on the physical properties of Population III objects could likely be started earlier using ground-based 10m class telescopes, and well suited near-IR facilities, such as Isaac/VLT, the multi-object spectrograph EMIR at GTC ( 2006), or the future KMOS for the second generation of VLT instruments ( 2008), at least up to z 18.
According to modeling results, several observational signatures of Pop III stars and galaxies (i.e. ensembles/clusters of Pop III stars) are expected. In summary:
-
•
Strong UV emission and characteristic recombination lines of hydrogen and He II, especially Lyman and HeII1640 (Tumlinson & Shull 2000, Bromm et al. 2001, Schaerer 2002, 2003).
-
•
Mid-IR molecular hydrogen lines at 2.12 m and longer wavelengths formed in cooling shells (Ciardi & Ferrara 2001).
-
•
Individual supernovae whose visibility in the rest-frame optical and near-IR could be enhanced due to time dilatation (Miralda-Escude & Rees 1997, Heger et al. 2001).
-
•
High energy neutrinos from Pop III gamma-ray bursts possibly associated with fast X-ray transients (Schneider et al. 2002).
Rest-frame UV stellar and nebular continuous and recombination line emission represent the largest fraction of the energy emitted by Population III objects, which are generally thought to be predominantly massive or very massive stars, up to (e.g. Abel et al. 1998; Bromm et al. 2002; Nakamura & Umemura 2001; Nakamura & Umemura 2002). The predicted rest-frame UV to optical spectra of Pop III galaxies including the strongest emission lines (Lyman , HeII1640 and others) have recently been computed by Schaerer (2002, 2003). The existence of a significant population of PopIII, or extremely metal-poor objects, at redshifts 10 is supported by several indications, including observations of Ly- emitters with unusually large equivalent widths in the LALA survey (Malhotra & Rhoads 2002) and the recent simulations of Scannapieco et al. (2003) accounting for the non-homogeneous chemical evolution and pollution of the Universe.

4.2. PopIII observational signatures
Simulations have been carried out using the recent models by Schaerer (2002) to demonstrate the feasability of this scientific case in view of the future near-IR facilities mentioned above. The aim is to determine a well suited identification criteria for PopIII galaxies, and to study the feasability of spectroscopic observations in the near-IR domain. Some preliminary results have been shown in Schaerer & Pelló (2000) and Pelló & Schaerer (2002).
The SED of PopIII sources is dominated by the nebular continuous emission at Å, and several strong emission lines are present, such as Lyman , HeII1640, HeII3203, HeII4686 and others. We have considered different IMFs and ages for the stellar population, as well as two different star formation regimes (starburst and continuous star formation), following the prescriptions given by Schaerer (2002). Lyman series troughs (Haiman & Loeb 1999), and Lyman forest following the prescription of Madau (1995) are included. The reionization redshift is assumed to be 6. The virial radius is of the order of a few kpc for these sources, and thus we consider that sources are unresolved on a 0.3” scale, with spherical symetry. Different series of simulations have been performed to account for different hypothesis for the extended Ly halo (cf. Loeb & Rybicki 1999).
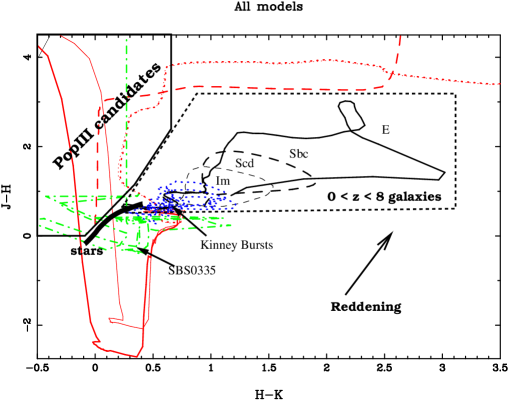
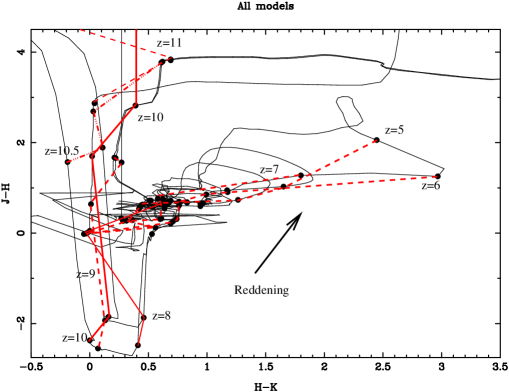
Figure 7 displays the J-H versus H-Ks color-color diagram (Vega system) for Pop III objects obtained from these simulations, showing the expected position of objects at different redshifts over the interval of 5 to 12, and the location for the most promising Pop III candidates. Various models for Pop III objects are presented in Figure 7. In particular, models are computed assuming different fractions of Lyman emission entering the integration aperture: 100% (thick solid lines), 50% (thin solid lines), and 0% (thin dotted lines). The expected colors obtained within an integration aperture corresponding to the core (non-resolved) source, whith Lyman emission coming from an extended halo (Loeb & Rybicki 1999), are displayed by thick dotted lines. The colors expected for a pure stellar population are given for comparison as dashed thick lines. We used a Salpeter IMF to derive the synthetic spectra in all cases. The location of stars and normal galaxies at is also given for comparison, as well as starbursts templates (SB1 and SB2, from Kinney et al. 1993, and the low metallicity galaxy SBS0335-052). The strong UV continuum and the presence of prominent emission lines allow to discriminate between PopIII objects with and normal galaxies or stars. Even “normal” galaxies at will exhibit redder H-K colors (which trace the restframe UV slope) as compared to PopIII. Because of the limiting magnitudes in the different filters, most PopIII candidates are expected to fall within the “PopIII candidates” region. This diagram illustrates that PopIII objects with strong ionising continua can well be separated from ”normal” objects provided that ultra-deep JHK photometry with sufficient accurary is available.
We have also computed the expected S/N ratios for the main emission lines, as seen through a 10m telescope, using a medium resolution spectrograph (R). According to our results, Lyman can easily be detected with a good S/N over the redshift intervals z 8 to 18, with some gaps, depending on the spectral resolution (OH subtraction) and atmospheric transmission. A joint detection with HeII 1640, the strongest HeII line, is possible for z 5.5-7.5 (Lyman in optical domain), z 8-14 with both lines in the near-IR, again with some gaps. The typical line fluxes for the HeII 1640 line range between and a few erg/s/cm2, for a fiducial stellar mass halo of M, corresponding to a collapsing dark matter halo of . The detection of both HeII 1640 and Ly allows one e.g. to obtain a measure of the hardness of the ionising flux which constrains the upper end of the IMF and the age of Pop III systems.
Thus, according to our results, efficient photometric and spectroscopic observations of these features should be possible in the near-IR domain, thanks to the future imaging and spectroscopic facilities, for a large number of sources, thus allowing to derive statistically significant conclusions about their formation epoch and physical properties. Broad-band photometry is quite insensitive to changes in the IMF, and broad-band colors do not allow to constrain physical properties such as the IMF (i.e. the mass range of Pop III stars), ages, etc., but could be useful to identify the sources on ultra-deep photometric surveys. Spectroscopy is needed to study the physics of these objects.
4.3. A search for PopIII candidates behind lensing clusters
PopIII objects could be detected from deep near-IR photometry based on a measurement of two colors with accuracies of the order of 0.3 mag. Ideal fields for the first studies are lensing clusters of galaxies with areas of strong gravitational amplification. A devoted and prototype observational program is presently going on, aimed at the detection of Population III objects at high using GTs.
During the last year we were granted ISAAC/VLT time to obtain ultra-deep JHK’ images of a gravitational lensing clusters in order to search for PopIII candidates using our above mentioned color-color criteria. Two lensing clusters were observed up to now: AC114 (), images obtained late August 2002, and Abell 1835 (), observed in March 2003. At present, only data on AC114 have been analyzed. Images were obtained under excellent seeing (0.4-0.6”) and photometric conditions. The limiting magnitudes attained (3 / 4pixels) are J, H and K’ in the Vega system. From the first investigations on AC114, several () candidate PopIII galaxies are found in the selection window, with magnitudes 23–24 (Vega system) and estimated redshifts of 8–11. All these objects are R-dropouts, located close to the theoretical position with respect to the critical lines. A few of them are brighter than 24 (including 1–2 mag amplification). They constitute the first spectroscopic targets for spectroscopic follow-up with ISAAC/VLT in the subsequent months.
The expected number of Pop III objects and primordial QSOs in blank fields has been derived by several authors. E.g. in a comprehensive study Ciardi et al. (2000) show that at z 8 naked stellar clusters, i.e. objects which have completely blown out their ISM, and thus avoid local chemical enrichment, dominate the population of luminous objects. Although pilot studies have recently started to explore the possible formation of dust in Pop III objects (Todini & Ferrara 2001), the effect is generally neglected. Based on such assumptions, Oh et al. (2001) have calculated the predicted number of Pop III objects detectable in HeII lines with JWST for a one day integration time. Their estimate yields between 60 and 4500 sources in a 10’x10’ field of view, depending on the model parameters. These estimates are still highly uncertain and model dependent.
In Figure 8 we compare the expected number counts of PopIII objects with K’ 24 in our GT ongoing survey, within the field of view of Isaac, per 0.1 redshift bin interval, using different assumptions for the IMF. A simple Press-Schechter formalism for the abundance of halos and standard CDM cosmology were considered in these simulations, as well as a conservative fixed fraction of the baryonic mass in halos converted into stars, assuming that all stars are PopIII, without chemical evolution (Richard et al., in preparation). Thus, number counts shown in Figure 8 have to be considered as a first order estimate, the important point beeing the comparison between lensing and blank fields. The typical results expected in the strong lensing regime, towards the lensing cluster AC114, are compared to the corresponding ones in blank fields surveys, for the same photometric depth. The gain in the z domain when taking advantage of the lensing amplification is typically a factor of 10. The expected density of primordial quasars could be similar to that of PopIII galaxies (Oh et al. 2001). Thus, multiplexing is needed in blank and lensing fields to allow highly efficient observations of relevant samples of Pop III objects. Also, because the observational signatures of primordial quasars are expected to be similar to those of genuine Pop III stars, a relatively high resolution is needed to obtain line profiles.
5. Conclusions
Gravitational Telescopes still remain a unique tool in deep universe studies. The recent developments in the sub-millimetric and mid-infrared domains, the search for extremely faint EROs and primordial galaxies, and the detailed study of the spectrophotometric and morphological properties of galaxies beyond the spectroscopic limits argue in favour of this technique.
Recent results obtained by different authors on the physical properties of faint lensed galaxies (such as AC114-S2, AC114-A2, or the sources in 1E0657-558) suggest that high- objects of different luminosities were subjected to different histories of star formation. But these results are based on a dramatically small number of objects. Enlarged samples of galaxies in both redshift and luminosity, specially in the redshift range 1.5 z 6, are urgently needed to set strong constrains on galaxy evolution scenarios. The systematic use of GTs to access the most distant and faintest population of galaxies can help achieving this goal.
An important issue for future spectroscopic studies of very high-z primordial galaxies is the strategy for target selection. Photometric redshifts and various color-selection techniques have demonstrated their ability to produce samples of high-z objects. Even young Pop III sources or extremely metal-deficient starbursts are expected to show distinct characteristics in their near-IR colors compared to “normal” galaxies at any redshift. GTs with areas of strong gravitational amplification are the ideal fields for the first prospective studies. Thanks to its multiplexing, spectral resolution and wide field-of-view capabilities, the forthcoming next generation of ground-based near-IR spectrographs, such as EMIR at Grantecan (http://www.iac.es/gtc/index.html) or the future KMOS for the VLT, are the suited instruments to complement JWST performances and to start exploring the formation epoch of the first stars in galaxies.
Acknowledgments.
Part of this work was supported by the French Centre National de la Recherche Scientifique, by the TMR Lensnet ERBFMRXCT97-0172 (http://www.ast.cam.ac.uk/IoA/lensnet), by the French Conseil Régional de la Martinique, and the ECOS SUD Program.
References
Abel, T., Anninos, P.A., Norman, M.L., Zhang, Y., 1998, ApJ, 508, 518
Adelberger, K. L. & Steidel, C. C. 2000, ApJ, 544, 218
Altieri, B., Metcalfe, L., Kneib, J. P., et al. 1999, A&A, 343, L65
Arnouts, S., Cristiani, S., Moscardini, L., Matarrese, S., Lucchin, F., Fontana, A. & Giallongo, E., 1999, MNRAS, 310, 540
Arnouts, S., Moscardini, L., Vanzella, E., Colombi, S., Cristiani, S., Fontana, A., Giallongo, E., Matarrese, S. & Saracco, P., 2002, MNRAS, 329, 355
Athreya, R. M., Mellier, Y., van Waerbeke, L., Pelló, R., Fort, B., & Dantel-Fort, M. 2002, A&A, 384, 743
Baum, W.A. 1962, IAU Symposium n. 15, Macmillan Press, New York, p.390
Benítez, N. 2000, ApJ, 536, 571
Bézecourt, J., Soucail, G., Ellis, R. S., & Kneib, J.-P. 1999, A&A, 351, 433
Blain, A. W., Smail, I., Ivison, R. J., & Kneib, J.-P. 1999, MNRAS, 302, 632
Blain, A. W., Kneib, J.-P., Ivison, R. J., & Smail, I. 1999, ApJ, 512, L87
Bolzonella M., Miralles J.M., Pelló R., 2000, A&A, 363, 476
Bolzonella M., Pelló R., Maccagni D., 2002, A&A, 395, 443
Bromm, V. , Kudritzki, R.P., Loeb, A., 2001, ApJ, 552, 464
Bromm, V., Coppi, P.S., Larson, R.B., 2002, ApJ, 564, 23
Campusano, L. E., Pelló, R., Kneib, J.-P., Le Borgne, J.-F., Fort, B., Ellis, R., Mellier, Y., & Smail, I., 2001, A&A, 37, 394
Casertano, S., de Mello, D., Dickinson, M., et al., 2000, AJ, 120, 2747
Chapman, S. C., Scott, D., Steidel, C. C. et al. 2000, MNRAS, 319, 318
Ciardi, B., Ferrara, A., Governato, F., Jenkins, A., 2000, MNRAS, 314, 611
Ciardi, B., Ferrara, A., 2001, MNRAS, 324, 648
Cole, S., Lacey, C., Baugh, C. & Frenk, C. 2000, MNRAS, 319, 168
Connolly, A.J., Csabai, I., Szalay, A.S., Koo, D.C., Kron, R.G., Munn, J.A., 1995, AJ, 110, 2655
Connolly, A. J., Szalay, A. S., Dickinson, M., SubbaRao, M. U., Brunner, R. J., 1997, ApJ, 486, L11
Contini, T., Treyer, M. A., Sullivan, M., & Ellis, R. S. 2002, MNRAS, 330, 75
Couch, W.J., Ellis, R.S., Godwin, J., Carter, D., 1983, MNRAS, 205, 1287
Dickinson, M., Papovich, C., Ferguson, H. C., 2001, Proceedings of the ESO Symposium, “Deep Fields”, ed. S. Cristiani (Berlin: Springer), astro-ph/0105086.
Dye, S., Taylor, A. N., Thommes, E. M., Meisenheimer, K., Wolf, C. & Peacock, J. A., 2001, MNRAS, 321, 685
Ebbels, T. M. D., Le Borgne, J. -F., Pelló, R., Ellis, R. S., Kneib J. -P., Smail, I.; Sanahuja, B., 1996, MNRAS, 281, L75
Ebbels, T., Ellis, R., Kneib, J., Le Borgne, J., Pelló, R., Smail, I., & Sanahuja, B., 1998, MNRAS, 295, 75
Ellis, R. S., Colless, M., Broadhurst, T., Heyl, J., & Glazebrook, K. 1996, MNRAS, 280, 235
Ellis, R., Santos, M. R., Kneib, J., & Kuijken, K. 2001, ApJ, 560, L119
Erb, D. K., Shapley, A. E., Steidel, C. C., Pettini, M., Adelberger, K. L., Hunt, M. P., Moorwood, A. F. M., Cuby, J.-G., 2003, ApJ in press, astro-ph/0303392
Fernández-Soto, A., Lanzetta, K.M. & Yahil, A. 1999, ApJ, 513, 34
Fort B. & Mellier Y., 1994, A&AR 5, 239
Fontana A., Menci N., D’Odorico S., Giallongo E.,et al. 2001, MNRAS, 310, L27
Franx, M., Illingworth, G. D., Kelson, D. D., van Dokkum, P. G., & Tran, K. 1997, ApJ, 486, L75
Frye, B. & Broadhurst, T. 1998, ApJ, 499, L115
Furusawa, H., Shimasaku, K., Doi, M., Okamura, S., 2000, ApJ, 534, 624
Gavazzi, R., Fort, B., Mellier, Y., Pello, R., Dantel-Fort, M., 2003, A & A in press, astro-ph/0212214.
Giallongo, E., D’Odorico,, S., Fontana, A., Cristiani, S., Egami, E., Hu, E. & McMahon, R. G., 1998, AJ, 115, 2169
Gwyn, S. D. J. & Hartwick F. D. A., 1996, ApJ, 468, L77
Haiman, Z., Loeb, A., 1998, ApJ, 503, 505
Hammer, F., Gruel, N., Thuan, T. X., Flores, H., & Infante, L. 2001, ApJ, 550, 570
Heger, A., Woosley, S. E., Baraffe, I., Abel, T., 2001, Proc. MPA/ESO/MPE/USM Joint Astronomy Conference ”Lighthouses of the Universe: The Most Luminous Celestial Objects and their use for Cosmology”, p. 369
Hu, E. M., Cowie, L. L., McMahon, R. G., Capak, P., Iwamuro, F., Kneib, J.-P., Maihara, T., & Motohara, K. 2002, ApJ, 568, L75
Ivison, R. J., Smail, I., Barger, A. J., Kneib, J.-P., Blain, A. W., Owen, F. N., Kerr, T. H., & Cowie, L. L. 2000, MNRAS, 315, 209
King, L. J., Clowe, D. I., Lidman, C., Schneider, P., Erben, T., Kneib, J.-P., & Meylan, G. 2002, A&A, 385, L5
Kneib, J.-P., Mathez, G., Fort, B., Mellier, Y., Soucail, G. & Longaretti, P.-Y., 1994, A&A, 286, 701
Kneib, J.-P., Ellis, R.S., Smail, I., Couch, W.J., Sharples, R., 1996, ApJ, 471, 643
Kneib, J.-P., Alloin, D., & Pelló, R. 1998, A&A, 339, L65
Kauffmann, G. & Charlot, S. 1998, MNRAS, 297, L23
Kobulnicky, H. A. & Zaritsky, D. 1999, ApJ, 511, 118
Kogut, A., Spergel, D. N., Barnes, C., Bennett, C. L., Halpern, M., G. Hinshaw , G. , Jarosik ,N. Limon , M., Meyer, S. S., Page , L., Tucker, G., Wollack, E., Wright, E. L., 2003, submitted to ApJ, astro-ph/0302213.
Koo, D.C., 1985, AJ, 90, 418
Labbé, I. et al. 2003, AJ, 125, 1107
Lanzetta, K.M., Yahil, A., Fernández-Soto, A. 1996, Nature 381, 759
Lanzetta, K. M., Yahata, N., Pascarelle, S., Chen, H., & Fernández-Soto, A. 2002, ApJ, 570, 492
Le Borgne, D. & Rocca-Volmerange, B., 2002, A&A, 386, 446
Leitherer, C. 1999, Chemical Evolution from Zero to High Redshift, Proceedings of ESO Workshop, Garching, Germany, 14-16 October 1998. Eds. R. Walsh, M. R. Rosa. Berlin: Springer-Verlag , 204
Lemoine-Busserolle, M., Contini, T., Pelló, R., Le Borgne, J.-F., Kneib, J.-P., & Lidman, C. 2003, A&A, 397, 839
Lilly, S. J., Le Fevre, O., Crampton, D., Hammer, F., & Tresse, L. 1995, ApJ, 455, 50
Loeb, A. & Barkana, R., 2001, ARA&A, 39, 19
Madau, P. 1995, ApJ, 441, 18
Magliocchetti, M. & Maddox, S. J., 1999, MNRAS, 306, 988
Malhotra, S. & Rhoads, J. E. 2002, ApJ, 565, L71
Mehlert, D., Seitz, S., Saglia, R. P., Appenzeller, I., Bender, R., Fricke, K. J., Hoffmann, T. L., Hopp, U., Kudritzki, R.-P., Pauldrach, A. W. A., 2001, ApJ, 379, 96
Mehlert, D. et al. , 2002, A&A, 393, 809
Melbourne, J. & Salzer, J. J. 2002, AJ, 123, 2302
Mellier, Y., Fort, B., Soucail, G., Mathez, G., & Cailloux, M. 1991, ApJ, 380, 334
Mellier, Y., 1999, ARA & A 37, 127
Miralda-Escude, J., Rees, M.J., 1997, ApJ, 478, L57
Mobasher, B., Rowan-Robinson, M., Georgakakis, A., Eaton, N., 1996, MNRAS, 282, L7
Mouhcine, M. & Contini, T. 2002, A&A, 389, 106
Nakamura, F., Umemura, M., 2001, ApJ, 548, 19
Nakamura, F., Umemura, M., 2002, ApJ, 569, 549
Natarajan, P., Kneib, J., Smail, I., & Ellis, R. S. 1998, ApJ, 499, 600
Oey, M. S. & Kennicutt, R. C. 1993, ApJ, 411, 137
Oh, S. P., Haiman, Z., & Rees, M. J. 2001, ApJ, 553, 73
Pascarelle, S. M., Lanzetta, K. M. & Fernández-Soto, A., 1998, ApJ, 508, L1
Pelló, R., Kneib, J.-P., Le Borgne J.-F., Bezecourt, J., Ebbels, T. M., Tijera, I., Bruzual, G., Miralles, J. M., Smail, I., Soucail, G., Bridges, T. J., 1999, A&A, 346, 359
Pelló, R., D. Schaerer, 2002, Proceedings of ”Science with the GTC”, Granada, Spain, (astro-ph/0203203), to be published in Revista Mexicana de Astronomia y Astrofisica.
Pettini, M., Kellogg, M., Steidel, C. C., Dickinson, M., Adelberger, K. L., Giavalisco, M., 1998, ApJ, 508, 539
Pettini, M., Steidel, C. C., Adelberger, K. L., Dickinson, M., Giavalisco, M., 2000, ApJ, 528, 96
Pettini, M., Shapley, A. E., Steidel, C. C., et al., 2001, ApJ, 554, 981
Pettini, M., Rix, S. A., Steidel, C. C., Adelberger, K. L., Hunt, M. P., Shapley, A. E., 2002a, ApJ, 569, 742
Pettini, M., Ellison, S. L., Bergeron, J., Petitjean, P., 2002b, A&A, 391, 21
Poli, F., Menci, N., Giallongo, E., Fontana, A., Cristiani, S., D’Odorico, S., 2001 , ApJ, 551, L45
Richer, M. G. & McCall, M. L. 1995, ApJ, 445, 642
Rodighiero, G., Franceschini, A. & Fasano, G., 2001, MNRAS, 324, 491
Rudnick, G., Franx, M., Rix, H.-W., Moorwood, A., Kuijken, K., van Starkenburg, L., van der Werf, P., Röttgering, H., van Dokkum, P. & Labbe, I., 2001, AJ, 122, 2205
Sawicki, M. J., Lin, H. & Yee, H. K. C., 1997, AJ, 113, 1
Scannapieco, E., Schneider, R., Ferrara, A., 2003, Apj in press, astro-ph/0301628
Schaerer, D. 2002, A&A, 382, 28
Schaerer, D. 2003, A&A, 397, 527
Schaerer, D. & Pelló R., 2001, in ”Scientific Drivers for ESO Future VLT/VLTI Instrumentation”, J. Bergeron and G. Monnet, Eds., Springer Verlag, p.48, astro-ph/0107274
Schneider, R., Guetta, D., & Ferrara, A. 2002, MNRAS, 334, 173
Seitz, S., Saglia, R. P., Bender, R., Hopp, U., Belloni, P., & Ziegler, B. 1998, MNRAS, 298, 945
Smail, I., Ellis, R. S., Aragon-Salamanca, A., Soucail, G., Mellier, Y., & Giraud, E. 1993, MNRAS, 263, 628
Smail, I., Couch, W. J., Ellis, R. S., & Sharples, R. M. 1995, ApJ, 440, 501
Smail, I., Dressler, A., Kneib, J., Ellis, R. S., Couch, W. J., Sharples, R. M., & Oemler, A. J. 1996, ApJ, 469, 508
Smail, I., Ivison, R. J., & Blain, A. W. 1997, ApJ, 490, L5
Smail, I., Ivison, R. J., Blain, A. W., & Kneib, J.-P. 1998, ApJ, 507, L21
Smail, I., Ivison, R. J., Blain, A. W., & Kneib, J.-P. 2002, MNRAS, 331, 495
Smith, G. P., Smail, I., Kneib, J.-P., Czoske, O., Ebeling, H., Edge, A. C., Pelló, R., Ivison, R. J., Packham, C., Le Borgne, J.-F., 2002, MNRAS, 330, 1
Soifer, B. T., Neugebauer, G., Franx, M., Matthews, K., & Illingworth, G. D. 1998, ApJ, 501, L171
Soucail, G., Mellier, Y., Fort, B., Mathez, G., & Cailloux, M. 1988, A&A, 191, L19
Soucail, G., Kneib, J. P., Bézecourt, J., Metcalfe, L., Altieri, B., & Le Borgne, J. F. 1999, A&A, 343, L70
Steidel, C. C., Pettini, M., & Hamilton, D. 1995, AJ, 110, 2519
Steidel, C. C., Giavalisco, M., Dickinson, M., & Adelberger, K. L. 1996, AJ, 112, 352
Steidel, C. C., Adelberger, K. L., Giavalisco, M., Dickinson, M., & Pettini, M. 1999, ApJ, 519, 1
SubbaRao, M. U., Connolly, A. J., Szalay, A. S. & Koo, D. C., 1996, AJ, 112, 929
Telles, E. & Terlevich, R. 1997, MNRAS, 286, 183
Teplitz, H. I., McLean, I. S., Becklin, E. E., et al., 2000, ApJ, 533, L65
Thompson, D. et al. 2001, A&A, 377, 778
Todini, P., Ferrara, A., 2001, MNRAS, 325, 726
Trager, S. C., Faber, S. M., Dressler, A., & Oemler, A. J. 1997, ApJ, 485, 92
Tumlinson, J., Shull, J.M., 2000, ApJ, 528, L65
Wang, Y., Bahcall, N., Turner, E.L., 1998, AJ, 116, 2081
Weiss, A., Abel, T., Hill, V., Eds., 2000, “The First Stars”, MPA/ESO Workshop 1999, Garching, Spring Verlag, Heidelberg.
Williams, R. E., Blacker, B., Dickinson, M., et al., 1996, AJ, 112, 1335
Umemura, M., Susa, H. Eds., 2001,”The physics of galaxy formation” ASP Conf. Series, Vol. 222
Yee, H. K. C., Ellingson, E., Bechtold, J., Carlberg, R. G., & Cuillandre, J.-C. 1996, AJ, 111, 1783
Zaritsky, D., Kennicutt, R. C., & Huchra, J. P. 1994, ApJ, 420, 87