The Chandra Deep Field-North Survey. XV.
Optically Bright, X-ray Faint
Sources1
Abstract
We have analyzed optically bright, X-ray faint [OBXF; i.e., ] sources identified in an 178.9 arcmin2 area having high exposure ( ks) within the Chandra Deep Field-North (CDF-N) 2 Ms survey. We find 43 OBXF sources in this area, comprising % of the X-ray sources above a 0.5–2 keV flux of erg cm-2 s-1. We present spectroscopic identifications for 42 of the OBXF sources and optical spectra for 25, including 5 previously unpublished redshifts. Deep optical imaging data (either HST or ground-based) are presented for all the OBXF sources; we measure the optical morphologies of the 20 galaxies having HST imaging data. The OBXF population consists mainly of normal and starburst galaxies detected out to cosmologically significant distances (i.e., to a median redshift of and a full redshift range –0.845). This is notable since these distances equate to look-back times of up to Gyr; we are thus provided with a window on the X-ray emission from galaxies at redshifts much closer to the cosmic star formation peak than was possible prior to Chandra.
The X-ray luminosity distribution of OBXF sources extends to higher luminosity than does that of “normal” galaxies indicating that a significant fraction are likely dominated by low-luminosity AGN (LLAGN) or vigorous star formation. The lowest redshift galaxies (–0.2) have very low X-ray-to-optical flux ratios [i.e., ] which are consistent with those of normal galaxies in the local Universe. By combining the detected X-ray counts, we find the average OBXF X-ray spectrum to be consistent with a power law. The 0.5–2 keV – for the OBXF galaxies is much steeper () than for the general X-ray source population. Indeed, the number of OBXF sources has doubled between the 1 Ms and 2 Ms survey, rising sharply in numbers at faint fluxes. The extragalactic OBXF sources are found to contribute –2% of the soft extragalactic X-ray background.
We report on the discovery of five candidate off-nuclear ultraluminous X-ray sources ( erg s-1) with –0.2 within the OBXF population. These sources are “ultraluminous” in that they are typically more X-ray luminous than e.g., Eddington-limited accretion onto stellar-mass black holes; these sources are found to dominate the X-ray emission of their host galaxies. Included among the ULX sources is the remarkable object CXOHDFN J123721.6+621246, which is located along the arm of a grand-design spiral galaxy at . This object exhibits strong signs of X-ray variability and is likely an X-ray binary system.
1 Introduction
Recent deep X-ray surveys have revealed a population of optically bright, X-ray faint sources (e.g., Hornschemeier et al., 2001, hereafter Paper II; Tozzi et al. 2001). The low X-ray-to-optical flux ratios [] are notable because the bulk of the X-ray background is produced by AGN typically having . These sources arise mainly at very faint X-ray fluxes ( erg cm-2 s-1, 0.5–2.0 keV; e.g., Paper II; Tozzi et al., 2001) and usually lie at . Their correspondingly low X-ray luminosities (erg s-1) along with their optically normal spectra indicate that their high-energy emission is not obviously dominated by luminous active galactic nuclei (AGN). These sources thus appear to be the distant analogs of “normal” galaxies in the local Universe.
Previous studies of this population (at shallower depths) have necessarily concentrated on intermediate X-ray-to-optical flux ratios [e.g., ] where the numbers of sources were sufficient for significant astrophysical constraints to be placed. However, more quiescent galaxies (such as our own Milky Way) are expected to arise at even lower X-ray-to-optical flux ratios [i.e., ]. Studies at these extremely low X-ray-to-optical flux ratios were hardly possible before reaching a depth of 2 Ms with (the number of such sources doubled between the 1 Ms and 2 Ms samples). With 2 Ms of exposure, we find these sources to comprise a significant fraction of the most X-ray faint sources (% of sources having erg cm-2 s-1, 0.5–2 keV).
Optically bright, X-ray faint (OBXF) objects offer a window into the high-energy processes in galaxies at cosmologically significant look-back times, allowing the study of accretion onto stellar-mass compact objects, supernova remnants, low-level accretion onto supermassive black holes, and hot gas in the interstellar media of large early-type galaxies over timescales of billions of years. The majority of the X-ray sources in the Universe are expected to be these more quiescent galaxies, while the luminous AGN which dominate the flux of the X-ray background are a minority. This study is the distant analog to X-ray surveys of galaxies in the local Universe (e.g., David, Jones, & Forman, 1992; Read, Ponman, & Strickland, 1997; Shapley, Fabbiano, & Eskridge, 2001).
As mentioned, there has been some work carried out using deep X-ray surveys to examine sources with lower X-ray-to-optical flux ratios []. At intermediate values of the X-ray-to-optical flux ratio [], the majority of X-ray sources has been shown to be considerably more “active” than nearby normal galaxies and appear to be the –1.3 analog of nearby luminous infrared galaxies (Alexander et al. 2002, hereafter Paper XI; Bauer et al. 2002, hereafter Paper XII). There have also been statistical studies of optically selected galaxies which used X-ray stacking techniques to probe X-ray emission below the individual point source detection threshold of, e.g., 1 Ms surveys. These studies (e.g., Hornschemeier et al., 2002, hereafter Paper VIII) have probed even lower X-ray-to-optical flux ratios [] and demonstrated that the large population of quiescent field spiral galaxies is much less X-ray luminous than the typical X-ray detected galaxies 1 Ms Chandra surveys (Hornschemeier et al., 2002, hereafter Paper VIII).
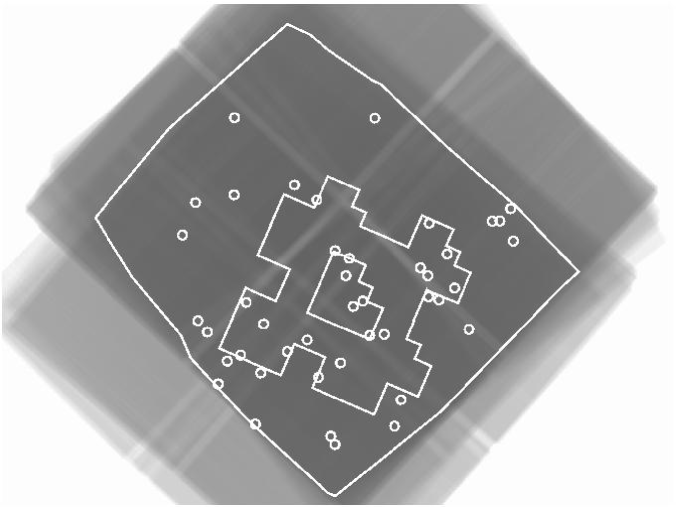
The current paper reaches to the low X-ray-to-optical flux ratios of Paper VIII, but for the first time we are able to concentrate on the individually X-ray detected objects. This paper focuses on individually X-ray detected galaxies (of all morphological types) with above a 0.5–2.0 keV flux limit of erg cm-2 s-1(on-axis). One of the driving goals of this paper is to isolate a well-defined sample of “normal” galaxies within the X-ray source population for future comparisons (e.g., with SIRTF). We have used an area within the 2 Ms CDF-N survey (Alexander et al., 2003, hereafter Paper XIII), chosen because of its high effective exposure ( ks throughout most of the area; see Figure 1) and its overlap with the Great Observatories Origins Deep Survey (GOODS) area where HST Advanced Camera for Surveys (ACS) observations have recently been obtained and SIRTF observations will be obtained later this year.
In §2 we present the X-ray, optical, and near-infrared data used in this paper. In §3 we define the OBXF sample. In §4 we present optical spectra and describe the general optical properties of the OBXF sources, including their colors and morphologies. In §5 we cover the X-ray properties of the OBXF population, including their luminosity distribution, X-ray spectral constraints, and X-ray number counts. In §6 we discuss whether the OBXF galaxies are in fact “normal” and investigate the nature of off-nuclear X-ray sources within the OBXF population.
The Galactic column density along this line of sight is cm-2 (Stark et al., 1992). An km s-1 Mpc-1 and cosmology is adopted throughout this paper. Coordinates are equinox J2000.
2 Data and Source Detection
2.1 Chandra ACIS Data and Source Detection
The X-ray data analysis performed here is essentially the same as performed in Paper XIII. In this section we briefly describe the techniques. The data (described in Paper XIII) were obtained during 20 separate observations by the Chandra Advanced CCD Imaging Spectrometer (ACIS; Weisskopf et al., 2002; Garmire et al., 2003) between 1999 Nov and 2002 Feb.
The ACIS-I observations of the CDF-N cover a solid angle of 462.3 arcmin2. However, the high-sensitivity region used in this study only covers 178.9 arcmin2 of the combined observation; this region is hereafter referred to as the High-Exposure Area (HEA; see Figure 1). The flux limit in the central part of this area is erg cm-2 s-1(0.5–2.0 keV, see Paper XIII), decreasing to erg cm-2 s-1at the outer edge of the HEA. Within this area, we can thus detect galaxies with luminosities as faint as rest-frame (0.5–2.0 keV) erg s-1, erg s-1, and erg s-1 at , 0.5, and 1.0, respectively.
The average background over the HEA, excluding source counts, is 0.09 count pixel-1 in the 0.5–2.0 keV band with the standard ASCA grades (Paper XIII). All data were corrected for the radiation damage the CCDs have suffered and all X-ray spectral analysis was performed using the response matrices appropriate for such corrected data (Townsley et al., 2000, 2002). The fluxes have also been corrected for the molecular contamination of the ACIS optical blocking filters.111See http://cxc.harvard.edu/cal/Acis/Cal_prods/qeDeg/ for more information on the ACIS quantum efficiency degration.
All of the X-ray sources were taken from Paper XIII. The X-ray bands considered are the 0.5–8.0 keV (full), 0.5–2.0 keV (soft), and 2–8 keV (hard) bands. The sources of Paper XIII were detected above a wavdetect (Freeman et al., 2002) significance threshold of (see §2.3). For sources that were not detected in a given band, upper limits are quoted at the % confidence level. We have not corrected the X-ray fluxes for Galactic absorption; this effect is small due to the low Galactic column density (see §1) along the line of sight. We have deviated slightly from the methods of Paper XIII in calculating X-ray fluxes as the average OBXF X-ray spectrum implies a power-law spectral shape (see §5.1) rather than the that is representative of the X-ray background (e.g., Miyaji et al., 1998). In the cases where there are insufficient counts to constrain an OBXF source’s X-ray spectral shape, we have thus assumed instead of (adopted in Paper XIII). The 90% positional accuracy for the X-ray sources is –10.
2.2 Optical and Near-Infrared Photometric Data
The optical and near-infrared photometric data used in this paper were drawn from several databases. For sources within the 9090 Hawaii Flanking Fields region, we use the deep , , and catalog of Barger et al. (1999). We have converted to using the relation of Barger et al. (1999).
For the 17 X-ray sources that are outside the coverage area of Barger et al. (1999), we have made use of deep optical and -band images taken with the Canada-France-Hawaii Telescope UH8K camera (G. Wilson et al., in preparation). We used the sextractor algorithm of Bertin & Arnouts (1996) with the “Best” magnitude criteria, a detection threshold, and a 25-pixel Gaussian wavelet to measure magnitudes in the UH8K images. The resulting sources were matched to the catalog of Barger et al. (1999) as a consistency check and were found to agree within deviations of mag. The 3 detection limits for these images are and .
We have adopted the band for sample definition and comparison with other deep X-ray studies (e.g., Schmidt et al., 1998; Lehmann et al., 2001). Where direct -band measurements are not available, we convert between , , and using the relation from Paper II:
| (1) |
For objects within the HDF-N and HST Flanking Fields, we have also used the HST WFPC2 data in the f814w filter (e.g., Williams et al., 1996).
2.3 Source Significance for the OBXF Sample and the Parent Sample
The effective significance of each OBXF X-ray detection is actually higher than the wavdetect significance indicates because we match X-ray sources to optically bright () counterparts, which are relatively rare on the sky (for additional discussion, see §5.1 of Richards et al., 1998, and Paper XIII). This allows us to adopt a matching radius slightly larger than the 03–10 positional accuracy of the sources. The reason for adopting a slightly larger matching radius is to search for possible off-nuclear X-ray sources (these sources are fairly common locally and one has already been found in the the CDF-N survey Hornschemeier et al., 2000, hereafter Paper I).
As an example, at (the optically faint end of the population under study here) there are 13,000 optically-selected galaxies (Steidel & Hamilton, 1993). Given a conservative X-ray/optical matching radius of 20, the probability that any individual X-ray/optical match is false is . The effective significance threshold for a source detected with a wavdetect significance of is thus really . We conservatively estimate false X-ray detections in total over the pixels in the HEA. For a more typical optical magnitude of (the median magnitude for the OBXF sample), the corresponding effective significance threshold is
We have additionally evaluated the probability of false matches following a method similar to that of Paper XIII. We shifted the positions of the X-ray sources by 50 in both right ascension and declination (in four different directions) and evaluated the number of X-ray/optical matches. We found that with a matching radius of 10, we expect only one false match at . With a matching radius of 20, this rises to four possible false matches, and at 40, we find that there should be false matches. We thus adopt 20 as our matching radius, but visually inspect all sources with offsets larger than 10 to verify a likely association with a host galaxy. We have excluded three sources with 1–2″ offsets because the X-ray source’s position falls outside the apparent optical extent of the galaxy.
All X-ray sources having an optical counterpart within 20 are considered as possible matches, but we visually inspect all objects with 10 offsets to verify a likely association with a host galaxy. We have excluded three sources with 1–2″ offsets because the X-ray source’s position falls outside the apparent optical extent of the galaxy.
There are a total of 293 soft-band sources detected above erg cm-2 s-1(0.5–2 keV) within the HEA (Paper XIII). In constructing a parent sample for comparison, we must also match to sources that are more optically faint than the OBXF sample. We adopt the same 20 matching radius for all sources with . Following Paper XIII, for sources with we adopt a 15 matching radius. For sources with , we use a 10 matching radius or the positional error (whichever is larger). Finally, for sources with , we give an upper limit () as sources at these optically faint magnitudes are not relevant to the current study. For information on the optical properties of these optically faint sources, consult A. Barger et al., in preparation.
Note that we do not use the supplementary catalog of Paper XIII which includes an optically bright, lower X-ray significance sample as the corresponding lower significance parent population contains too many false counterparts for reliable comparison.
3 Sample Definition
3.1 General Definition
Using the photometry in §2.2, we define OBXF sources to be those with , where is the X-ray flux in the soft band and is calculated as follows:
| (2) |
The soft band was chosen for this definition to maximize sensitivity and because the X-ray emission from quiescent galaxies is typically soft. For instance, spiral galaxies, generally dominated by the emission from X-ray binaries, have spectra reasonably well-approximated by a power law (e.g., Fabbiano, 1995). The emission temperatures of the hot interstellar media of ellipticals are also generally low, typically in the range –2 keV (e.g., Fabbiano, 1995; Irwin, 1997).
However, to minimize contamination from hard X-ray emitting AGN we have added the additional requirement that the sources either have in the full band or a hardness ratio constraint placing it softer than . We note that using the full band corresponds to using the soft band if one assumes a power law. With such a small number of photons, one cannot completely exclude the possibility of an obscured AGN but the current approach is fairly conservative. There are 15 sources with in the soft band which fail this X-ray hardness filter.
All of the sources are detected in the soft band. We thus focus on the soft-band properties of the OBXF sources as this is the band in which they are both selected and individually detected.
We have performed additional visual inspection of objects with optical counterparts separated from the X-ray source by –, taking care to admit only fairly optically bright galaxies as we might expect a large number of false matches (see § 2.3).
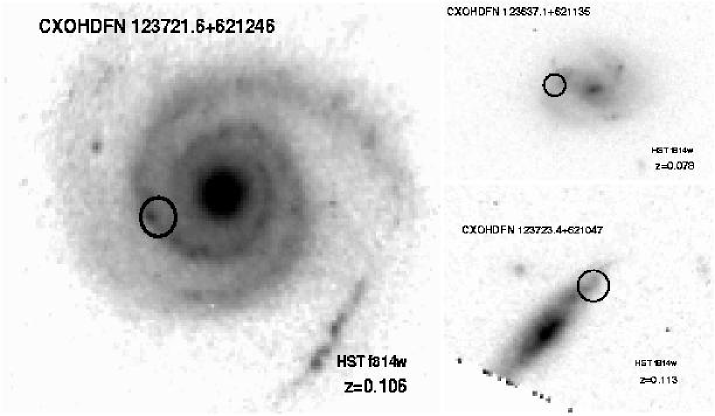
We have been fairly conservative, finding that only three additional sources satisfy our visual inspection. These three X-ray sources are all located within spiral/disk galaxy hosts, have optical magnitudes and X-ray/optical offsets 30. (see Figure 2). Had we arbitrarily matched sources having to X-ray sources with a 30 matching radius, we would have expected less than one false match (0.75 false matches).
As an example, we discuss the X-ray source CXOHDFN J123721.6+621246 in more detail. This source is located in a grand-design spiral (see Figure 2), along a spiral arm 23 from the galaxy’s nucleus. There is a slight optical enhancement at the location of the X-ray source that is only apparent in the HST Flanking Field image; we estimate this knot to have –26. The physical separation between the X-ray source/optical knot and the galaxy’s nucleus corresponds to kpc at the galaxy’s redshift (). Although the formal chance that this is a random association is %, but the X-ray source is not randomly located within the galaxy; a chance alignment with an optical knot in the spiral arm is less likely.
3.2 Summary of OBXF Sample Properties
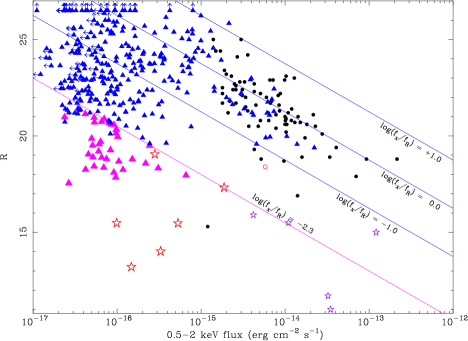
There are 43 OBXF sources with secure X-ray/optical matches listed in Table 1. In Figure 3 we show a plot of -band magnitude versus full-band X-ray flux for both the full 2 Ms X-ray sample and the OBXF sources.
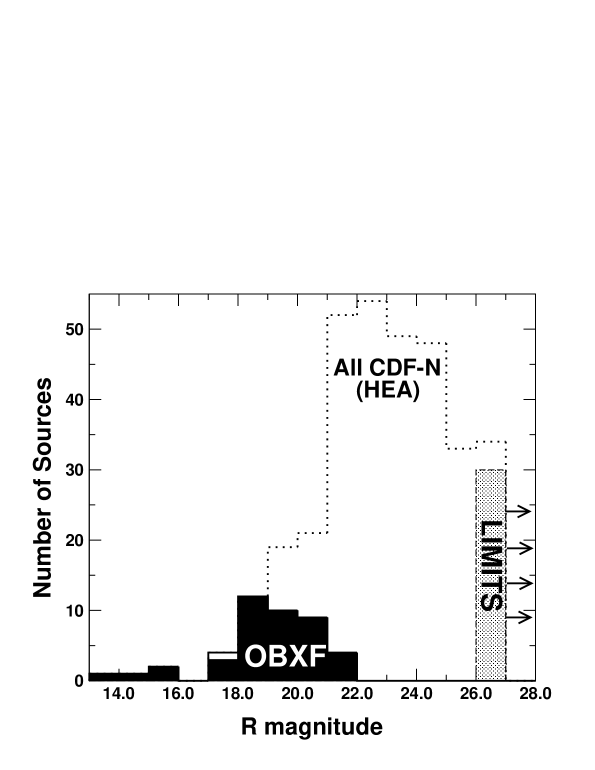
Figure 4 shows the optical magnitude distribution for the OBXF sources and the parent X-ray sample. The median magnitude of the 43 OBXF sources in the HEA is . The OBXF sources comprise the majority of the optically brightest X-ray sources, but they clearly are still a minority of the overall X-ray source population. Figure 4 also shows which OBXF sources have been identified through optical spectroscopy or other means; there is only one unidentified source.
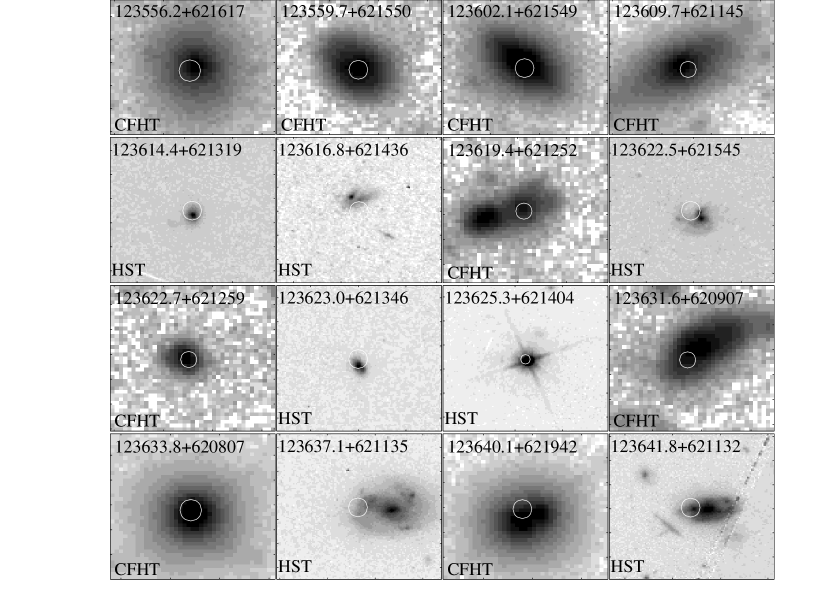
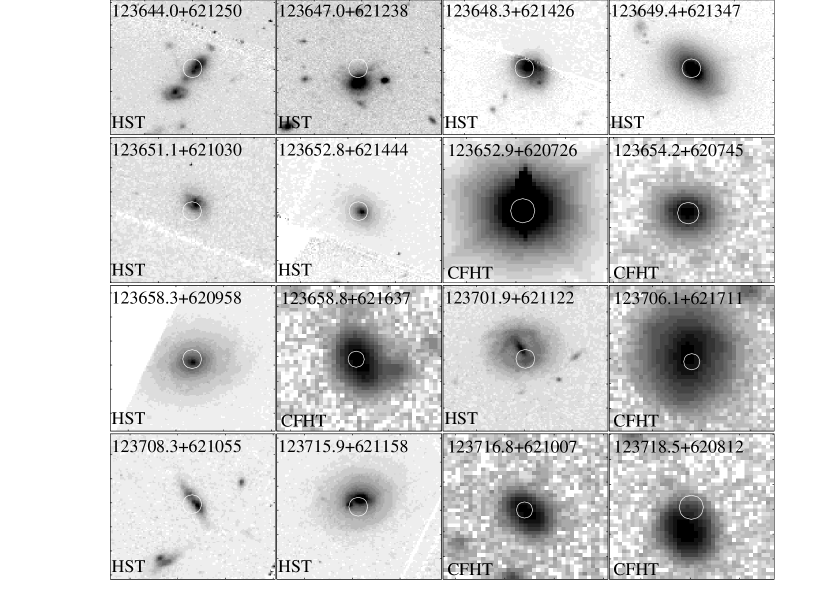
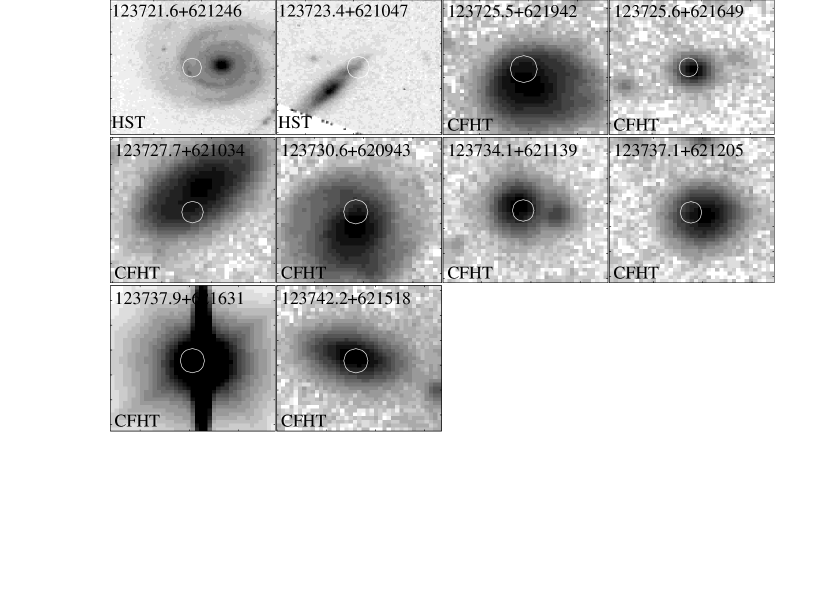
Optical images of the sources are shown in Figure 5. We display the ground-based -band data described in §2.2 except when the object lies in the HDF-N or HST Flanking Fields. In these cases, we display HST imaging data from the f814w filter, which is most closely matched to the band. The f814w data are chosen as they cover both the HDF-N and the Hubble Flanking Fields.
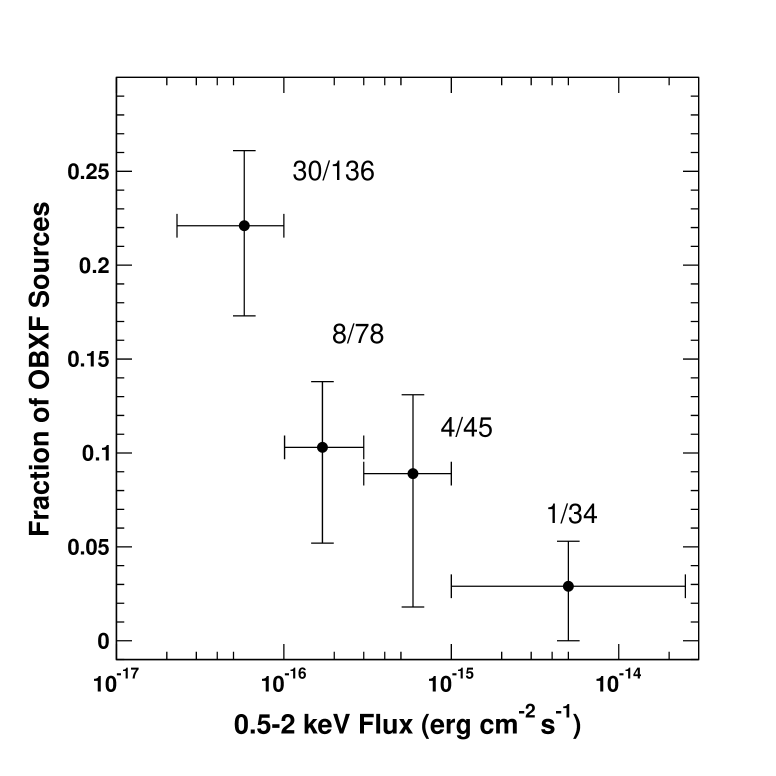
Figure 6 shows the fraction of X-ray sources that are OBXF as a function of X-ray flux. This fraction increases at fainter X-ray fluxes, in contrast to the optically faint () population which is found to remain constant at % of X-ray sources (Alexander et al., 2001, hereafter Paper VI). There are few OBXF sources in the sample at intermediate X-ray fluxes ( erg cm-2 s-1, 0.5–2.0 keV), so the fraction there is less well-constrained. However, the fraction of OBXF sources at intermediate fluxes is roughly consistent with wider-field Chandra surveys (e.g., % of Chandra Multi-Wavelength Project (ChaMP) sources; Green et al., 2003). Note that the 2 Ms data double the number of detected OBXF sources over the 1 Ms data.
4 Optical Properties of the OBXF Sample
4.1 Optical Spectroscopic Observations and Archival Redshifts
Redshifts and/or identifications have been obtained for 42 (98%) of the 43 OBXF sources using both the optical spectroscopy presented in this paper and published spectroscopic redshifts. There is only one object in our sample which is spectroscopically unidentified, CXOHDFN J123727.7+621034 (). This source appears to reside in an optically resolved galaxy. There are 25 optical spectra presented here; we collected 22, and three were obtained from archival resources. Of the 22 optical spectra we obtained, 15 are from the Hobby-Eberly Telescope (HET), three are from Kitt Peak, and four are from Keck. Here we briefly describe the optical spectra and archival redshift sources.
The Keck Low Resolution Imaging Spectrograph (LRIS; Oke et al., 1995) was used to observe OBXF sources during 2001 March. The integration times were typically one to two hours. The blue side of LRIS was in operation at this time; some of these spectra extend down to Å with an occasional gap in spectroscopic coverage at 5600 Å. Where possible, we have normalized the blue spectrum to match the flux of the red spectrum in the region of overlap. Three of the Keck LRIS observations were obtained in multi-slit mode and one (CXOHDFN J123641.8+621132) was obtained in long-slit mode. We obtained a long-slit spectrum of CXOHDFN J123641.8+621132. The latter’s X-ray emission is offset from the host galaxy nucleus and is coincident with an ultraviolet-bright knot. We placed the slit on this knot to determine if it is a background AGN and verified that the knot also lies at the redshift determined for this galaxy by Cohen et al. (2000).
Spectra were also obtained using the Marcario Low Resolution Spectrograph (LRS; Hill et al., 1998a, b; Schneider et al., 2000) of the HET (Ramsey et al., 1998). The HET operates in a queue-scheduled mode, so the observations occurred on multiple evenings between 2000 February 7 and 2001 June 2. A 20 slit and a 300 line mm-1 grism/GG385 blocking filter produced spectra from 4400–9000 Å at 17 Å resolution; data redward of 7700 Å are suspect because of possible second-order contamination. The exposure time per source ranged from 5–60 minutes. The seeing was typically 25 (FWHM). Wavelength calibration was performed using HgCdZn and Ne lamps, and relative flux calibration was performed using spectrophotometric standards.
The other spectra were obtained during multi-slit observations with the R.C. Spectrograph on the Mayall 4 m telescope at Kitt Peak the nights of 2002 May 15 and May 16. We used the BL400 158 line mm-1 grating and the OG530 blocking filter to produce spectra from 5300–10000 Å at 14.5 Å resolution. Wavelength calibration was performed using HeNeAr lamps, and relative flux calibration was performed using spectrophotometric standards.
Two Keck LRIS spectra are included from the publicly available database of Barger et al. (1999)222http://www.ifa.hawaii.edu/cowie/hdflank/hdflank.html. Two spectra from the publicly available Deep Extragalactic Evolutionary Probe (DEEP, e.g., Koo, 2001) database of Keck spectra are also included.333Both the LRIS and ESI instruments were used. See http://saci.ucolick.org/verdi/doc/spectra.html The band pass for these Keck LRIS observations is –10000 Å.
4.2 Redshifts and Classifications from Optical Spectra
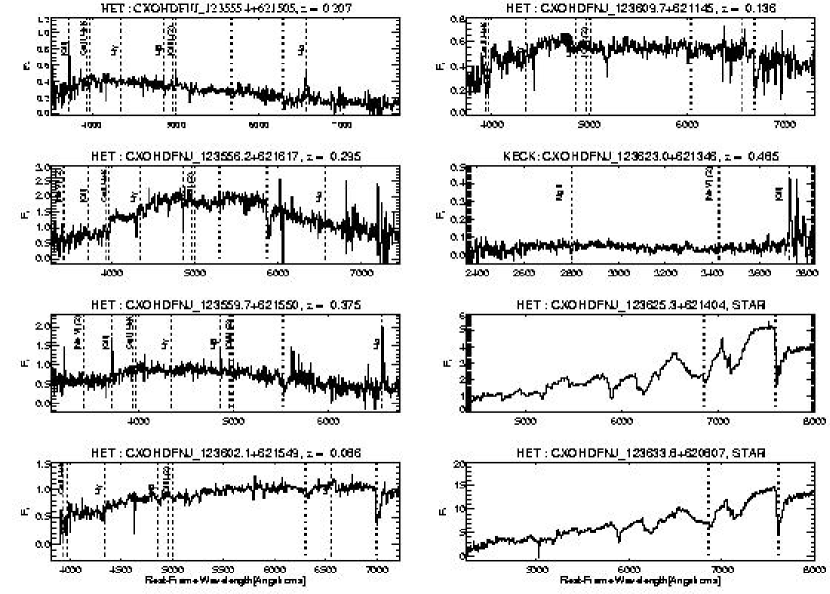
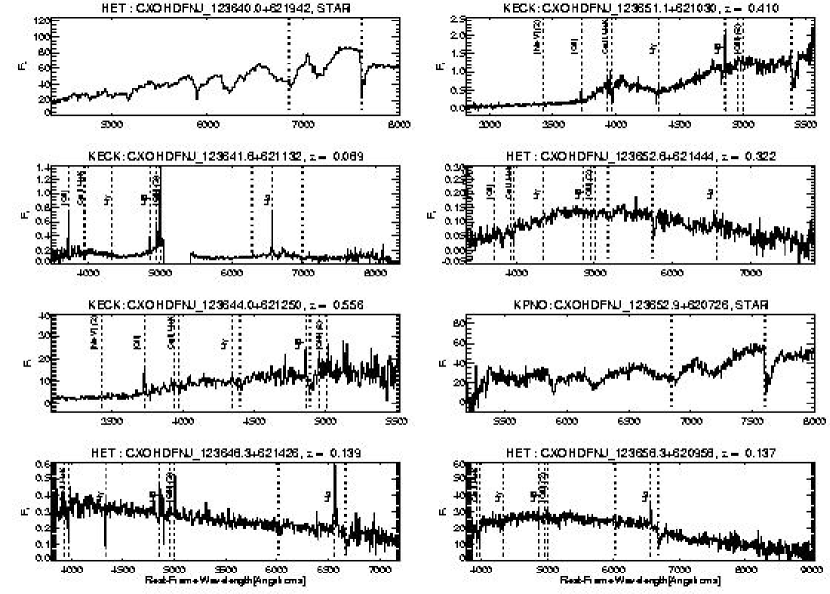
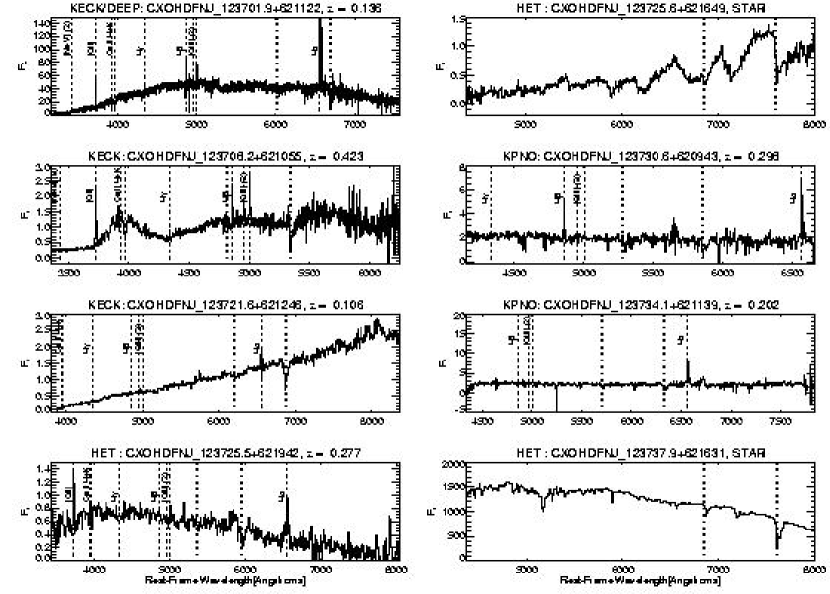
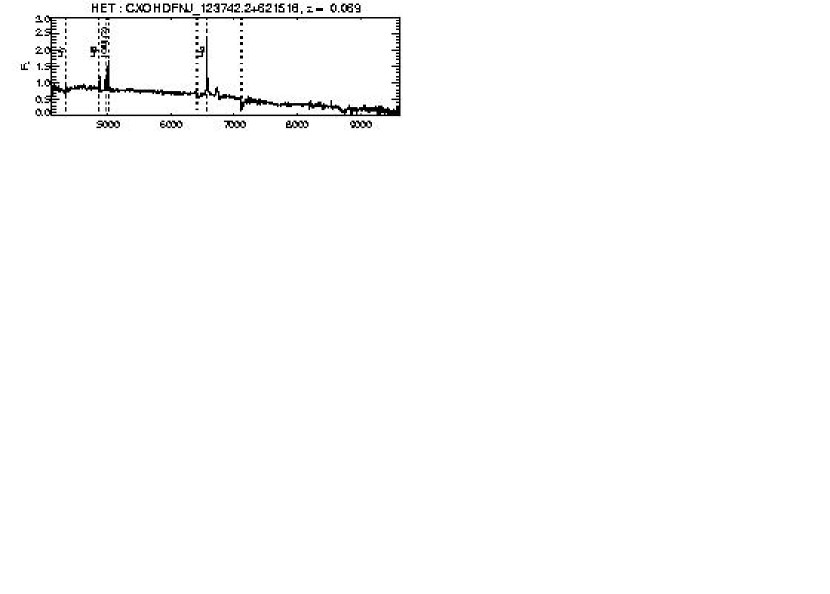
The optical matches and identifications for the OBXF sample are given in Table 2. In Figure 7 we show the 26 optical spectra of OBXF sources (see §4.1). A total of five previously unpublished redshifts are presented; all of these lie outside of the HDF-N and HST Flanking Fields. All the spectra are plotted in terms of rest-frame wavelength.
Only broad spectral classifications of the sources are made due to the low signal-to-noise of some of the spectra. For the 16 objects for which we did not have a spectrum, we relied on the spectral classifications of Cohen et al. (2000) or classified the optical spectra of either Barger et al. (2002) or A. Barger et al., in preparation. Our classifications, similar to those of Cohen et al. (2000), are “absorption-line dominated” (), “composite” (), “emission-line dominated” (),444 Objects of Cohen et al. (2000) type “intermediate”, “intermediate/emission-dominated”, and “emission-dominated/intermediate” were classified as here. and “stellar” (). Objects of composite type exhibit a strong [O ii] emission line as well as the Balmer series in absorption. In a few cases we have obtained spectra of objects classified as “intermediate” by Cohen et al. (2000) and determined that they were of type . Only objects of Cohen et al. (2000) class were placed into our absorption-dominated class. We cast all stars ( and of Cohen et al., 2000) into class .
Through our optical spectroscopic identifications, we find that 9 sources are absorption-line dominated (21% of identified sources), three sources are composite (7%), 24 sources are emission-line dominated (57%), and six sources are stars (14%).
The emission-line dominated sources are a diverse group, with some exhibiting emission only in [O ii] and others showing clear emission in both [O iii] and H. Among the emission-line dominated galaxies where we have optical spectra, we find that a significant fraction have strong [O iii] and H emission, with the rest exhibit [O ii] and in some cases Ca H and K absorption. In a few very low redshift cases, H is also seen.
There are six objects identified as stars. Six of these are mid-to-late type stars (M4-5), and one is an F star (CXOHDFN J123737.9+621631).
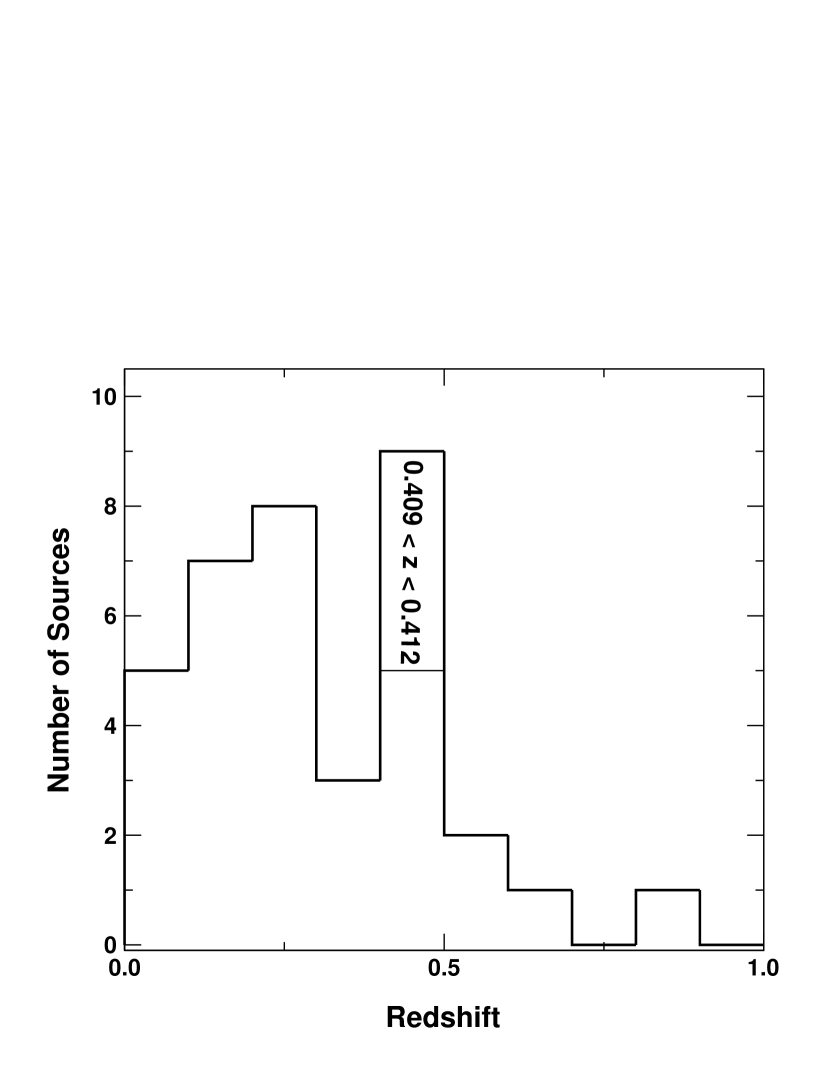
The redshift distribution of the identified extragalactic sample (38 sources) is shown in Figure 8. Of these 38 sources, % have , % have , and the median redshift is . Note that there is a possible “peak” in the number of galaxies in the redshift interval (see the similar findings in Barger et al., 2002). Four of the nine galaxies in this interval are in a very narrow redshift range, , which corresponds to the redshift range for one of the previously determined overdensities of optically-selected galaxies (Cohen et al., 2000).
4.3 Optical Colors
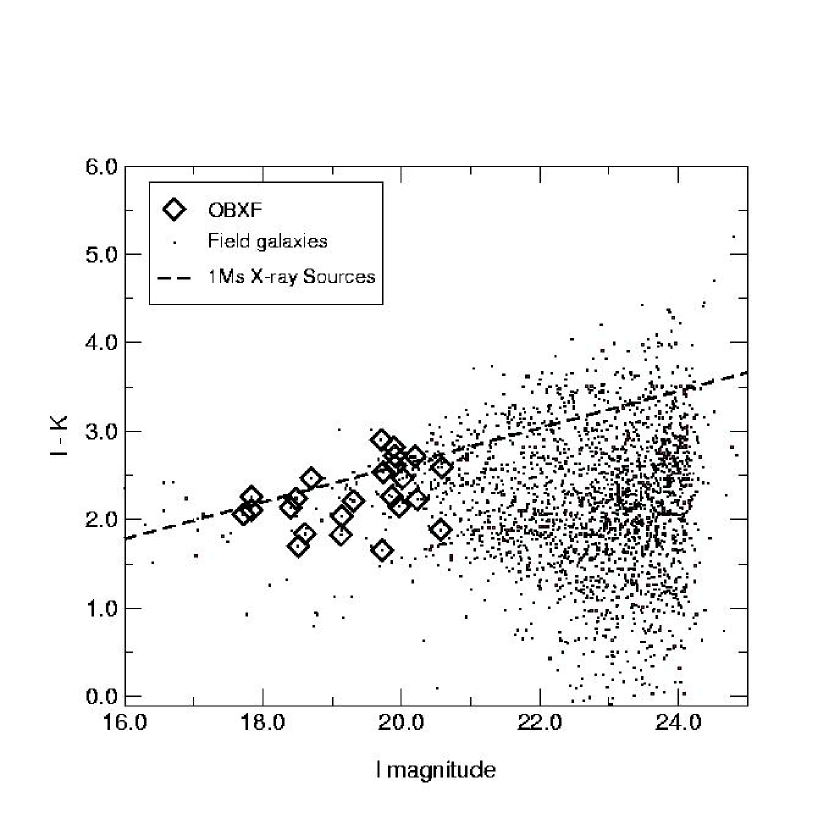
colors of the 24 OBXF sources that lie within the deep multi-band imaging region of the Hawaii Flanking Fields (Barger et al., 1999) are shown in Figure 9. Figure 9 also shows the color distribution of the field galaxy population (Barger et al., 1999).
There is a trend in optical/near-infrared colors for X-ray sources found in deep surveys (excluding broad-line AGN; e.g., Paper II; Hasinger et al., 1998; Lehmann et al., 2001; Giacconi et al., 2001, Paper VI). The optical counterparts to X-ray sources have among the reddest optical/near-infrared colors within the optically selected source population at a given optical magnitude. The OBXF population is distributed more uniformly with respect to colors and -band magnitude (see Figure 9). These “bluer” red/infrared colors of the OBXF population are more consistent with the field galaxy population.
We compare the OBXF optical colors to the work of Koekemoer et al. (2002), who have performed an HST imaging study of the Chandra Deep Field-South (hereafter CDF-S; e.g., Giacconi et al., 2002). This study included three HST WFPC2 fields and contained analysis of 40 X-ray sources, regardless of optical brightness/faintness. Koekemoer et al. (2002) made the broad statement that the optically bright population has redder colors than the field galaxy population; this conclusion was based on (approximately ) colors. However, they note the presence of a bright class having “intermediate” colors which are generally associated with optically resolved galaxies. These intermediate sources have colors consistent with the OBXF sample.
4.4 Host Galaxy Morphology
To address the issue of host galaxy morphology, we consider the HST imaging data for the 18 OBXF galaxies within the HDF-N and HST Flanking Fields (see Table 3).
The morphological classification follows the quantitative measuring technique of Conselice, Bershady, & Jangren (2000) and Bershady, Jangren, & Conselice (2000). This system is not based on the Hubble sequence, although we do discuss the morphological parameters in the context of the Hubble sequence. The strength of this quantitative morphological analysis is that it is robust for both distant and nearby galaxies. The morphological parameters are measured on images taken in a given optical filter; for example we write the asymmetry index as “” because the morphology is measured in the f814w band, which is closely matched to the -band.
The asymmetry index, , reveals the distribution of light and gives some indication of the possible distribution of the matter in the galaxy. This index is calculated by rotating the galaxy image () through different values of the angle, , and measuring the residuals after subtracting the original image. The parameter is normalized such that when , the galaxy is symmetric to all rotations (), and when the galaxy is completely asymmetric so that at a given , . The asymmetry index reveals the dynamical processes in galaxies, measuring the degree of recent interactions/mergers.
The concentration index () effectively measures the radial distribution of light and may give some indication of how a galaxy was assembled as well as its scale. If the number is high (such as in an elliptical, ) then it is thought that the galaxy was produced through dissipationless mergers. Low concentrations are usually found in disk-dominated systems that have high angular momenta and thus do not have as concentrated light.
Table 3 lists and for all of the OBXF galaxies in the HDF-N and HST Flanking Fields. We also include some notes on individual sources, including visual assessments of the host galaxy morphology. Note that all of the galaxies identified as early-type/ellipticals by eye are in a transition stage, having slightly higher than average asymmetry. Comparison with the more traditional Hubble types (broadly divided into late-type, intermediate, and early-type galaxies) is made using the the calibration of Bershady et al. (2000) for this algorithm on nearby well-resolved galaxies.
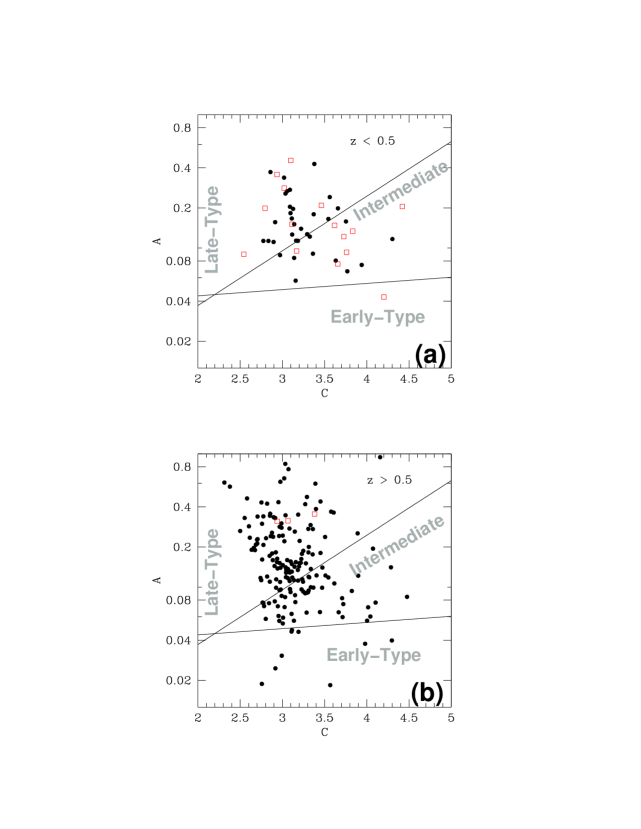
We divide the OBXF galaxies into two redshift intervals ( and ) in order to compare the objects with HDF-N field galaxies measured using the same Conselice et al. (2000) algorithm (where HDF-N spectroscopic redshifts were not available, we used the photometric redshifts of Budavári et al., 2000). We compared the OBXF galaxies with reasonably optically luminous galaxies; we only calculate the morphological parameters for field galaxies with . The values of the measured parameters are plotted in Figure 10. There are some qualitative differences in the OBXF host galaxy morphologies as compared to the field population; at lower redshifts the OBXF galaxies are of later type than at higher redshifts. Also, there are no OBXF galaxies of classical early-type.
We find that the concentration indices are virtually identical for the OBXF and field samples (–3.5). There is an indication that the OBXF sources at may be slightly more asymmetric than the field galaxies: for the field galaxies and for the OBXF galaxies but the scatter in the OBXF values ( scatter in is at ) is fairly large so they are statistically consistent.
Due to the likely connection between X-ray emission and vigorous star-formation resulting from mergers, it is expected that one might find more instances of mergers/interactions among the OBXF sources than the field galaxy population. Using as a merger limit (Conselice et al., 2000) it appears that three (%) of the OBXF sources are undergoing or recently underwent a merger. This is slightly higher than the value of 10% found for field galaxies over the same redshift interval. To compare these fractions, we perform a Fisher exact probability test for two independent samples (one is the sample of 208 optically selected galaxies, the other is the sample of 18 X-ray selected OBXF galaxies; e.g., Siegel, 1988). We find that the probability that X-ray selection and optical selection of galaxy mergers is different is %. The statistical level of the difference is thus marginal, although it does leave open the possibility that deep X-ray surveys preferentially select galaxies undergoing mergers as compared to the general field galaxy population.
Since has excellent spatial resolution, one might also consider the X-ray morphology of the galaxies. This is difficult in most of the cases due to the low number of X-ray counts; only one of the OBXF sources has any hint of X-ray extent. This one source is near the aimpoint of the observations. We thus suspect that this apparent extent could be due to the very complicated CDF-N coadded PSF.
We can compare our findings with those of the CDF-S. In Table 4 of Koekemoer et al. (2002) there are ten elliptical galaxies, but nine of these ten galaxies have higher X-ray-to-optical flux ratios than are being considered here. The tenth object would have been marginally within our selection criterion. The lack of elliptical galaxies in the current sample thus appears consistent with findings in the CDF-S.
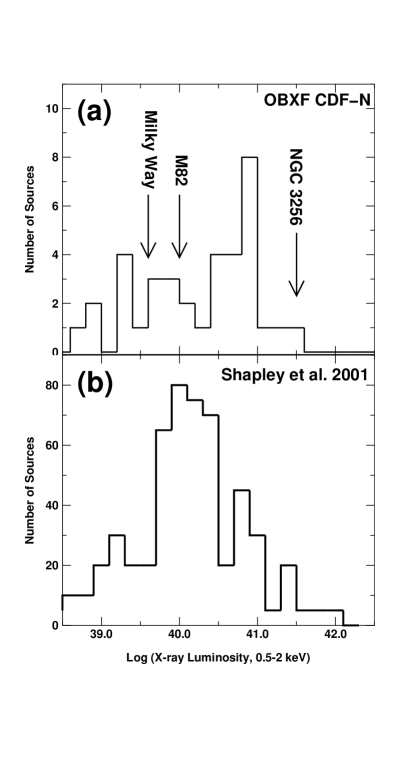
5 X-ray Properties of the OBXF Population
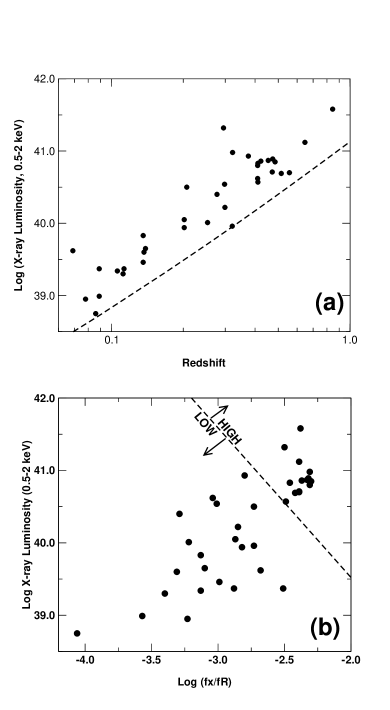
Figure 11 compares the X-ray luminosity distribution of the OBXF sample with a sample of normal late-type galaxies detected in the local Universe by Einstein (Shapley et al. 2001). Also plotted in Figure 11 are the X-ray luminosities of the Milky Way ( erg s-1, 0.5–2 keV, Warwick, 2002), the local starburst M82 (Griffiths et al., 2000), and the infrared-luminous starburst NGC 3256 (the most X-ray-luminous nearby starburst known; Moran et al., 1999; Lira et al., 2002). There are clearly a large number of sources in the OBXF sample with X-ray luminosities higher than those of normal late-type galaxies. Figure 12a shows that the luminosities, not unexpectedly, are a strong function of redshift. The expected luminosity sensitivity near the Chandra aimpoint is also plotted in Figure 12a, and we see that even with 2 Ms of exposure, Chandra can only detect galaxies with the low X-ray luminosities comparable to the Shapley et al. sample ( erg s-1) at . At higher redshifts, it appears that the galaxies being probed are luminous starbursts and moderately luminous AGN. Figure 12b shows that the lower luminosity, nearby objects also have lower X-ray-to-optical flux ratios and that we are sampling a much greater spread of low X-ray-to-optical flux ratios. We make a division between the “high group” and the “low group” to determine the X-ray properties of the sample. The high group consists of 14 galaxies having and . The low group consists of 22 galaxies having and . These two groups are marked in Figure 12b.
5.1 Stacked X-ray Spectrum of Normal Galaxies
The small number of X-ray counts per OBXF source (the median number of full-band counts is 35.4) prohibits extensive X-ray spectral analysis on a source-by-source basis. There are only five sources detected in the hard band and of these, only three have band ratios which imply fairly hard X-ray spectra. These sources are described in detail in the appendix; they appear to have just narrowly passed our selection criteria as OBXF sources. They are more typical of starbursts and/or lower-luminosity AGN.
We have stacked the X-ray counts from each of the OBXF galaxies to make a combined spectrum to constrain further their X-ray spectral nature and their contribution to the X-ray background. The average response matrix and ancillary response file (arf) are calculated as described in §2.1. We include the 36 galaxies for which we have redshifts and/or spectroscopic identifications. We have excluded data above 5 keV because of insufficient counts. The extraction regions are circles of radius 4 pixels.
Figure 13 shows the composite 0.5–5.0 keV spectrum for these 36 OBXF sources. The 0.5–5.0 keV spectrum contains a total of 1526 counts; 447 (29%) of these are expected to be from the background. The power-law photon index of this spectrum, assuming the Galactic column density, is (95% confidence errors, reduced ,). The integrated 0.5–2.0 keV flux of the OBXF galaxies is erg cm-2 s-1. This is % of the 0.5–2 keV cosmic X-ray background (XRB) assuming a spectral form for the XRB of keV keV-1 cm-2 s-1 sr-1 (see Vecchi et al. 1999 for a discussion of recent efforts to measure the intensity of the XRB).
We have split the OBXF sources into optical spectral classes and considered their X-ray spectral properties. Both the and galaxies are reasonably well fit by a power-law, which is reasonably consistent with what has been found for local galaxies (e.g., Fabbiano, 1995). We have also considered the high group and low group as defined earlier in this section. The stacked X-ray spectrum of the low group may be described by a power-law with (95% confidence errors, reduced ,). For the high group, the X-ray spectrum is not well-fit by any simple model; the best fit obtained was for (,). This agrees reasonably well with the spectrum obtained previously from stacking a smaller sample of X-ray detected infrared-luminous galaxies (11 galaxies; §3.4 of Paper XI).
The OBXF galaxies do not divide themselves simply by X-ray spectral properties, but this is not so unexpected as they vary quite a bit even within these subgroups in terms of properties such as morphology and luminosity. The overall soft nature does suggest there are very few obscured AGN within the population.
5.2 X-ray Number Counts
We have compared the number counts of the extragalactic OBXF population with those of the full CDF-N X-ray source population (see Figure 14). The low X-ray fluxes of the OBXF population lead to a fairly narrow range of X-ray flux over which number counts may be reliably well-measured. The sensitivity maps derived for Paper XIII were used to determine the area over which we are sensitive to sources of a given flux. We have excluded all sources having soft-band fluxes less than erg cm-2 s-1 due to incompleteness below these detection levels. There are insufficient numbers of sources above erg cm-2 s-1 to constrain the number counts, so this is adopted as an upper bound. There are 29 OBXF sources between these flux levels.
A maximum likelihood fit, assuming a power law (e.g., Murdoch et al., 1973), was made to the soft-band differential number counts from erg cm-2 s-1 to erg cm-2 s-1. The fit yielded a slope of (90% confidence) for the corresponding cumulative number counts. The number counts are described by the following equation ( is the number of sources per square degree).
| (3) |
By comparison, the slope for the general soft-band detected X-ray source population is quite flat over the same flux range at (Paper V).
Indirect measures of galaxy number counts, which have been able to probe galaxies statistically beyond the formal 1 Ms detection limit, have included the stacking analysis work of Paper VIII, which focused on quiescent spiral galaxies, and the fluctuation analysis work of, e.g., Miyaji & Griffiths (2002). In Figure 14 we show these results; an extrapolation of the OBXF normal galaxy counts should intercept the Miyaji fluctuation analysis “fish” at a 0.5–2 keV flux of erg cm-2 s-1. This is a coarse estimate of the flux where the X-ray number counts will be dominated by normal galaxies and is in reasonable agreement with the estimates of Ptak et al. (2001) based on the optical properties of field galaxies (also shown in Figure 14) and of Paper VIII.
6 Discussion
6.1 Truly “Normal” Galaxies?
It is only by extending the CDF-N survey to 2 Ms and covering an area larger than the HDF-N and its immediate environs that we have obtained a sizeable sample of fairly normal galaxies. In this section we revisit the question of just how “normal” the galaxies are that are appearing in deep Chandra surveys, in particular to establish that they are consistent with X-ray emission from normal galaxies rather than highly obscured AGN. It is thus important to point out that the galaxies presented here are completely different in nature from the “optically dull”, X-ray luminous galaxies found in the HELLAS survey (e.g., Fiore et al., 2000). Comastri et al. (2002) makes the good suggestion to refer to these X-ray luminous galaxies as XBONGS (X-ray Bright, Optically Normal Galaxies) to make the distinction clear. In this paper “normal” refers to the X-ray and optical emission from the galaxy, normal can be equated in a very coarse sense with “Milky Way-type” galaxies.
We find that even with the fairly conservative X-ray-to-optical flux ratio cutoff imposed here, a significant fraction of sources have X-ray luminosities of erg s-1 (see Figure 11) rather than the – erg s-1 that is more typical of normal galaxies in the local Universe (e.g., Shapley et al., 2001). Figure 12a shows that this is basically a sensitivity effect as we are only able to detect normal galaxies to even with 2 Ms of Chandra exposure. This is consistent with the findings of Paper XI that starburst galaxies dominate over normal (less X-ray luminous) galaxies even with 1 Ms of exposure.
We find that even at the faint X-ray flux limits of a 2 Ms Chandra survey, the X-ray-to-optical flux ratio is a useful discriminator of galaxies versus AGN (similar to the findings of Paper XI and earlier results at much brighter X-ray fluxes, e.g., Maccacaro et al., 1988; Stocke et al., 1991). Consider the relationship between X-ray luminosity and in Figure 12b. There are no extremely X-ray luminous OBXF sources.
Overall, % of X-ray sources in 2 Ms surveys are “normal” galaxies. Table 4 gives a breakdown of the source types by full band X-ray-to-optical flux ratio. Also included in Table 4 is the breakdown for sources with slightly higher values of X-ray-to-optical flux ratio [; Paper XI], we have extrapolated these 1 Ms identifications to the 2 Ms sample. We find that while AGN certainly do dominate as far as numbers of sources in deep (1–2 Ms) surveys, 10–30% of the sources may be explained through high-energy emission processes other than accretion onto supermassive black holes. The range in values is due to the unknown prevalence of lower-luminosity AGN in these sources.
One can ask the reciprocal question concerning what fraction of “normal” galaxies are being detected in 2 Ms X-ray surveys. In the CDF-N, we expect to be able to detect galaxies having erg s-1 to and to detect galaxies having erg s-1 to . We have considered galaxies within the 86 87 Caltech Faint Field Galaxy Redshift Survey Area (hereafter the Caltech Area) because its redshift coverage is highly complete (Cohen et al., 2000) and because there are -band luminosity calculations available for this region (Cohen, 2001). We detect all six of the galaxies with and in the Cohen et al. (2000) sample as OBXF sources.555 corresponds to ; we have used the equations of Cohen (2001) to calculate and the Sloan Digital Sky Survey value for (Blanton et al., 2001). This number of low-redshift detections is consistent with that found over the rest of the HEA. We detect few of the galaxies in the Caltech Area having and ; constraints from the rest of the HEA OBXF sample (i.e., outside the Caltech Area) indicate that % of galaxies with are detected.
We thus have the sensitivity to detect all optically luminous galaxies (non-dwarfs) out to and some (%) out to . This is roughly consistent with the early findings in Brandt et al. (2001; hereafter Paper IV); the current study has much better statistics on the fraction of optically normal galaxies detected.
6.2 Off-nuclear Sources
Five of the OBXF sources are candidate off-nuclear X-ray sources and are listed in Table 5. All of these objects have full-band X-ray luminosities erg s-1, indicating they are members of the off-nuclear ultraluminous X-ray (ULX) population that was discovered during the Einstein era (e.g., Fabbiano, 1989). Their X-ray luminosities typically exceed that expected for spherically symmetric Eddington-limited accretion onto “stellar” mass (5–20 ) black holes666The Eddington-limited luminosity for a 15 black hole, assuming spherically symmetric accretion, is erg s-1. All but one of the sources presented here exceed this luminosity.. They are thus “ultraluminous” as compared to other sub-galactic X-ray emitters but are of course very low luminosity compared to luminous cosmic X-ray emitters (AGN). At , the high angular resolution of Chandra is vital in order to establish that the sources are indeed off-nuclear. Complementary sub-arcsecond observations with HST are also needed to verify association with bright HII regions or spiral structure within the host galaxy. Thus, the 2 Ms CDF-N data present a unique opportunity to study these objects up to look-back times of –2 gigayears.
ULX sources may still be consistent with stellar mass black holes, possibly representing an unstable phase in normal high-mass X-ray binary evolution (e.g., King et al., 2001) or possibly a population of rapidly spinning Kerr black holes allowing higher X-ray luminosities (e.g., Makishima et al., 2000). They also possibly represent a class of intermediate mass black holes (–1000 , e.g., Colbert & Ptak, 2002) or ultraluminous supernova remnants (e.g., Blair et al., 2001). While Chandra and XMM-Newton have recently been able to study these sources in much greater numbers in nearby galaxies (e.g., Roberts et al., 2002) and ROSAT observations of samples of nearby bright galaxies are producing large numbers of candidates(Colbert & Ptak, 2002), there is still fairly little information about how common these sources are throughout the Universe.
Two of the CDF-N OBXF ULX sources are consistent with bright HII regions displaced from the nuclei of the host galaxies (grand-design spiral CXOHDFN J123721.6+621246; mentioned in §3.1 and the previously published off-nuclear ULX CXOHDFN J123641.8+621132, located in the HDF-N itself; Paper I). These two sources are described as “highly confident” candidates in Table 5 due to their likely association with structures within their host galaxies. We have identified three additional candidate off-nuclear X-ray sources which are also listed in Table 5.
The two most confident ULX candidates show strong signs of variability and several of the other candidates show evidence for variability. This variability, along with the high X-ray luminosities, indicates that these sources are black hole candidates. For more detailed information on variability in ULX sources at these redshifts, see A.E. Hornschemeier et al., in preparation.
Among the ten OBXF galaxies at in the CDF-N with HST imaging, we find that % are likely off-nuclear black hole candidates, exhibiting both variability and association with optically bright knots along spiral arms. We find another three sources within this group that have properties consistent with ULX sources. Since we have detected all galaxies of at least moderate optical luminosity (see §6.1), this gives some indication of the total fraction of normal galaxies harboring ULX sources at –0.2. This ULX fraction is consistent with that measured in the local Universe (Colbert & Ptak, 2002). The ULX fraction measured here is only a lower limit; even Chandra’s sub-arcsecond spatial resolution cannot resolve sources within the central –2 kpc of the nucleus (offsets of kpc are not expected if the object is a supermassive black hole, see discussion in Colbert & Ptak, 2002).
7 Conclusions and Future Prospects
We have analyzed optically bright, X-ray faint sources arising in an area of high-exposure within the CDF-N 2 Ms survey. The 2 Ms data have doubled the number of detected OBXF sources over the 1 Ms data presented in Paper V and Barger et al. (2002), for the first time providing a sufficiently large sample for detailed study. Here we summarize our main findings.
-
•
We present 25 optical spectra, including five new, previously unpublished redshifts. The OBXF population is found to be fairly diverse, but overall dominated by non-AGN sources. Within the OBXF population we find that roughly 14% are Galactic stars. The remaining 86% of the OBXF population is consistent with the X-ray emission from both quiescent/“normal” galaxies and more X-ray active starbursts and LLAGN. We note that the X-ray emission from galaxies may include lower-level accretion onto supermassive black holes. For instance, the soft X-ray spectral nature of these objects is also consistent with LLAGN (e.g., X-ray measurements of M81’s nucleus and other lower-luminosity AGN in local neighborhood, Petre et al., 1993; Colbert & Mushotzky, 1999).
-
•
We find that the X-ray number counts of normal and starburst galaxies is fairly steep (slope ) down to the CDF-N survey limits, in contrast to the flattening of the number counts for the general X-ray source population.
-
•
Many of the galaxies in the OBXF sample are on average more X-ray luminous than truly “normal” galaxies, indicating that even with 2 Ms, we are still detecting starburst and lower-luminosity AGN in greater numbers than truly quiescent galaxies. We detect most normal galaxies out to and some out to .
-
•
The composite X-ray spectrum of the 36 extragalactic OBXF sources is very soft (). The complete lack of hard X-ray emission from these galaxies supports the picture that they are not a population of highly obscured AGN. We find that the OBXF galaxies contribute % to the soft XRB.
-
•
There are several instances of off-nuclear ULX sources within the OBXF population. Our two most likely candidates exhibit evidence for variability. Both are observed at look-back times of billion years, representing a new epoch of study for these objects.
We note that this work, particularly the search for ULX sources at large look-back times, will be improved greatly in the coming year with the very deep multi-color imaging of the HST Advanced Camera for Surveys (ACS) Great Observatories Origins Deep Survey (GOODS, P.I. Mauro Giavalisco). The ACS GOODS survey has covered nearly all of the high-exposure area (HEA) studied here, providing excellent morphological and other information.
References
- Alexander et al. (2002) Alexander, D. M., Aussel, H., Bauer, F. E., Brandt, W. N., Hornschemeier, A. E., Vignali, C., Garmire, G. P., & Schneider, D. P. 2002, ApJ, 568, L85 (Paper XI)
- Alexander et al. (2003) Alexander, D. M., et al. 2003, AJ, submitted (Paper XIII)
- Alexander et al. (2001) Alexander, D. M., Brandt, W. N., Hornschemeier, A. E., Garmire, G. P., Schneider, D. P., Bauer, F. E., & Griffiths, R. E. 2001, AJ, 122, 2156 (Paper VI)
- Barger et al. (2002) Barger, A. J., Cowie, L. L., Brandt, W. N., Capak, P., Garmire, G. P., Hornschemeier, A. E., Steffen, A. T., & Wehner, E. H. 2002
- Barger et al. (1999) Barger, A. J., Cowie, L. L., Trentham, N., Fulton, E., Hu, E. M., Songaila, A., & Hall, D. 1999, AJ, 117, 102
- Bauer et al. (2002) Bauer, F. E., Alexander, D. M., Brandt, W. N., Hornschemeier, A. E., Vignali, C., Garmire, G. P., & Schneider, D. P. 2002, AJ, 124, 2351 (Paper XII)
- Bershady et al. (2000) Bershady, M. A., Jangren, A., & Conselice, C. J. 2000, AJ, 119, 2645
- Bertin & Arnouts (1996) Bertin, E., & Arnouts, S. 1996, A&AS, 117, 393
- Blair et al. (2001) Blair, W. P., Fesen, R. A., & Schlegel, E. M. 2001, AJ, 121, 1497
- Blanton et al. (2001) Blanton, M. R., et al. 2001, AJ, 121, 2358
- Brandt et al. (2001a) Brandt, W. N., et al. 2001a, AJ, 122, 2810 (Paper V)
- Brandt et al. (2001b) Brandt, W. N., et al. 2001b, AJ, 122, 1 (Paper IV)
- Budavári et al. (2000) Budavári, T. ., Szalay, A. S., Connolly, A. J., Csabai, I. ., & Dickinson, M. 2000, AJ, 120, 1588
- Cohen (2001) Cohen, J. G. 2001, AJ, 121, 2895
- Cohen et al. (2000) Cohen, J. G., Hogg, D. W., Blandford, R., Cowie, L. L., Hu, E., Songaila, A., Shopbell, P., & Richberg, K. 2000, ApJ, 538, 29
- Colbert & Ptak (2002) Colbert, E., & Ptak, A. 2002, ApJS(in press)
- Colbert & Mushotzky (1999) Colbert, E. J. M., & Mushotzky, R. F. 1999, ApJ, 519, 89
- Comastri et al. (2002) Comastri, A., et al. 2002, ApJ, 571, 771
- Conselice et al. (2000) Conselice, C. J., Bershady, M. A., & Gallagher, J. S. 2000, A&A, 354, L21
- Conselice et al. (2000) Conselice, C. J., Bershady, M. A., & Jangren, A. 2000, ApJ, 529, 886
- David et al. (1992) David, L. P., Jones, C., & Forman, W. 1992, ApJ, 388, 82
- Dessauges-Zavadsky et al. (2000) Dessauges-Zavadsky, M., Pindao, M., Maeder, A., & Kunth, D. 2000, A&A, 355, 89
- Fabbiano (1989) Fabbiano, G. 1989, ARA&A, 27, 87
- Fabbiano (1995) Fabbiano, G. 1995, in X-ray binaries, ed. W. H. G. Lewin, J. van Paradijs, & E. P. J. van den Heuvel (Cambridge University Press)
- Fiore et al. (2000) Fiore, F., et al. 2000, New Astronomy, 5, 143
- Freeman et al. (2002) Freeman, P. E., Kashyap, V., Rosner, R., & Lamb, D. Q. 2002, ApJS, 138, 185
- Garmire et al. (2003) Garmire, G. P., Bautz, M. W., Ford, P. G., Nousek, J. A., & Ricker, G. R. 2003, Proc. SPIE Vol. 4851 000-000, in press, 4851
- Gehrels (1986) Gehrels, N. 1986, ApJ, 303, 336
- Giacconi et al. (2001) Giacconi, R., et al. 2001, ApJ, 551, 624
- Giacconi et al. (2002) Giacconi, R., et al. 2002, ApJS, 139, 369
- Green et al. (2003) Green, P. J., et al. 2003, ApJ, submitted
- Griffiths et al. (2000) Griffiths, R. E., Ptak, A., Feigelson, E. D., Garmire, G., Townsley, L., Brandt, W. N., Sambruna, R., & Bregman, J. N. 2000, Science, 290, 1325
- Hasinger et al. (1998) Hasinger, G., Burg, R., Giacconi, R., Schmidt, M., Trumper, J., & Zamorani, G. 1998, A&A, 329, 482
- Hill et al. (1998a) Hill, G. J., Nicklas, H. E., MacQueen, P. J., Mitsch, W., Wellem, W., Altmann, W., Wesley, G. L., & Ray, F. B. 1998a, in Proc. SPIE Vol. 3355, p. 433-443, Optical Astronomical Instrumentation, Sandro D’Odorico; Ed., Vol. 3355, 433
- Hill et al. (1998b) Hill, G. J., Nicklas, H. E., MacQueen, P. J., Tejada, C., Cobos Duenas, F. J., & Mitsch, W. 1998b, in Proc. SPIE Vol. 3355, p. 375-386, Optical Astronomical Instrumentation, Sandro D’Odorico; Ed., Vol. 3355, 375
- Ho et al. (1993) Ho, L. C., Filippenko, A. V., & Sargent, W. L. W. 1993, ApJ, 417, 63
- Hornschemeier et al. (2002) Hornschemeier, A. E., Brandt, W. N., Alexander, D. M., Bauer, F. E., Garmire, G. P., Schneider, D. P., Bautz, M. W., & Chartas, G. 2002, ApJ, 568, 82 (Paper VIII)
- Hornschemeier et al. (2001) Hornschemeier, A. E., et al. 2001, ApJ, 554, 742 (Paper II)
- Hornschemeier et al. (2000) Hornschemeier, A. E., et al. 2000, ApJ, 541, 49 (Paper I)
- Irwin (1997) Irwin, J. A. 1997, Ph.D. Thesis
- King et al. (2001) King, A. R., Davies, M. B., Ward, M. J., Fabbiano, G., & Elvis, M. 2001, ApJ, 552, L109
- Koekemoer et al. (2002) Koekemoer, A. M., et al. 2002, ApJ, 567, 657
- Koo (2001) Koo, D. C. 2001, in Deep Fields, proceedings of the ESO/ECF/STScI Workshop held at Garching, Germany, 9-12 October 2000. Stefano Cristiani, Alvio Renzini, Robert E. Williams (eds.), 107
- Lehmann et al. (2001) Lehmann, I., et al. 2001, A&A, 371, 833
- Lira et al. (2002) Lira, P., Ward, M., Zezas, A., Alonso-Herrero, A., & Ueno, S. 2002, MNRAS, 330, 259
- Maccacaro et al. (1988) Maccacaro, T., Gioia, I. M., Wolter, A., Zamorani, G., & Stocke, J. T. 1988, ApJ, 326, 680
- Makishima et al. (2000) Makishima, K., et al. 2000, ApJ, 535, 632
- Miyaji & Griffiths (2002) Miyaji, T., & Griffiths, R. E. 2002, ApJ, 564, L5
- Miyaji et al. (1998) Miyaji, T., Ishisaki, Y., Ogasaka, Y., Ueda, Y., Freyberg, M. J., Hasinger, G., & Tanaka, Y. 1998, A&A, 334, L13
- Moran et al. (1999) Moran, E. C., Lehnert, M. D., & Helfand, D. J. 1999, ApJ, 526, 649
- Murdoch et al. (1973) Murdoch, H. S., Crawford, D. F., & Jauncey, D. L. 1973, ApJ, 183, 1
- Oke et al. (1995) Oke, J. B., et al. 1995, PASP, 107, 375
- Petre et al. (1993) Petre, R., Mushotzky, R. F., Serlemitsos, P. J., Jahoda, K., & Marshall, F. E. 1993, ApJ, 418, 644
- Ptak et al. (2001) Ptak, A., Griffiths, R., White, N., & Ghosh, P. 2001, ApJ, 559, L91
- Ramsey et al. (1998) Ramsey, L. W., et al. 1998, in Proc. SPIE Vol. 3352, p. 34-42, Advanced Technology Optical/IR Telescopes VI, Larry M. Stepp; Ed., Vol. 3352, 34
- Read et al. (1997) Read, A. M., Ponman, T. J., & Strickland, D. K. 1997, MNRAS, 286, 626
- Richards et al. (1998) Richards, E. A., Kellermann, K. I., Fomalont, E. B., Windhorst, R. A., & Partridge, R. B. 1998, AJ, 116, 1039
- Roberts et al. (2002) Roberts, T. P., Goad, M. R., Ward, M. J., Warwick, R. S., & Lira, P. 2002, in Proceedings of ‘New Visions of the X-ray Universe in the XMM-Newton and Chandra Era’, 26-30 November 2001, ESTEC, The Netherlands.
- Schmidt et al. (1998) Schmidt, M., et al. 1998, A&A, 329, 495
- Schneider et al. (2000) Schneider, D. P., et al. 2000, PASP, 112, 6
- Shapley et al. (2001) Shapley, A., Fabbiano, G., & Eskridge, P. B. 2001, ApJS, 137, 139
- Siegel (1988) Siegel, N., S. & Castellan. 1988, Nonparametric Statistics for the Behavioral Sciences (McGraw-Hill, Boston)
- Stark et al. (1992) Stark, A. A., Gammie, C. F., Wilson, R. W., Bally, J., Linke, R. A., Heiles, C., & Hurwitz, M. 1992, ApJS, 79, 77
- Steidel & Hamilton (1993) Steidel, C. C., & Hamilton, D. 1993, AJ, 105, 2017
- Stocke et al. (1991) Stocke, J. T., Morris, S. L., Gioia, I. M., Maccacaro, T., Schild, R., Wolter, A., Fleming, T. A., & Henry, J. P. 1991, ApJS, 76, 813
- Townsley et al. (2000) Townsley, L. K., Broos, P. S., Garmire, G. P., & Nousek, J. A. 2000, ApJ, 534, L139
- Townsley et al. (2002) Townsley, L. K., Broos, P. S., Nousek, J. A., & Garmire, G. P. 2002, Nuclear Instruments and Methods in Physics Research, in press
- Tozzi et al. (2001) Tozzi, P., et al. 2001, ApJ, 562, 42
- Vecchi et al. (1999) Vecchi, A., Molendi, S., Guainazzi, M., Fiore, F., & Parmar, A. N. 1999, A&A, 349, L73
- Warwick (2002) Warwick, R. S. 2002, in Proceedings of the symposium ‘New Visions of the X-ray Universe in the XMM-Newton and Chandra Era’, 26-30 November 2001, ESTEC, The Netherlands.
- Weisskopf et al. (2002) Weisskopf, M. C., Brinkman, B., Canizares, C., Garmire, G., Murray, S., & Van Speybroeck, L. P. 2002, PASP, 114, 1
- Williams et al. (1996) Williams, R. E., et al. 1996, AJ, 112, 1335
| RAa | DECa | Pos. err.b | Countsc | ( erg cm-2s-1) | (Ms)e | ||||||||||
|---|---|---|---|---|---|---|---|---|---|---|---|---|---|---|---|
| (J2000) | (J2000) | (′′) | FB | HB | SB | FB | HB | SB | FB | (′′) | Srcf | FB | SB | ||
| 12 35 55.43 | 62 15 05.0 | 0.8 | 4.66 | 2.19 | 1.66 | 18.58 | 1.4 | 2 | |||||||
| 12 35 56.25 | 62 16 17.4 | 0.8 | 7.74 | 6.61 | 1.60 | 17.96 | 0.4 | 2 | |||||||
| 12 35 59.72 | 62 15 50.0 | 0.7 | 3.84 | 1.52 | 1.68 | 18.80 | 0.1 | 2 | |||||||
| 12 36 02.17 | 62 15 49.2 | 0.7 | 0.27 | 1.62 | 17.55 | 0.4 | 2 | ||||||||
| 12 36 09.75 | 62 11 45.9 | 0.6 | 2.87 | 1.18 | 1.69 | 18.25 | 0.9 | 2 | |||||||
| 12 36 14.42 | 62 13 19.0 | 0.6 | 3.31 | 0.85 | 1.80 | 20.60 | 0.3 | 1 | |||||||
| 12 36 16.81 | 62 14 36.0 | 0.6 | 0.79 | 0.42 | 1.80 | 21.14 | 1.2 | 1 | |||||||
| 12 36 19.45 | 62 12 52.4 | 0.6 | 1.81 | 0.80 | 1.62 | 20.68 | 0.2 | 1 | |||||||
| 12 36 22.53 | 62 15 45.2 | 0.6 | 1.06 | 3.16 | 2.55 | 0.65 | 1.88 | 20.74 | 0.9 | 1 | |||||
| 12 36 22.76 | 62 12 59.7 | 0.6 | 0.53 | 1.77 | 20.95 | 0.1 | 1 | ||||||||
| 12 36 23.00 | 62 13 46.9 | 0.6 | 2.05 | 0.70 | 1.47 | 20.89 | 0.6 | 1 | |||||||
| 12 36 25.39 | 62 14 04.8 | 0.3 | 3.19 | 19.40 | 3.76 | 18.80 | 1.51 | 17.32 | 0.3 | 1 | |||||
| 12 36 31.66 | 62 09 07.3 | 0.6 | 2.76 | 0.98 | 1.77 | 20.32 | 0.6 | 1 | |||||||
| 12 36 33.81 | 62 08 07.7 | 0.8 | 2.68 | 0.99 | 1.78 | 15.48 | 0.5 | 2 | |||||||
| 12 36 37.18 | 62 11 35.0 | 0.6 | 1.07 | 0.52 | 1.72 | 18.90 | 2.2 | 1 | |||||||
| 12 36 40.12 | 62 19 42.0 | 0.7 | 6.04 | 5.31 | 1.74 | 15.47 | 0.9 | 2 | |||||||
| 12 36 41.81 | 62 11 32.1 | 0.6 | 2.22 | 1.02 | 1.69 | 19.96 | 1.1 | 1 | |||||||
| 12 36 44.00 | 62 12 50.1 | 0.6 | 0.71 | 0.35 | 1.93 | 21.41 | 0.3 | 1 | |||||||
| 12 36 47.04 | 62 12 38.2 | 0.6 | 0.24 | 1.93 | 20.98 | 1.4 | 1 | ||||||||
| 12 36 48.37 | 62 14 26.4 | 0.6 | 1.61 | 0.75 | 1.94 | 18.81 | 0.5 | 1 | |||||||
| 12 36 49.45 | 62 13 47.1 | 0.6 | 0.84 | 0.42 | 1.67 | 18.26 | 0.4 | 1 | |||||||
| 12 36 51.15 | 62 10 30.4 | 0.6 | 2.02 | 0.92 | 1.83 | 20.58 | 0.5 | 1 | |||||||
| 12 36 52.89 | 62 14 44.1 | 0.6 | 2.10 | 4.34 | 2.19 | 2.44 | 1.73 | 19.50 | 0.1 | 1 | |||||
| 12 36 52.95 | 62 07 26.8 | 0.9 | 5.23 | 3.30 | 1.76 | 14.01 | 0.3 | 2 | |||||||
| 12 36 54.26 | 62 07 45.3 | 0.8 | 1.74 | 0.64 | 1.77 | 19.70 | 0.2 | 2 | |||||||
| 12 36 58.33 | 62 09 58.5 | 0.6 | 1.42 | 0.69 | 1.82 | 18.36 | 0.4 | 1 | |||||||
| 12 36 58.85 | 62 16 37.9 | 0.6 | 1.08 | 0.50 | 1.85 | 19.87 | 0.1 | 1 | |||||||
| 12 37 01.99 | 62 11 22.1 | 0.6 | 1.01 | 0.51 | 1.89 | 19.51 | 0.9 | 1 | |||||||
| 12 37 06.12 | 62 17 11.9 | 0.6 | 0.74 | 2.98 | 2.80 | 0.46 | 1.87 | 19.05 | 0.9 | 1 | |||||
| 12 37 08.33 | 62 10 55.9 | 0.6 | 2.77 | 0.98 | 1.76 | 20.34 | 0.6 | 1 | |||||||
| 12 37 15.94 | 62 11 58.3 | 0.6 | 1.06 | 0.53 | 1.67 | 18.43 | 0.7 | 1 | |||||||
| 12 37 16.82 | 62 10 07.9 | 0.6 | 0.97 | 0.54 | 1.62 | 20.71 | 0.4 | 1 | |||||||
| 12 37 18.51 | 62 08 12.3 | 0.9 | 0.97 | 1.49 | 20.14 | 2.0 | 2 | ||||||||
| 12 37 21.60 | 62 12 46.8 | 0.6 | 1.81 | 0.66 | 1.43 | 18.88 | 2.3 | 1 | |||||||
| 12 37 23.45 | 62 10 47.9 | 0.7 | 0.61 | 1.72 | 19.58 | 3.0 | 1 | ||||||||
| 12 37 25.57 | 62 19 42.9 | 1.0 | 4.02 | 0.92 | 1.76 | 18.11 | 1.7 | 2 | |||||||
| 12 37 25.65 | 62 16 49.0 | 0.7 | 3.94 | 2.82 | 1.82 | 19.05 | 0.2 | 1 | |||||||
| 12 37 27.71 | 62 10 34.3 | 0.8 | 2.88 | 0.97 | 1.66 | 17.85 | 1.7 | 2 | |||||||
| 12 37 30.60 | 62 09 43.1 | 0.9 | 6.27 | 1.05 | 1.61 | 18.68 | 1.8 | 2 | |||||||
| 12 37 34.10 | 62 11 39.6 | 0.8 | 1.79 | 0.84 | 1.67 | 19.27 | 0.5 | 2 | |||||||
| 12 37 37.14 | 62 12 05.3 | 0.8 | 1.27 | 0.60 | 1.63 | 19.20 | 0.9 | 2 | |||||||
| 12 37 37.99 | 62 16 31.3 | 0.9 | 3.46 | 1.48 | 1.67 | 13.20 | 0.7 | 2 | |||||||
| 12 37 42.22 | 62 15 18.5 | 0.9 | 1.10 | 14.70 | 11.40 | 3.09 | 1.73 | 18.33 | 0.3 | 2 | |||||
| CXOHDFN Namea | IDg | ||||||
|---|---|---|---|---|---|---|---|
| (J2000) | (′′) | Srce | SB | FB | |||
| 123555.4+621505 | 1.2 | 1 | 40.50 | 40.82 | |||
| 123556.2+621617 | 0.4 | 1 | 41.32 | 41.39 | |||
| 123559.7+621550 | 0.5 | 1 | 40.93 | 41.33 | |||
| 123602.1+621549 | 0.4 | 2 | 38.75 | ||||
| 123609.7+621145 | 0.9 | 1 | 39.83 | 40.21 | |||
| 123614.4+621319 | 0.7 | 1 | 40.87 | 41.46 | |||
| 123616.8+621436 | 0.2 | 3 | 40.69 | 40.97 | |||
| 123619.4+621252 | 0.2 | 2 | 40.89 | 41.24 | |||
| 123622.5+621545 | 1.06 | 0.5 | 3 | 41.12 | 41.81 | ||
| 123622.7+621259 | 0.4 | 2 | 40.71 | ||||
| 123623.0+621346 | 0.7 | 2 | 40.85 | 41.32 | |||
| 123625.3+621404 | 3.19 | 0.3 | 2 | ||||
| 123631.6+620907 | 0.5 | 1 | 41.58 | 42.03 | |||
| 123633.8+620807 | 0.4 | 2 | |||||
| 123637.1+621135 | 2.3 | 2 | 38.95 | 39.27 | |||
| 123640.1+621942 | 0.6 | 1 | |||||
| 123641.8+621132 | 1.4 | 2 | 39.37 | 39.71 | |||
| 123644.0+621250 | 0.2 | 2 | 40.70 | 41.00 | |||
| 123647.0+621238 | 1.3 | 2 | 39.96 | ||||
| 123648.3+621426 | 0.6 | 2 | 39.65 | 39.98 | |||
| 123649.4+621347 | 0.3 | 2 | 38.99 | 39.29 | |||
| 123651.1+621030 | 0.6 | 2 | 40.80 | 41.14 | |||
| 123652.8+621444 | 2.10 | 0.3 | 2 | 40.98 | 41.23 | ||
| 123652.9+620726 | 0.6 | 2 | |||||
| 123654.2+620745 | 0.8 | 3 | 39.94 | 40.37 | |||
| 123658.3+620958 | 0.5 | 2 | 39.60 | 39.91 | |||
| 123658.8+621637 | 0.6 | 2 | 40.22 | 40.55 | |||
| 123701.9+621122 | 0.8 | 2 | 39.46 | 39.76 | |||
| 123706.1+621711 | 0.74 | 0.4 | 3 | 40.01 | 40.83 | ||
| 123708.3+621055 | 0.7 | 2 | 40.86 | 41.31 | |||
| 123715.9+621158 | 0.9 | 2 | 39.30 | 39.60 | |||
| 123716.8+621007 | 0.5 | 2 | 40.57 | 40.83 | |||
| 123718.5+620812 | 1.4 | 3 | 40.83 | ||||
| 123721.6+621246 | 2.7 | 2 | 39.34 | 39.78 | |||
| 123723.4+621047 | 3.1 | 3 | 39.37 | ||||
| 123725.5+621942 | 1.2 | 1 | 40.40 | 41.05 | |||
| 123725.6+621649 | 0.7 | 1 | |||||
| 123730.6+620943 | 1.7 | 2 | 40.54 | 41.31 | |||
| 123734.1+621139 | 0.7 | 2 | 40.05 | 40.39 | |||
| 123737.1+621205 | 1.5 | 3 | 40.62 | 40.94 | |||
| 123737.9+621631 | 1.5 | 1 | |||||
| 123742.2+621518 | 1.10 | 0.1 | 1 | 39.62 | 40.30 | ||
| CXOHDFN Name (J2000) | Descriptionb | Error of | Notes | |||
|---|---|---|---|---|---|---|
| J123637.1+621135 | 0.078 | spiral w/knots | 2.80 | 0.199 | 0.018 | Possible off-nuclear |
| J123641.8+621132 | 0.089 | spiral | 3.02 | 0.282 | 0.001 | Off-nuclear |
| J123649.4+621347 | 0.089 | E/S0 | 3.76 | 0.093 | 0.000 | |
| J123721.6+621246 | 0.106 | Grand-design Sb | 3.17 | 0.095 | 0.029 | Off-nuclear |
| J123715.9+621158 | 0.112 | spiral | 4.42 | 0.205 | 0.005 | |
| J123723.4+621047 | 0.113 | disk/spiral | 3.46 | 0.209 | 0.029 | Possible off-nuclear, edge-on spiral |
| J123701.9+621122 | 0.136 | barred spiral | 2.54 | 0.090 | 0.022 | Possible off-nuclear, prominent bar |
| J123658.3+620958 | 0.137 | Sc spiral, tail | 3.62 | 0.148 | 0.011 | |
| J123648.3+621426 | 0.139 | spiral w/knots | 3.10 | 0.455 | 0.000 | |
| J123647.0+621238 | 0.321 | disk | 3.83 | 0.134 | 0.002 | |
| J123652.8+621444 | 0.322 | E/S0 | 4.20 | 0.043 | near chip gap, parameters less certain | |
| J123651.1+621030 | 0.410 | spiral | 3.66 | 0.076 | near chip gap, parameters less certain | |
| J123708.3+621055 | 0.423 | edge-on disk | 2.94 | 0.357 | 0.019 | |
| J123614.4+621319 | 0.454 | E/S0 | 3.73 | 0.122 | 0.010 | |
| J123623.0+621346 | 0.485 | disk | 3.11 | 0.151 | 0.017 | Possible spiral structure |
| J123616.8+621436 | 0.515 | irregular | 2.94 | 0.312 | 0.069 | Possible merger |
| J123644.0+621250 | 0.557 | merger | 3.07 | 0.315 | 0.002 | Another galaxy 30 away. |
| J123622.5+621545 | 0.647 | spiral/tail | 3.38 | 0.353 | 0.031 | Disturbed morphology |
| OBXFa | Intermediatea,b | Full X-ray Sample (OBXF) | |
|---|---|---|---|
| Object category | [] | [] | [All values of ] |
| Galactic Stars | % | % | |
| “Normal” | % | % | % |
| Starburst/LLAGN | % | % | % |
| AGNc | % | % |
| CXOHDFN Name | Offset | Offset | NOTES | |||
|---|---|---|---|---|---|---|
| Name | (′′) | (kpc) | SB | FB | ||
| Highly confident candidates | ||||||
| 123641.8+621132 | 0.089 | 1.1 | 2.0 | 39.37 | 39.71 | Spiral galaxy in HDF-N, see Paper II |
| 123721.6+621246 | 0.106 | 2.3 | 4.8 | 39.34 | 39.78 | Grand-design spiral (Figure 2) |
| Other candidates | ||||||
| 123637.1+621135 | 0.078 | 2.2 | 3.5 | 38.95 | 39.27 | Clumpy spiral galaxy |
| 123701.9+621122 | 0.136 | 0.9 | 2.3 | 39.46 | 39.76 | Spiral with prominent bar |
| 123723.4+621047 | 0.113 | 3.0 | 6.6 | 39.37 | Edge-on spiral | |


CXOHDFN J123622.5+621545
This spiral galaxy has a high X-ray luminosity ( erg s-1, 0.5–8 keV) as compared to the rest of the OBXF population. It also is just marginally included in the OBXF sample as its full-band X-ray-to-optical flux ratio is (the soft-band X-ray-to-optical flux ratio is ) and its X-ray photon index is . The host galaxy is fairly irregular, just narrowly below the asymmetry cutoff for mergers (see §4.4), so it is possible that this is a galaxy undergoing a vigorous starburst.
CXOHDFN J123706.1+621711
This galaxy has a hard implied X-ray spectrum, but a low enough full-band X-ray-to-optical flux ratio to be included in the sample (). The X-ray luminosity is erg s-1(0.5–8 keV). We do not have access to its optical spectrum to constrain its nature further.
CXOHDFN J123742.2+621518
This source has a 0.5–8.0 keV luminosity of erg s-1 () and a fairly hard X-ray spectrum (). The X-ray source is coincident with the nucleus of its host galaxy. The optical spectrum of CXOHDFN J123742.3+621518, obtained with the HET, shows emission lines in H, [O iii], [O i] , [S ii], H, and [N ii], so we are able to perform some basic emission-line ratio diagnostics (e.g, Ho et al., 1993; Dessauges-Zavadsky et al., 2000). Unfortunately, [O ii] lies at a wavelength just short of the blue limit of our HET spectrum, so some of the diagnostic line ratios, which require an estimate of [O ii] line flux, cannot be determined. However, using the line ratios of Figures 4, 5, and 6 of Ho et al. (1993), we are able to ascertain that the optical spectrum is intermediate between HII region/starburst-type spectra and Seyfert 2 type spectra. Both the [O i]/H and [N ii]/H ratios when compared with [O iii]/H indicate the object has a starburst-type spectrum.