Cool stars in NGC 2547 and pre main sequence lithium depletion
Abstract
We present the results of a spectroscopic survey of X-ray selected, low-mass candidate members of the young open cluster NGC 2547. Using a combination of photometry, spectroscopic indices and radial velocities we refine our candidate list and then use our spectroscopy to study the progression of lithium depletion in low-mass pre main sequence stars. We derive lithium abundances or upper limits for all our candidate members, which have effective temperatures in the range K, and compare these with predictions for lithium burning and depletion provided by a number of models and also with the lithium depletion seen in younger and older stars. We find that some models can reproduce the lithium abundance pattern of NGC 2547 if the cluster has an age of Myr, which is also indicated by fits to low-mass isochrones in the Hertzsprung-Russell diagram. But the lack of significant further lithium depletion between NGC 2547 and older clusters argues for an age of at least 50 Myr, more in keeping with the lack of lithium observed in even fainter NGC 2547 candidates. We show that reconciliation of these age estimates may require additions to the physics incorporated in current generations of pre main sequence models.
keywords:
stars: abundances – stars: late-type – open clusters and associations: individual: NGC 25471 Introduction
Tracing the evolution of lithium abundances in the cool stars of Population I open clusters is an excellent way of exploring internal mixing in stars with partially or fully convective envelopes. In the last 15 years, many Li abundance measurements have been made in dozens of clusters (see Jeffries 2000 and references therein). An empirical picture has emerged from this observational work that is at odds with the parallel efforts of theory.
“Standard” models incorporate convection as the sole means of mixing Li-depleted material from hot interior layers to the stellar surface. Photospheric Li depletion occurs swiftly once the base of the convection zone (or if fully convective, the core of the star) becomes hot enough to burn Li in p, reactions (at K). For G and K stars with K, Li depletion should have largely ended by the time these stars reach the ZAMS, because their convection zone bases have pushed outwards to cooler temperatures (Pinsonneault 1997). Yet the Sun’s Li abundance is nearly two orders of magnitude lower than ZAMS stars of similar mass, and observations of open clusters with different ages clearly show (see Thorburn et al. 1993; Soderblom et al. 1993; Jones, Fischer & Soderblom 1999; Ford et al. 2001) that Li depletion continues during main sequence evolution, on timescales of 100 Myr to a few Gyr. Furthermore, the expected strong metallicity dependence of PMS Li depletion is not present. Clusters with the same age, but quite different metallicity have similar Li depletion patterns among their F, G and K stars when they reach the ZAMS (Jeffries & James 1999; Barrado y Navascués, Deliyannis & Stauffer 2001; Jeffries et al. 2002).
So far most work has concentrated on the warmer F, G and K stars, primarily because they are brighter and have higher Li abundances. Li is undetectable in the Pleiades (age 120 Myr) below about 4200 K (Jones et al. 1996), but is clearly seen in low mass PMS stars of similar temperatures in star forming regions at ages of a few Myr (e.g. Martín et al. 1994; Zapatero Osorio et al. 2002). Rapid PMS Li-destruction in these cool stars is qualitatively expected from “standard” evolutionary models but the detailed behaviour is quite dependent on a number of uncertain features in stellar evolution models – particularly the treatment of convection and convective overshoot (Chaboyer, Demarque & Pinsonneault 1995). A recent paper by Randich et al. (2001) has presented Li measurements in cool K and M dwarfs of the young (age 30-50 Myr) IC 2391 and IC 2602 clusters. They find that these stars are depleted from their initial Li abundance and are on average more Li rich than stars in the Pleiades. However, some K stars have Li abundances that are nearly as low as their most Li-depleted Pleiades counterparts. Randich et al. deduced that unless Li depletion was halted, these stars would ultimately become more Li-depleted than Pleiades stars of the same effective temperature (), by the time they reached the ZAMS. This conclusion is surprising because, as mentioned above, no significant differences in the level of Li depletion have been seen among the G and K stars of several open clusters with age Myr.
In this paper we present the results of an investigation into Li depletion among the cooler K and M stars of NGC 2547 (=C0809-491), a young cluster at a distance of pc and with a small reddening, (Clariá 1982). Jeffries & Tolley (1998) found that NGC 2547 was a very young cluster, using an X-ray survey that discovered many coronally active low-mass cluster members. Fitting low-mass isochrones, Naylor et al. (2002) have determined an age of 20-35 Myr for NGC 2547. We have used fibre spectroscopy to confirm cluster membership and study the Li I 6708Å resonance line in a sample of X-ray selected low-mass stars in NGC 2547. Section 2 describes our target selection and the spectroscopy. Section 3 presents our results in terms of spectral classification, radial velocities and the strength of the H and Li I 6708Å lines. In Sect. 4 we address the issues of completeness and contamination in our sample. In Sect. 5 we estimate Li abundances for the cluster members and compare them with theoretical models and similar data for the Pleiades, IC 2391 and IC 2602. Our results are discussed in Sect. 6.
2 Target Selection and Spectroscopy
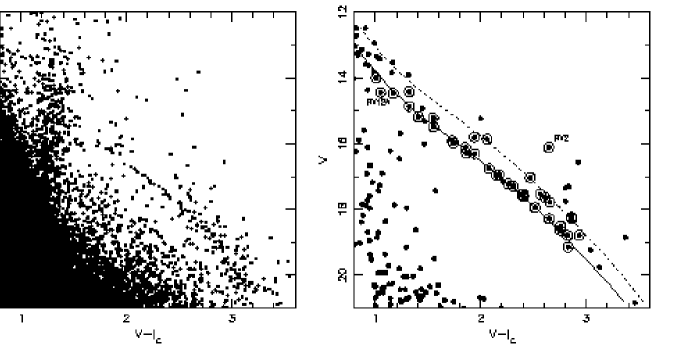
Targets for fibre spectroscopy were taken from Table 2 of Jeffries & Tolley (1998) and we refer to them throughout this paper by the identifier given there. These stars were identified as responsible for the 0.1-2 keV X-ray emission seen by the ROSAT satellite and almost all were considered likely members of NGC 2547 on the basis of their positions in (Johnson), (Cousins) colour-magnitude and colour-colour diagrams111In this paper we will use magnitudes and colours for our targets taken from Naylor et al. (2002). These can differ at the level of a few hundredths of a magnitude from those in Jeffries & Tolley (1998), but should be more precise.. The targets range in brightness from , with a colour range of and a mass range of approximately (using the models of Baraffe et al. 1998, 2002). Figure 1b shows the versus diagram for our targets.
As NGC 2547 is relatively compact, we were able to use the 2dF spectrograph at the 3.9-m Anglo-Australian Telescope (see Lewis et al. 2002) to obtain spectra of 37 objects simultaneously. Very accurate astrometry for our targets was obtained firstly from our own CCD images (Jeffries & Tolley 1998; Naylor et al. 2002). Positions were then improved by comparison with scans of the appropriate UK Schmidt plate from the SuperCOSMOS sky survey (see Hambly et al. 2001). Fifteen fibres were placed on adjacent blank-sky areas that had no stars visible on the Schmidt plates. The observations were performed in service mode on 24 January 1999. The 1200V grating was used at a central wavelength of 6800Å. Unfortunately this was not quite the optimal configuration for our purposes – the 1200R grating has a somewhat higher efficiency at these wavelengths. A wavelength range of approximately 1080Å and a 2.5-pixel resolution of about 2.7Å were achieved. Four separate target exposures were obtained, each of length 1800 s, together with tungsten and arc lamp exposures and two 300 s exposures of offset “blank” sky.
Data reduction was achieved using version 2.0 of the 2dfdr package (Bailey, Glazebrook & Bridges 2002), which included bias subtraction, removal of scattered light and optimal extraction of the spectra. Relative fibre transmissions were determined from offset sky exposures. A mean sky spectrum was calculated from the fifteen sky fibres and a scaled version of this was subtracted from each target spectrum. By looking at the results of sky-subtraction for the sky fibres themselves, we estimate that the relative fibre transmissions were accurate to about five per cent.
3 Results
3.1 Spectral classification
For each target we calculated two narrow-band spectral indices, both of which are temperature sensitive and the second of which is somewhat sensitive to surface gravity. These indices are defined by Briceño et al. (1998, following Kirkpatrick, Henry & McCarthy 1991; Allen 1995) as
where and indicate pseudo-continuum and absorption features, integrated over the indicated wavelength ranges.
The indices were calibrated using a set of older late K and M dwarfs in the Praesepe open cluster (age Myr) observed by Allen & Strom (1995), a set of M dwarf field stars observed at Å resolution on the Keck II and 4-m Blanco telescopes (see Barrado y Navascués, Stauffer & Patten 1999) and K and M dwarf field stars taken from the spectral atlas of Montes et al. (1997). To ensure comparability, all spectra were blurred to match the 6Å resolution of Allen & Strom’s data before calculating the indices. Photoelectric photometry is available for most of the field stars from Stauffer & Hartmann (1986), Bessell (1990) or Leggett (1992). Colours on the Kron system were converted to colours on the Cousins system using formulae from Bessell & Weis (1987).


We use the TiO(7140Å) index as the primary spectral type indicator. The spectral types listed in Table 1 are estimated to be good to the nearest subclass. In Fig. 3, we show the TiO(7140Å) index as a function of intrinsic colour for NGC 2547 and the field stars. An of 0.077 was assumed for NGC 2547 (see Jeffries & Tolley 1998). The plot shows reasonable agreement, with perhaps a hint that the colours in NGC 2547 are too blue by mag. Systematic errors in the photometric calibration at this level are not surprising given the difficulty in finding very red calibration stars. The stars RX 2 and RX 98 stand out as unusual objects. Their colours are too red for their spectral types. Figure 2 shows some of our spectra in order of spectral type, including those of RX 2 and RX 98.
Figure 4 shows the gravity sensitive CaH(6975Å) index plotted aginst the TiO(7140Å) index. This time we have included the Praesepe stars as well, because this plot does not require accurate photometry. Also shown is a locus (from Allen & Strom 1995), indicating where low gravity giants lie. All our targets have dwarf-like gravities, although there is a hint that the gravities are lower on average than in Praesepe and the field stars. This is precisely what we would expect from a population of late K and M dwarfs in a cluster of age Myr. The evolutionary models of Chabrier & Baraffe (1997) indicate that stars of 0.3 to 0.9 and age Myr, have surface gravities that are between 0.46 and 0.11 dex lower than at 800 Myr, but which are still several dex higher than M giant gravities.
3.2 Relative radial velocities
Genuine members of NGC 2547 should share a common radial velocity (subject to the intrinsic cluster dispersion of km s-1 – Jeffries, Totten & James 2000), unless they are in close binary systems. Unfortunately, we could not obtain spectra of radial velocity (RV) standards during our service observations and so cannot put our observations onto an absolute heliocentric velocity scale. Nevertheless we can find relative RVs for our targets by cross-correlation.
The targets were split into three groups according to their spectral types – K, M0-M2 and M3-M4. For the K-stars we have three targets, RX 3, 10 and 12A, for which heliocentric RVs were measured by Jeffries et al. (2000). RX 12A was measured twice on separate nights and found to have a constant RV that is inconsistent with cluster membership (it is a photometric non-member as well – see Sect. 3.5). We choose this star to act as our primary standard and cross-correlate it against the other K-stars, using the wavelength range Å, which contains no significant telluric absorption or sky emission lines. Apart from RX 76A, we find that the K-stars have an RV that is km s-1 smaller than RX 12A, with an rms scatter of 4.9 km s-1. A large fraction of this scatter is likely due to the precision of our wavelength calibration. A typical fibre exhibited a 10 km s-1 rms between the measured and calculated positions of the lines. Given that about 20 lines were used in the calibration solution, this suggests zeropoint uncertainties of just over 2 km s-1 in a single measurement and about 3 km s-1 in a cross-correlation lag, assuming that the target and template match perfectly. The mean RV is in excellent agreement with Jeffries et al. (2000), where the heliocentric RV of RX 12A was found to be km s-1 compared with the cluster mean of km s-1. Thus most of the K stars can be classified as cluster members based on their RV (including RX 2, which is a clear photometric non-member). For RX 76A we find an RV which is 0.8 km s-1 greater than that of RX 12A.
As we move towards cooler stars, molecular features becomes more prominent. For these objects we cross-correlated the wavelength range Å, containing the strong CaH and TiO features discussed in Sect. 3.1. For the M0-M2 stars we used RX 81 as the template and for the M3-M4 stars we chose RX 90. In both groups we find strong clustering of relative RVs around zero, the only significant exception being RX 60. The mean RV of the M0-M2 stars relative to RX 81 is km s-1, with a standard deviation of 4.4 km s-1 (from 15 stars), and the mean RV of the M3-M4 stars relative to RX 90 is km s-1 with a standard deviation of 4.5 km s-1 (from 10 stars). RX 60 is clearly discrepant with an RV (relative to RX 90) of km s-1.
Whilst RV is capable of identifying non-members of the cluster, it is not conclusive at this level of precision. As our objects are X-ray selected, we expect any contaminating field objects to be X-ray active, have young disk kinematics and hence RVs that are within 20-30 km s-1 of NGC 2547. Nevertheless it is encouraging that all but three of our targets have RVs that are within 10 km s-1 of the mean and by selecting on RV we should cut down the level of possible contamination by a factor of a few.
3.3 H equivalent widths
The contribution from the “sky” to H in the target fibres is substantial for our targets and exceeds the target signal by factors of ten in some cases. Because of this, uncertainties in the relative fibre throughputs are important, however the dominant source of error is the strong, spatially varying H emission from an H ii region that appears to coincide with NGC 2547 and is visible even on the Digitized Sky Survey images. With only 15 sky fibres, we have not sampled this emission finely enough to provide anything but a crude sky subtraction for the stellar targets. The H equivalent widths (EWs) were simply determined by direct integration above a pseudo-continuum. The uncertainties have been estimated by assuming they are similar in size to the residuals seen in spectra measured from the sky fibres at H after the mean sky has been subtracted. This residual flux is combined with the observed continuum flux of the stellar targets to form an EW uncertainty.
The H EWs are given in Table 1. Even given the substantial uncertainties, many of our targets show significant H in emission, indicative of chromospheric activity. None of the targets exhibit an H feature that is inconsistent with young, magnetically active members of NGC 2547.
3.4 Lithium 6708Å equivalent widths

There are no sky lines present at the expected position of the 6708Å Li I absorption feature. The sky continuum level at this wavelength is smaller than the continuum levels of all our targets and so the small uncertainty in the relative fibre throughput calibration is of little concern. Some examples of our spectra in the Li I 6708Å region are shown in Fig. 5.
We define two pseudo-continuum regions either side of the line and then integrate the Li I line over a fixed wavelength range to determine a pseudo-EW (pEW). The (internal) uncertainties are dominated by the signal-to-noise ratio per pixel (SNR) of our spectra. These are empirically (and conservatively) determined from the rms to straight line fits to our continuum regions. The pEW error is then estimated from the equation, , where and are the width over which the line is integrated and the width of a pixel respectively. Where no significant Li I line is seen, we estimate a 2-sigma upper limit. These pEWs (and upper limits) are listed in Table 1.
3.5 Final membership status
The membership status of each target is listed in col. 8 of Table 1. We are limited to using the photometry, RVs and spectral-types to classify them. Contaminating field stars in an X-ray selected sample are likely to be chromospherically active and possibly Li-rich in the case of K-stars (e.g. Jeffries 1995), so we should not use the presence of H emission or Li as membership criteria. Initially we check the position of each star in the colour-magnitude diagram (CMD – see Fig. 1b) against the expectations of an isochrone generated from the Baraffe et al. (1998) models (see Sect. 6), that appears to fit the bulk of the targets very well. If an object lies between 0.3 and 0.9 mag above this isochrone we class it as a probable binary system. The likely mass ratio of such systems would be . There are two objects (RX 2 and RX 12A) which we classify as non-members on the basis of their photometry.
Next we compare the spectroscopic classification with the colour. From this we judge that RX 2222The spectral type and colour of RX 2 are difficult to reconcile. This, together with a strong Li I 6708Å feature and RV consistent with cluster membership, suggest this object may be a cluster member with a weak cosmic ray affecting its I-band photometry (i.e. it could be a K-type cluster member with an anomalous value). and RX 98 are probably not cluster members. Finally we note that RX 12A, RX 60 and RX 76A were found to have RVs discrepant from the cluster mean. We have already discarded RX 12A as a member on photometric grounds, but the other two objects may be cluster members in binary systems and RX 76A does show photometric evidence of binarity. We treat RX 60 and RX 76A as possible cluster members in what follows.
| Name | SpT | H EW | Li I pEW | SNR | Status | A(Li) | |||
| RX | (Å) | (mÅ) | (K) | ||||||
| 2 | 16.113 | 2.644 | K7 | 100 | NM(p,s) | 3445 | - | ||
| 3 | 14.419 | 1.324 | K7 | 100 | B | 4343 | |||
| 9 | 14.863 | 1.321 | K5 | 120 | S | 4347 | |||
| 10 | 13.993 | 1.006 | K3 | 190 | S | 4983 | |||
| 11 | 16.120 | 1.854 | M0 | 60 | S | 3804 | |||
| 12A | 14.441 | 1.049 | K3 | 130 | NM(p,r) | 4880 | - | ||
| 14 | 16.951 | 2.173 | M1 | 70 | S | 3660 | |||
| 17 | 17.291 | 2.305 | M2 | 75 | S | 3609 | |||
| 21A | 17.543 | 2.566 | M3 | 40 | B | 3490 | |||
| 22A | 15.863 | 2.060 | M1 | 60 | B | 3705 | |||
| 23 | 19.147 | 2.827 | M4 | 10 | S | 3322 | |||
| 25A | 18.245 | 2.859 | M4 | 15 | B | 3297 | |||
| 26 | 16.301 | 1.940 | M0 | 30 | S | 3758 | |||
| 33 | 17.223 | 2.262 | M2 | 65 | S | 3626 | |||
| 37 | 15.915 | 1.728 | M0 | 60 | S | 3886 | |||
| 40 | 17.546 | 2.398 | M1 | 30 | S | 3571 | |||
| 43 | 16.966 | 2.149 | M1 | 70 | S | 3670 | |||
| 44 | 18.519 | 2.755 | M4 | 25 | S | 3373 | |||
| 46A | 18.796 | 2.820 | M4 | 15 | S | 3327 | |||
| 47 | 16.279 | 1.864 | M0 | 65 | S | 3798 | |||
| 50A | 15.484 | 1.554 | K7 | 80 | S | 4040 | |||
| 60 | 17.943 | 2.515 | M3 | 35 | S,NM(r) | 3515 | |||
| 61B | 17.608 | 2.406 | M2 | 30 | S | 3567 | |||
| 65A | 16.762 | 2.078 | M1 | 40 | S | 3698 | |||
| 71 | 18.644 | 2.753 | M4 | 15 | S | 3375 | |||
| 73 | 17.553 | 2.392 | M2 | 45 | S | 3573 | |||
| 76A | 15.224 | 1.549 | K7 | 95 | B,NM(r) | 4046 | |||
| 80A | 15.180 | 1.407 | K5 | 100 | S | 4219 | |||
| 81 | 15.981 | 1.739 | M0 | 60 | S | 3878 | |||
| 82 | 14.467 | 1.168 | K5 | 100 | S | 4622 | |||
| 83 | 18.793 | 2.933 | M4 | 20 | S | 3238 | |||
| 84B | 18.285 | 2.860 | M4 | 30 | B | 3296 | |||
| 88 | 17.037 | 2.470 | M3 | 45 | B | 3537 | |||
| 90 | 18.278 | 2.648 | M4 | 30 | S | 3443 | |||
| 93 | 17.646 | 2.612 | M4 | 50 | B | 3464 | |||
| 95 | 15.803 | 1.939 | M0 | 60 | B | 3759 | |||
| 98 | 17.779 | 2.654 | M2 | 30 | NM(s) | 3439 | - |
4 Completeness and Contamination
Our sample is certainly not complete however this is unlikely to be a problem in interpreting Li depletion patterns unless the sample is somehow unrepresentative. A possible problem is that, through X-ray selection, our sample is biased towards more rapidly rotating and magnetically active stars, which may not suffer the same Li-depletion as slowly rotating stars. The sample may also be contaminated with field objects. Jeffries & Tolley (1998) demonstrate that only one of the optical counterparts to X-ray sources coincident with the NGC 2547 PMS locus might be a chance correlation. Therefore contaminating field stars would also be X-ray active.
Figure 1a shows that subset of the CMD for NGC 2547 (from Naylor et al. 2002) that coincides with the 17 arcmin radius ROSAT observation of Jeffries & Tolley (1998 – see their Fig. 1). In Figure 1b we show those objects close to an X-ray source and circle targets for which we have spectra in this paper. We have not observed every X-ray counterpart that has photometry consistent with NGC 2547 membership, but we have observed nearly all of them with . The discussion of completeness and contamination among the spectroscopic targets is most conveniently split into three colour ranges.
: In this colour range, contamination among a photometrically selected sample is expected from background giants. Fortunately, these contaminants are not strong X-ray sources, so an X-ray selected sample should not contain giants. Contamination by young, active field dwarfs is a possibility, but the low density of X-ray sources both above and below the cluster sequence suggests there are few such contaminants in our entire sample. Furthermore, Jeffries & Tolley (1998 - their Sect. 4.2) argue that X-ray active, young field dwarfs would tend to lie well below the cluster PMS locus at these colours. The X-ray selected sample of cluster members in this colour range is small but also likely to be complete over the X-ray survey area. This is because the cluster candidates coincident with X-ray sources at these colours have X-ray luminosities far higher than the threshold for detection (see Jeffries & Tolley 1998; Jeffries et al. 2000). So our X-ray selected sample is complete and other (X-ray quiet) stars in the same region of the CMD are likely to be contaminating background giants.
: The low density of stars in the CMDs, both above and below the cluster sequence suggest that a photometrically selected sample of cluster candidates will suffer little contamination in this colour range (see Naylor et al. 2002). If we further restrict the sample to X-ray selected objects, then any small amount of contamination, mainly from field dwarfs, would be reduced by another factor of , since only field stars with ages Gyr would be so X-ray active. However, an X-ray selected sample is unlikely to be complete in this colour range, with only the most X-ray active NGC 2547 members being detected by ROSAT. If we assume that the photometric members in Fig.1a suffered no contamination, then the X-ray selected sample is about 50 per cent complete, becoming less so towards redder colours.
: The PMS locus of NGC 2547 appears to broaden here because of increasing photometric errors and variability for late dM stars. The cluster sequence is less clear and it becomes more difficult to separate cluster and field stars solely from photometry. The X-ray sources in this region of the CMD have , which is approximately the peak activity seen in late-type stars. Thus we expect our X-ray selected sample to be biased toward the most active dMe stars in NGC 2547 and we can see by comparing Figs. 1a and 1b that there are probably many more members of NGC 2547 in this colour range with lower X-ray activity. Furthermore, because the X-ray survey is flux-limited, we also expect the bulk of any detected field population to have , so in this portion of the CMD, the cluster and field sources coincide. We believe that several of the spectroscopic targets in this colour range could be non-members. Two such objects (RX 2 and RX 98) have been identified from their narrow-band spectral indices and one (RX 60) has a discrepant RV.
In summary, our spectroscopic sample, refined to include those objects with photometry, RV and narrow-band indices consistent with cluster membership, should be unbiased with respect to X-ray activity and contamination-free for ; moderately biased toward the most X-ray luminous stars but contamination free for ; and heavily biased towards the most X-ray active cluster members and possibly still containing one or two contaminating active dMe field stars for .
5 Lithium in NGC 2547
5.1 Lithium abundances: comparison with theoretical models


Models of PMS Li depletion predict Li abundances as a function of (or equivalently, mass) and age. To compare Li in NGC 2547 with models we calculated effective temperatures and estimated Li abundances with atmospheric syntheses.
For the conversion between and we chose an empirical relationship matching data in Bessell (1979) for K and young disk stars from Leggett (1996) at cooler temperatures (see Fig. 6). The correct form of these relationships at low temperatures is still controversial, although the agreement between empirical measurements and synthetic photometry from models for K is encouraging (e.g. Bessell, Castelli & Plez 1998; Houdashelt, Bell & Sweigart 2000). Synthetic photometry based on model atmospheres would predict hotter temperatures (by K) at , but cooler temperatures (by K at (Bessell et al. 1998; Houdashelt et al. 2000). The - relationship empirically defined by Kirkpatrick et al. (1993) would give temperatures about 75 K higher at . Beyond this, uncertainties could exceed 200 K.
For K we synthesized spectra with the uclsyn code (Smith 1992; Smalley, Smith & Dworetsky 2001), which uses atlas9 atmospheres (Kurucz 1993) incorporating a mixing length theory of convection with , but no overshooting. We “tuned” our atomic line list (no molecules were included) by comparison with a high resolution solar spectral atlas (Kurucz, Furenlid & Brault 1984). The solar spectrum was synthesized at K, , microturbulence, km s-1 (see Castelli, Gratton & Kurucz 1997) and with the chemical abundances of Anders & Grevesse (1989). Atomic values were altered until line EWs in the synthesis matched the solar atlas.
We synthesised spectra for the NGC 2547 targets using and km s-1, blurring the result with a Gaussian that matched the resolution of our spectra (although not the detailed shape of the instrumental profile, which varied slightly between spectra). The model spectra did not match the observations very well unless we reduced the metallicity (Fe, Ca and Al which all have strong neutral lines in the vicinity of the Li I 6708Å doublet) by about 0.25 dex (see for example Fig. 8). Some of this could be due to errors in the scale, but the stars would have to be 300 K hotter for a solar metallicity to provide a reasonable match. Naylor et al. (2002) also noted that there was some evidence for a sub-solar metallicity from a comparison of fits to the and colour-magnitude diagrams. For now, we claim that NGC 2547 probably has a sub-solar metallicity, but this needs confirmation with better quality spectra of solar-type stars. Fixing the metallicity at [M/H], we generated spectra at a grid of Li (N(Li)/N(H)) and points and determined the pEW of the Li I 6708Å feature in the same way as we did for the target spectra. We adopted this approach rather than trying to fit models to every spectrum because: (a) at cooler temperatures we are reliant on pEW curves of growth supplied by other authors (see below); (b) we need to apply a consistent analysis to stars in other clusters where the original spectra are not published; (c) the instrumental profile varied somewhat from fibre to fibre and was not entirely Gaussian. Adopting the sub-solar metallicity resulted in predicted pEWs (at a given Li abundance) that were about 10 per cent larger than for a solar metallicity, because of the reduced influence of the wings of the strong Ca I 6718Å line on the continuum flux around Li I 6708Å.
Synthetic photometry from the atlas9 models (open circles in Fig. 6), upon which we based our spectral syntheses, diverge from empirical - measurements below 4000 K. This is not surprising given that these atmospheres do not include opacity from molecular species such as TiO and H2O which begin to form at these temperatures. They are at least partially included in the nmarcs models, which seem to follow the empirical data better (see Bessell et al. 1998). For K we have used curves of growth relating the pEW of the Li I 6708Å line, and Li abundance presented by Zapatero Osorio et al. (2002 – their Table 5), supplemented by data for pEWs at lower Li abundances (down to (Li)) supplied by Pavlenko & Zapatero Osorio (private communication). These were calculated using synthetic spectra generated from the atmospheric models of Hauschildt, Allard & Baron (1999), incorporating atomic and molecular opacities. Furthermore, the curves of growth were calculated for pEWs measured at a spectral resolution of 1.7Å – not too dissimilar to the data considered here. Unfortunately, apart from the highest Li abundances, the calculations are performed for , which is a little too low for our targets. We have experimented using our atlas9 synthetic spectra at 4000 K and find that increasing to 4.5 at a given Li abundance results in only a 10 per cent lower pEW for (Li) and roughly 10 per cent higher at (Li). This latter result agrees quantitatively with what Zapatero Osorio et al. found but the predicted pEWs from our models are larger: – at 4000 K, and (Li), the atlas9 synthesis predicts a pEW of 668 mÅ whereas Zapatero Osorio et al. give 537 mÅ. Only a small part of this discrepancy is due to our differing resolutions and pEW definitions, the rest is due to the lowering of the continuum by TiO absorption at cooler temperatures (see Fig. 14 in Zapatero Osorio et al.). We choose simply to apply the results of the Zapatero Osorio et al. analysis to our pEWs, recognising that there may be small systematic errors of order 10 per cent in the curves of growth.
The curves of growth and data for NGC 2547 are illustrated in Fig. 7, where values have been transformed to using the relationship defined in Fig. 6. Li abundances for our stars are obtained using bi-cubic spline interpolation. Uncertainties in these abundances have internal and external components. Internal uncertainties are a consequence of uncertain and pEW values. Changes of microturbulence (by 0.5 km s-1) make a comparatively negligible difference to derived Li abundances. A change of pEW by 40mÅ changes (Li) by 0.1-0.3 dex depending on and pEW. The photometry for NGC 2547 has an internal precision of better than 0.04 magnitudes (Naylor et al. 2002), which translates to a uncertainty of K for the stars in our sample. Photometric variability due to starspots may mean this is optimistic, although the narrowness of spread around an isochrone for the single stars (see Fig. 1b) probably means that uncertainties in must be much less than 0.1 magnitude. We conservatively adopt a relative error of K for all our stars. This leads to relative Li abundance errors of about 0.2 dex in the hotter stars, but much less than this for K. The uncertainties in the Li abundances listed in Table 1 result from an individual calculation for each star based on these factors.
External uncertainties arise as a consequence of our assumed scale and from any deficiencies in the adopted atmospheric models and curves of growth. Some idea of the uncertainties in the scale can be gleaned from Fig. 6. It seems that uncertainties remain at about the K level for K, perhaps increasing to K at lower temperatures. This only leads to systematic abundance uncertainties of dex at most. Related to this is any systematic calibration problem with the colours. This will be small for the hotter stars, but could be as large as 0.1 mag for ( K). However, this leads to systematic uncertainties smaller than those discussed above. There is then the remaining systematic uncertainty (for the cooler stars) due to the adoption of the Zapatero Osorio et al. curves of growth and the difficulties of the differing spectral resolutions and adopted . We estimate this could result in pEW predictions for a given abundance being systematically uncertain by around 10 per cent, which leads to a further systematic abundance uncertainty of about 0.2 dex, roughly independent of temperature between 3000 K and 4000 K.
Finally, our curves of growth are for LTE formation of the Li I 6708Å resonance doublet. Calculations presented by Carlsson et al. (1994), Pavlenko et al. (1995) and Pavlenko & Magazzu (1996) concur that the correction is about 0.2 dex (in the sense that the NLTE abundance is smaller) for K and (Li), becomes negligible for (Li) and then decreases to a minimum of dex for K and (Li). At K, both Pavlenko et al. (1995) and Pavlenko & Magazzu (1996) indicate that the NLTE corrections become much smaller. We make no correction to the LTE abundances listed in Table 1.
5.2 Lithium abundances: comparison with other clusters
Comparing our data to those in other clusters at similar, younger and older ages provides further empirical constraints on the amount of Li depletion in the evolutionary models.
-
1.
Young PMS stars in the Sigma Orionis cluster (Zapatero Osorio et al. 2002) and the Taurus-Auriga star forming region (Martín et al. 1994): We choose only those stars classed as “weak-lined” T-Tauri stars, to avoid any possible complications with a veiling continuum from an active accretion disc. The ages of stars in this sample lie in the range 1-8 Myr. The spectral resolution of these observations were about 1.7Å and 0.2-0.7Å respectively.
-
2.
IC 2391 and IC 2602: These clusters are approximately co-eval and have ages (from low-mass isochrone fits) that are slightly older than NGC 2547 by 5-10 Myr (Jeffries & Tolley 1998). A more recent determination of the age via the “Lithium depletion boundary method” (see Barrado y Navascués, Stauffer & Patten 1999 and Sect. 6) yields an age of Myr for IC 2391. Li EWs are given by Randich et al. (1997, 2002) for an X-ray selected sample of low-mass stars in IC 2391 and IC 2602. Stauffer et al. (1989) present Li EWs for a small sample of photometrically selected IC 2391 members. All these data were obtained at higher spectral resolutions (between 0.15 and 0.5Å) than our own. photometry comes from Patten & Simon (1996), Prosser, Randich & Stauffer (1996) or Stauffer et al. (1989). The latter quote Kron colours which are converted into using the formula of Bessell & Weis (1987).
-
3.
The Pleiades: This cluster has an isochronal age of about 100 Myr and an age determined from the lithium depletion boundary of Myr (Stauffer, Schultz & Kirkpatrick 1998). Li EWs for cool Pleiades stars were found in Soderblom et al. (1993); García-López et al. (1994) and Jones et al. (1996). These data were taken at spectral resolutions of between 0.15Å and 0.7Å. photometry for these stars can be found in the Open Cluster Database333The Open Cluster Database, provided by C.F. Prosser and J.R. Stauffer. Accessed at
ftp://cfa-ftp.harvard.edu/pub/stauffer/clusters/ and again, are transformed to . For stars common to these literature sources, we followed the same precedence order described in detail by Randich et al. (2001).
For each dataset we determined LTE Li abundances from the published 6708Å pEWs using methods similar to those described in Section 5.1. for the Pleiades and IC 2391/2602 stars was estimated from the photometry, using the same colour- relation as for NGC 2547. We used for the Pleiades and 0.01 and 0.04 for IC 2391 and IC 2602 respectively (Patten & Simon 1996). The same relationship was not used for the younger PMS stars, where was not available. Instead, we used values quoted in Martín et al. (1994) and Zapatero Osorio et al. (2002), which come from the spectral types and relationships proposed by de Jager & Nieuwenhuijzen (1987) and Bessell (1991) respectively. Whilst there are likely zero point errors of order 100-150 K associated with these choices (see Martín et al. 1994 for discussion), such uncertainties lead only to small Li abundance errors in cooler stars (see Sect. 5.1), which are inconsequential for this paper.
To account for the differing spectral resolutions of the various datasets (and also differing amounts of rotational broadening from star to star), we generated ten (solar metallicity) curves of growth for the Li I 6708Å feature blurred with Gaussians to simulate FWHMs of 0.15Å to 2.7Å and with K and of 4.0 and 4.5. Bicubic spline interpolation was used to find the LTE Li abundance for each star, using the curve of growth most appropriate for the instrumental resolution and rotational broadening ( values are available from the same literature sources as the Li I pEWs). We used the curves of growth for the very young PMS stars and the curves of growth for IC 2391/2602 and the Pleiades.
For K we are forced to use the curves of growth supplied by Zapatero et al. (2002) despite these being strictly appropriate only for the data taken at lower resolutions (or fast rotating stars with km s-1). However, the difference between the predicted pEWs at different resolutions is only significant ( per cent) when the pEWs become smaller than about 0.2Å (corresponding to (Li) at these temperatures). This only affects a very few cool stars in the Pleiades and IC 2391/2602 and for these stars we will have overestimated the Li abundances, because the effect of poorer resolution is to reduce the observed pEW of weaker Li I lines.
6 Discussion
6.1 Comparison with theoretical models


Armed with Li abundances we can compare them with the predictions of theory. In this paper we consider three groups of models with readily available Li depletion factors as a function of and age (D’Antona & Mazzitelli 1997; Siess, Forestini & Dufour 2000; Baraffe et al. 1998, 2002). We assume that the initial Li abundance is similar to that in meteorites and very young T-Tauri stars – (Li) . There is some latitude for uncertainty in this, although the uncertainty is probably less than the systematic abundance errors discussed in Sect. 5.1.
We show the comparisons in the six panels of Fig. 9, where Li abundances are plotted on top of isochrones in the (Li)- plane. Of the systematic abundance errors mentioned in Sect. 5.1, it is likely that only the upward NLTE corrections of dex at around 4500 K and the 0.2 dex curve of growth uncertainties for K are important. A systematic scale uncertainty is less important – and (Li) will change in such a way that points tend to move along the trends defined by the models and the data for K.
The models highlight the sensitivity of predicted Li abundances to various physical parameters and approximations. Figure 9a shows isochrones from the D’Antona & Mazzitelli (1997) models, featuring a grey atmosphere approximation and full spectrum turbulence (FST) model for convection. Figures 9b and c show isochrones from the models described by Baraffe et al. (1998, 2002). These have a detailed atmosphere (including contributions from molecular opacity – Hauschildt et al. 1999) and convective energy transport using mixing length theory (MLT). Figure 9b sets the mixing length parameter to 1.0 pressure scale height, whereas in 9c it is set to 1.9 pressure scale heights for masses above 0.6. The isochrones in Figs. 9d, e and f are from Siess et al. (2000). These use MLT with the mixing length parameter set to 1.6 pressure scale heights. The atmosphere is constructed from “analytic fits” to the predictions of detailed atmosphere models, as a function of , gravity and metallicity. Figure 9d shows the basic models with , Fig. 9e the effect of adding 0.2 pressure scale heights of overshoot at the convective boundaries and Fig. 9f shows the effect of decreasing the metallicity to .
A detailed discussion of the differences between the models is given by Siess et al. (2000) and Baraffe et al. (2002). The most important thing to say about Fig. 9, is that it illustrates that Li abundances should be used as critical tests of these models. The variation in predicted Li abundance is enormous – at 30 Myr and 4500 K, there are several orders of magnitude of difference in the Li-depletion predictions. These differences are much larger than the systematic errors in measuring (Li) and and much more dramatic than predicted differences between isochrones in the Hertzsprung-Russell diagram. The comparison also does not require a precise distance to the cluster.
Following arguments presented by Siess et al. (2000) and Baraffe et al. (2002), we surmise that there are two main effects that drive discrepancies in the predictions of Li depletion by models. Each is important on one side of the “Li-chasm” centered at K: (i) the treatment of convection in stars with where Li depletion can be halted as a result of an expanding radiative core; (ii) the treatment of stellar atmospheres for K, as molecules become prominent. In other words, the detailed treatment of convection is not very important in the lowest mass, fully convective stars and a grey body approximation works reasonably well at higher temperatures.
We see from Fig. 9a that the D’Antona & Mazzitelli (1997) models entirely fail to match observed Li abundances in NGC 2547. The FST convection treatment produces far too much Li depletion for K. The same models give an isochronal age of about Myr (the uncertainty arises mainly from the distance) for NGC 2547 in the vs CMD using the same stars (Naylor et al. 2002), so there is a clear inconsistency. Ventura et al. (1998) and D’Antona, Ventura & Mazzitelli (2000) have suggested that dynamo generated magnetic fields might provide an increase in the temperature gradient required for convective instability, decreasing temperatures at the convection zone base and drastically reducing the predicted Li depletion in solar-type stars (discussed further in Sect. 6.3).
The Baraffe et al. (1998, 2002) models fare better. These models also give isochronal ages in the CMD of 25 to 35 Myr (with the older age favoured by the smaller mixing length model). The models in Fig. 9b do not deplete enough Li at K (even taking into account NLTE corrections), although at slightly cooler temperatures there is a reasonable match to the 30 Myr isochrone. (RX 22A and the possible cluster spectroscopic binary RX 76A have exceptionally high Li abundances and are discussed in Sect. 6.4) Additional Li depletion might be possible if there is extra mixing in the radiative layers beneath the convection zone base. Overshooting is an example of this and comparison between Figs. 9d (without overshooting) and 9e (with moderate overshooting) shows that this could be very important in the hotter stars. Other possibilities, reviewed by Pinsonneault (1997), include slow mixing due to turbulence induced by differential rotation or gravity waves. However, these are likely to act on much longer timescales than the age of NGC 2547 (Chaboyer et al. 1995). Figure 9c shows that additional mixing may not be needed. These models, featuring a larger mixing length parameter for (and which are found to give a much better match to the solar structure), fit the NGC 2547 data reasonably well over the whole range at an age of Myr (given the systematic uncertainties in and (Li), especially the likelihood that the LTE abundances should be increased by 0.2-0.3 dex at 4500 K), with the exception of the high point RX 22A.
The Siess et al. (2000) (Li)- isochrones in Figs. 9d,e,f demonstrate that Li depletion is sensitive to overshoot (see above) and metallicity. Reducing the metallicity should result in less Li depletion at a given because the opacities are lower and convection zone bases cooler in stars with central radiative zones. In addition the metal-poor stars are hotter at a given mass by 100-200 K, which accounts for the majority of the difference between the Li depletion isochrones on the cool side of the “Li-chasm”. The models with and no overshoot have problems at around 3700-4000 K, where they predict that Li should be undetectable in NGC 2547. The models with overshoot make this problem worse. The models are a better match to the data at 4000 K, although RX 22A and RX 76A remain unexplained. Note that all the Siess et al. models have very little evolution of the Li depletion pattern on the hot side of the Li-chasm between 50 and 100 Myr – presumably because the convection zone base has become too cool to burn Li and the star has either reached or is dropping vertically onto the ZAMS in the Hertzsprung-Russell diagram.
In principle the region on the cool side of the Li chasm can also be used to test evolutionary models. Stars show an abrupt depletion of their surface Li when the core becomes hot enough to initiate Li burning – the lithium depletion boundary (LDB). The at which this occurs is a sensitive function of age and an age derived in this way should agree with that from isochronal fits to the low-mass stars in the Hertzsprung-Russell diagram and the amount of Li depletion seen on the hot side of the Li chasm. As we have no Li detections on the cool side of the Li chasm, we can only put lower limits on the LDB age. Figure 9 suggest lower limits to the age of 20 Myr. In fact, because the drop in Li abundance on the cool side of the “Li-chasm” is so sharp and the scale so uncertain, the comparison is best done against bolometric luminosity. This question is examined in much greater detail by Oliveira et al. (2003) using a later 2dF dataset of an even fainter sample of NGC 2547 candidates. They find, using the same set of evolutionary models, that the LDB age is definitely older than 35 Myr, but probably younger than 54 Myr.
6.2 Comparison with other clusters
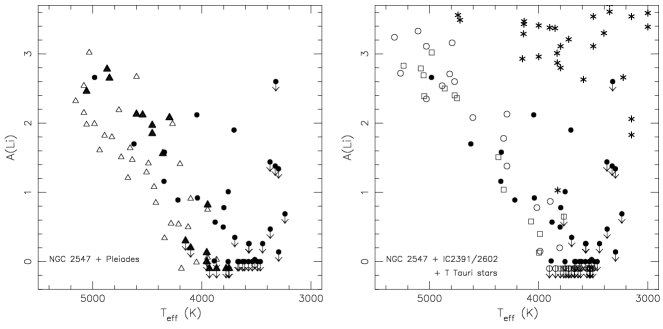
Figure 10 shows the Li abundances in NGC 2547 compared with those in the Pleiades, IC 2391/2602 and a sample of (18) Myr weak-lined T-Tauri stars (see Sect. 5.2). The bulk of the Pleiades stars lie below the NGC 2547 sample by dex and there are detections of Li in NGC 2547 at values slightly cooler than the point at which Li becomes undetectable in the Pleiades. However, it is well known that a relationship exists between measured Li EW (and hence deduced Li abundance) and rotation in the Pleiades and other young clusters (e.g. Soderblom et al. 1993). This is not a one-to-one mapping, but for stars with K it seems that fast rotating stars always have relatively high Li abundances (compared to their siblings at similar ), while slower rotators can have either high or low Li abundances (Randich et al. 1998; Jeffries 2000). It is claimed that this relationship is reduced or disappears for K (García-López et al. 1994; Jones et al. 1996).
Whether this trend truly reflects differences in the Li abundances or rather deficiencies in our understanding of the atmospheres of rapidly rotating and hence magnetically active stars, is still the subject of debate (see Barrado y Navascués et al. 2001; Ford, Jeffries & Smalley 2002). Nevertheless, we see the same phenomenology in our derived Pleiades Li abundances (Fig. 10a) and looking at the rapid rotators only ( km s-1 – though note that some fast rotators could still be present in the rest of the sample if a small allows them to masquerade as slow rotators), it seems they have a nearly indistinguishable Li depletion pattern from NGC 2547 and there may even be rapid rotators with less Li depletion, though the sample size in NGC 2547 is small. Now whilst it is possible that the NGC 2547 sample consists only of similar rapid rotators the weight of evidence is that this is not the case. In Sect. 4 we showed that the NGC 2547 sample is unlikely to be biased with respect to activity and rotation for ( K) and not heavily biased until much lower temperatures. Additionally, Randich et al. (1997, 2001) have shown that cool K and M stars in the similarly aged IC 2391 and IC 2602 clusters have a wide spread in rotation rates, although higher on average than the Pleiades, and Jeffries et al. (2000) have shown that a similar pattern exists in the G and early K stars of NGC 2547. We therefore conclude, that cool, slowly rotating Pleiads have depleted a little more Li than their NGC 2547 counterparts, but fast rotating Pleiads appear to have been depleted by a similar amount.
It is also worth noting that the Pleiades is not unusual in any respect. Li abundances have also been determined in NGC 2516 (Jeffries, James & Thurston 1998), Blanco 1 (Jeffries & James 1999) and M35 (Barrado y Navascués et al. 2001), which have similar ages or are a little older than the Pleiades. Whilst only G and K stars (with K) are studied in these papers, they clearly show (see the comparisons in each of the cited papers) Li abundance patterns very close to that of the Pleiades, with the lower envelope defined by predominantly slowly rotating stars and fast rotating stars having generally higher Li abundances.
Figure 10b empirically demonstrates the effectiveness of PMS Li-depletion during the first Myr of evolution. More than two orders of magnitude of Li-depletion has occurred between the young T-Tauri stars and all three Myr open clusters. The Li-depletion pattern in NGC 2547 is very similar to that in IC 2391/2602. There are a few Li detections in NGC 2547 at K with larger abundances than seen in either of the other clusters, but the numbers of stars involved are small. The IC 2391/2602 samples are also X-ray selected (see Randich et al. 2001) and subject to a very similar level of selection bias as a function of colour. So, the conclusion that the depletion patterns in these three clusters are very similar seems secure. Randich et al. (2001) report that for IC 2602, where they have enough stars in their sample to do the test, that both the scatter and dependence of Li abundance on rotation rate is much reduced compared with the Pleiades. The overall picture we have is that on average, slow rotators in the younger clusters appear to deplete some Li between their ages and that of the Pleiades, whereas the Li abundances of the more rapid rotators remain roughly constant.
Looking at the models in Fig. 9 then such behaviour is difficult to explain if the ages of NGC 2547, IC 2391 and IC 2602 are about 30 Myr. Only the D’Antona & Mazzitelli (1997) model and Siess et al. (2000) model with overshoot predict little depletion between 30 and 100 Myr, but both of these predict far too much Li depletion at 30 Myr to match the observational data (see Sect. 6.1). A better match to the progression of Li depletion would be obtained if these clusters were Myr old. At this age the convection zone base has pushed out to temperatures too low to burn Li and the stars are at or nearly at the ZAMS, so there is no great change in either the Li abundance or the between 50 and 100 Myr. Unfortunately, all the models predict too much Li depletion at an age of 50 Myr apart from the Baraffe et al. (1998) models with a mixing length of 1.0 pressure scale height (Fig. 9b).
6.3 The age scale of young clusters
There are now several techniques for estimating the age of an open cluster. Traditionally, one uses the nuclear turn-off age, which has been estimated as Myr (Jeffries & Tolley 1998) for NGC 2547, 35 Myr for IC 2391/2602 and 70-100 Myr for the Pleiades using models with a small amount of convective core overshoot (e.g. Mermilliod 1981). Isochrone fits to low-mass PMS stars can also give an age estimate. This technique is currently not especially useful in the Pleiades, where only very low-mass stars with quite uncertain colours are still descending towards the ZAMS, but the positions of stars in IC 2391/2602 in optical and near IR CMDs are consistent with ages of 25 Myr (Stauffer et al. 1997; Oliveira et al. 2003; Barrado y Navascués & Stauffer 2003), while ages of 2035 Myr have been derived for NGC 2547 using identical techniques (Naylor et al. 2002; Oliveira et al. 2003).
The low-mass isochronal ages are significantly lower than the LDB ages derived for the younger clusters. Barrado y Navascués et al. (1999) find Myr for IC 2391 and Oliveira et al. (2003) find 35–54 Myr for NGC 2547. For IC 2391 and the Pleiades (with an LDB age of Myr – Stauffer et al. 1998), the LDB ages are also older than the “traditional” nuclear turn-off ages. The latter result may imply that a modest amount of convective core overshoot is required in order to increase the nuclear turn-off ages. The rationale for this conclusion is that the uncertain physics in the very low-mass stellar models (atmospheres, convection theory) has a smaller effect on the determined LDB age than that in the high-mass turn-off stars (convective overshoot, rotation, semi-convection – e.g. Meynet & Maeder 1997). This is not a universal view. Song, Bessell & Zuckerman (2002) argue that Li burning needs to be hastened to match the kinematic and isochronal age in a young, PMS binary system, hence decreasing the LDB ages.
If we assume that the LDB ages are accurate then the discrepancy with the low-mass isochronal ages in NGC 2547 and IC 2391 must be addressed. There are two classes of solution. First, that the colour- relations used to produce isochrones in terms of observable quantities are strongly gravity dependent. So even though the isochrones are calibrated to fit the Pleiades at an age of 100130 Myr, the calibration changes sufficiently at lower gravities to underestimate the age of the younger clusters. This seems unlikely because (i) the gravities do not change very significantly ( dex) between these ages (ii) the current model atmospheres do not predict any great change in the colour- relation over this age and mass range (iii) ages from various optical and near-IR CMDs agree. A more interesting possibility is that the evolutionary models for the stars used to define the PMS isochronal ages are not correct.
The Li abundances we have derived in this paper offer support for this second point of view. Both the Baraffe (with mixing length of 1.9 pressure scale heights) et al. (1998, 2002) and Siess et al. (2000, without overshoot) models do a reasonable job of fitting the Li data at or around the PMS isochronal age of Myr, albeit with some obvious exceptions (see Sect. 6.4). But neither of these models also predicts the very small amount of depletion seen between the ages of NGC 2547, IC 2391/2602 and the Pleiades. All of the models we have considered suggest that strong Li depletion continues until an age of Myr, supporting the LDB ages.
Both rotation and internal magnetic fields are capable of altering the structure and Li depletion in low-mass stars and both are physically well motivated: it is well known that young PMS stars are magnetically active, have starspots and can be rapidly rotating. These effects are explored in some detail by Oliveira et al. (2003). Here we only note that modelling of these phenomena is at an early stage. Pinsonneault et al. (1998) observationally demonstrate that rapid rotators lie 0.1 mag (in ) above their slower rotating siblings in a CMD (as a result of having a lower at the same mass). An isochronal age would therefore be understimated, but only by about 5 Myr for stars in NGC 2547. Mendes et al. (1999) have shown that such rapid rotation also has a negligible effect on the (Li)- isochrones at Myr.
Stauffer et al. (2003) point out that the spectral energy distributions of young low-mass stars can be considerably altered by starspots (caused by surface magnetic field – see below). Potentially, this is a threat to the security of ages determined from fitting isochrones in CMDs. However, we have calibrated our colour- relationship using the Pleiades as a template, which has similar levels of chromospheric and coronal magnetic activity to NGC 2547 (Jeffries & Tolley 1998; Jeffries et al. 2000). In any case, Stauffer et al. also show that vs CMDs are likely to be least affected by this phenomenon and that the Pleiades adequately defines a ZAMS in this CMD.
The structural effects of dynamo-generated B-fields may be more significant. Preliminary calculations by D’Antona et al. (2000) have shown that quite plausible B-fields could decrease the of a 0.95 PMS star by as much as 500 K. Such an extreme deviation is enough to place a ZAMS star on a 30 Myr isochrone – thus an older cluster could look much younger when the age is determined from low-mass isochrones. As mentioned in Sect. 6.1, the presence of B-field could also significantly reduce the amount of Li depletion at a given ; an older cluster would then also appear much younger if interpreting the Li depletion of stars on the hot side of the Li-chasm using evolutionary models with no B-field. At present there are no detailed published studies of the effects of rapid rotation and B-fields on the LDB ages, though they are likely to small (Burke & Pinsonneault 2000; F. D’Antona – private communication).
6.4 Anomalously lithium rich pre main sequence stars
In this paper we have identified RX 22A and also perhaps RX 76A as objects which have suffered considerably less Li depletion than their siblings with similar masses. RX 22A is classified as a photometric binary and has a RV in agreement with the cluster mean. RX 76A is a photometric binary with an anomalous RV. One interpretation of these facts is that neither is actually a member of NGC 2547. A more interesting possibility is that both are binary systems and that for some reason their binarity has resulted in less Li depletion. We note that IC 2391, the Pleiades and even older clusters such as the Hyades possess similar examples of anomalously Li-rich cool stars (Thorburn et al. 1993; Barrado y Navascués & Stauffer 1996, 2003; Oppenheimer et al. 1997).
In older clusters these Li-rich stars have been established as short period binary systems. It is hypothesised that they suffer less Li depletion because tidal locking suppresses additional (non-convective) mixing caused by differential rotation (e.g. Zahn 1994; Ryan & Deliyannis 1995). In the younger clusters this hardly seems a likely explanation. The non-standard mixing mechanisms are probably not very important during PMS evolution. If it can be established that the anomalous stars seen in NGC 2547, IC 2391 and the Pleiades are indeed short period binary members of these clusters, as opposed to say very young interlopers444At least in the case of the two anomalously Li-rich low mass Pleiades candidates, it seems that they are too bright to be cluster binaries and may in fact be interlopers from a very young stellar association – Oppenheimer et al. 1997., this would instead strongly argue for a mechanism which inhibits PMS Li depletion in close binary systems and which may also be responsible for the lack of Li depletion in the anomalous binary systems of the older clusters. Such a mechanism could be linked to either rotation or magnetic fields (as discussed in Sect. 6.3), because PMS binary systems that are tidally locked, will tend to rotate faster than their single counterparts.
7 Summary
Starting with X-ray selected candidate low-mass ( ) members of NGC 2547, we have produced a filtered list of stars which have photometry, spectral indices and radial velocities consistent with cluster membership. In Sect. 4 we showed that this list is unlikely to be complete or uncontaminated and provide estimates of the size of these problems.
We have calculated LTE Li abundances for the members of NGC 2547 and made a thorough estimate of the likely random and systematic errors involved in these estimates. The Li abundances have been compared with theoretical evolutionary models and with other published observations of Li abundances in younger and older clusters and associations.
-
1.
We find that some models (specifically those of Baraffe et al. (2002) featuring a mixing length of 1.9 pressure scale heights for and those of Siess et al. (2000) with no convective overshoot) provide a reasonable match to the Li depletion pattern for K at the ages of 2035 Myr which are indicated by low-mass isochrone fits in the Hertzsprung-Russell diagram using the same models. Other models predict far more Li depletion than seen.
-
2.
However, the models that give a reasonable description of the Li depletion pattern in NGC 2547 also predict significant Li depletion between the ages of 30 and Myr, disagreeing with observed (Li)- patterns in the young NGC 2547 and IC 2391/2602 clusters compared with the older Pleiades cluster.
-
3.
The observed progression of Li depletion in these clusters rather suggests that NGC 2547 and IC 2391/2602 have ages Myr, which agrees with estimates based on the location of the “Lithium Depletion Boundary” seen in even cooler, lower mass stars in these clusters (Barrado y Navascués et al. 1999; Barrado y Navascués & Stauffer 2003; Oliveira et al. 2003).
-
4.
The ages estimated from these techniques, and also from the nuclear turn-off in high-mass stars, are affected differently by the physical ingredients that go into the models. We speculate that the addition of rotation or magnetic fields, both of which are capable of altering the internal structure of low-mass PMS stars and which are physically well motivated, may provide a reconciliation of all the age estimates. Detailed theoretical models and isochrones that incorporate these effects are called for.
-
5.
We have identified a couple of anomalously Li-rich, low-mass stars in NGC 2547 that have similarities to objects found in other young clusters. They may both be short period binary systems in NGC 2547, although more observational proof is required. If so, this may point to some mechanism that inhibits the normal process of PMS Li depletion in tidally locked binary systems.
Acknowledgements
We thank the director and staff of the Anglo-Australian Observatory and especially Russell Cannon who performed the 2dF observations. Thanks are also due to Nigel Hambly who provided accurate astrometry for our targets. Computational work was performed on the Keele node of the PPARC funded Starlink network. JMO acknowledges the financial support of the UK Particle Physics and Astronomy Research Council.
References
- [\citefmtAllen & Strom1995] Allen L. E., Strom K. M., 1995, AJ, 109, 1379
- [\citefmtAllen1995] Allen L. E., 1995, PhD thesis, University of Massachusetts, Amherst
- [\citefmtAnders & Grevesse1989] Anders E., Grevesse N., 1989, Geochimica et Cosmochimica Acta, 53, 197
- [\citefmtBailey, Glazebrook & Bridges2002] Bailey J., Glazebrook K., Bridges T., 2002, Technical Report, Anglo Australian Observatory
- [\citefmtBaraffe et al.1998] Baraffe I., Chabrier G., Allard F., Hauschildt P. H., 1998, A&A, 337, 403
- [\citefmtBaraffe et al.2002] Baraffe I., Chabrier G., Allard F., Hauschildt P. H., 2002, A&A, 382, 563
- [\citefmtBarrado y Navascués & Stauffer1996] Barrado y Navascués D., Stauffer J. R., 1996, A&A, 310, 879
- [\citefmtBarrado y Navascués & Stauffer2003] Barrado y Navascués D., Stauffer J. R., 2003, in Martín E. L., ed, IAU Symposium 211: Brown Dwarfs. ASP, San Francisco
- [\citefmtBarrado y Navascués, Deliyannis & Stauffer2001] Barrado y Navascués D., Deliyannis C. P., Stauffer J. R., 2001, ApJ, 549, 452
- [\citefmtBarrado y Navascués et al.2001] Barrado y Navascués D., García Lopez R. J., Severino G., Gomez M. T., 2001, A&A, 371, 652
- [\citefmtBarrado y Navascués, Stauffer & Patten1999] Barrado y Navascués D., Stauffer J. R., Patten B. M., 1999, ApJ, 522, L53
- [\citefmtBessell & Weis1987] Bessell M. S., Weis E. W., 1987, PASP, 99, 642
- [\citefmtBessell, Castelli & Plez1998] Bessell M. S., Castelli F., Plez B., 1998, A&A, 333, 231
- [\citefmtBessell1979] Bessell M., 1979, PASP, 91, 589
- [\citefmtBessell1990] Bessell M. S., 1990, A&AS, 83, 357
- [\citefmtBessell1991] Bessell M., 1991, AJ, 101, 662
- [\citefmtBriceño et al.1998] Briceño C., Hartmann L., J. S., Martín E., 1998, AJ, 115, 2074
- [\citefmtBurke & Pinsonneault2000] Burke C. J., Pinsonneault M. H., 2000, AAS, 197, 41.10
- [\citefmtCarlsson et al.1994] Carlsson M., Rutten R., Bruls J. H. M. J., Shchukina N. G., 1994, A&A, 288, 860
- [\citefmtCastelli, Gratton & Kurucz1997] Castelli F., Gratton R. G., Kurucz R. L., 1997, A&A, 318, 841
- [\citefmtCastelli1999] Castelli F., 1999, A&A, 346, 564
- [\citefmtChaboyer, Demarque & Pinsonneault1995] Chaboyer B., Demarque P., Pinsonneault M. H., 1995, ApJ, 441, 876
- [\citefmtChabrier & Baraffe1997] Chabrier G., Baraffe I., 1997, A&A, 327, 1039
- [\citefmtClariá1982] Clariá J. J., 1982, A&AS, 47, 323
- [\citefmtD’Antona, Ventura & Mazzitelli2000] D’Antona F., Ventura P., Mazzitelli I., 2000, ApJ, 543, L77
- [\citefmtde Jager & Nieuwenhuijzen1987] de Jager C., Nieuwenhuijzen H., 1987, A&A, 177, 217
- [\citefmtFord, Jeffries & Smalley2002] Ford A., Jeffries R. D., Smalley B., 2002, A&A, 391, 253
- [\citefmtFord et al.2001] Ford A., Jeffries R. D., James D. J., Barnes J. R., 2001, A&A, 369, 871
- [\citefmtGarcía-López, Rebolo & Martín1994] García-López R. J., Rebolo R., Martín E. L., 1994, A&A, 282, 518
- [\citefmtHambly et al.2001] Hambly N. C., Davenhall A. C., Irwin M. J., MacGillivray H. T., 2001, MNRAS, 326, 1315
- [\citefmtHauschildt, Allard & Baron1999] Hauschildt P. H., Allard F., Baron E., 1999, ApJ, 512, 377
- [\citefmtHoudashelt, Bell & Sweigart2000] Houdashelt M. L., Bell R. A., Sweigart A. V., 2000, AJ, 119, 1448
- [\citefmtJeffries & James1999] Jeffries R. D., James D. J., 1999, ApJ, 511, 218
- [\citefmtJeffries & Tolley1998] Jeffries R. D., Tolley A. J., 1998, MNRAS, 300, 331
- [\citefmtJeffries, James & Thurston1998] Jeffries R. D., James D. J., Thurston M. R., 1998, MNRAS, 300, 550
- [\citefmtJeffries et al.2002] Jeffries R. D., Totten E. J., Harmer S., Deliyannis C. P., 2002, MNRAS, 336, 1109
- [\citefmtJeffries, Totten & James2000] Jeffries R. D., Totten E. J., James D. J., 2000, MNRAS, 316, 950
- [\citefmtJeffries1995] Jeffries R. D., 1995, MNRAS, 273, 559
- [\citefmtJeffries2000] Jeffries R. D., 2000, in R. Pallavicini G. Micela S. S., ed, Stellar clusters and associations: Convection, rotation and dynamos. ASP Conference Series, Vol. 198, San Francisco, p. 245
- [\citefmtJones, Fischer & Soderblom1999] Jones B. F., Fischer D., Soderblom D. R., 1999, AJ, 117, 330
- [\citefmtJones et al.1996] Jones B. F., Shetrone M., Fischer D., Soderblom D. R., 1996, AJ, 112, 186
- [\citefmtKirkpatrick, Henry & McCarthy1991] Kirkpatrick J. D., Henry T. J. J., McCarthy D. W. J., 1991, ApJS, 77, 417
- [\citefmtKirkpatrick et al.1993] Kirkpatrick D., Kelly D., Rieke G., Liebert J., Allard F., Wehrse R., 1993, ApJ, 402, 643
- [\citefmtKurucz, Furenlid & Brault1984] Kurucz R. L., Furenlid I., Brault J., 1984, Solar flux atlas from 296 to 1300nm. National Solar Observatory
- [\citefmtKurucz1993] Kurucz R. L., 1993, Technical Report, ATLAS9 Stellar Atmosphere Programs, Smithsonian Astrophysical Observatory, Kurucz CD-ROM No. 13
- [\citefmtLeggett et al.1996] Leggett S. K., Allard F., Berriman G., Dahn C. C., Hauschildt P. H., 1996, ApJS, 104, 117
- [\citefmtLeggett1992] Leggett S. K., 1992, ApJS, 82, 351
- [\citefmtLewis et al.2002] Lewis I. J. et al., 2002, MNRAS, 333, 279
- [\citefmtMartín et al.1994] Martín E. L., Rebolo R., Magazzù A., Pavlenko Y. V., 1994, A&A, 282, 503
- [\citefmtMendes, D’Antona & Mazzitelli1999] Mendes L. T. S., D’Antona F., Mazzitelli L., 1999, A&A, 341, 174
- [\citefmtMermilliod1981] Mermilliod J. C., 1981, A&A, 97, 235
- [\citefmtMeynet & Maeder1997] Meynet G., Maeder A., 1997, A&A, 321, 465
- [\citefmtMontes et al.1997] Montes D., Martín E. L., Fernández-Figueroa M. J., Cornide M., De Castro E., 1997, A&AS, 123, 473
- [\citefmtNaylor et al.2002] Naylor T., Totten E. J., Jeffries R. D., Pozzo M., Devey C. R., Thompson S. A., 2002, MNRAS, 335, 291
- [\citefmtNaylor1998] Naylor T., 1998, MNRAS, 296, 339
- [\citefmtOliveira et al.2003] Oliveira J. M., Jeffries R. D., Devey C. R., Barrado y Navascués D., Naylor T., Stauffer J. R., Totten E. J., 2003, MNRAS, in press
- [\citefmtOppenheimer et al.1997] Oppenheimer B. R., Basri G., Nakajima T., Kulkarni S. R., 1997, AJ, 113, 296
- [\citefmtPatten & Simon1996] Patten B. M., Simon T., 1996, ApJS, 106, 489
- [\citefmtPavlenko & Magazzu1996] Pavlenko Y., Magazzu A., 1996, A&A, 311, 961
- [\citefmtPavlenko et al.1995] Pavlenko Y. V., Rebolo R., Martín E. L., García López R. J., 1995, A&A, 303, 807
- [\citefmtPinsonneault et al.1998] Pinsonneault M. H., Stauffer J. R., Soderblom D. R., King J. R., Hanson R. B., 1998, ApJ, 504, 170
- [\citefmtPinsonneault1997] Pinsonneault M. H., 1997, ARA&A, 35, 557
- [\citefmtProsser, Randich & Stauffer1996] Prosser C. F., Randich S., Stauffer J. R., 1996, AJ, 112, 649
- [\citefmtRandich et al.1997] Randich S., Aharpour N., Pallavicini R., Prosser C. F., Stauffer J. R., 1997, A&A, 323, 86
- [\citefmtRandich et al.1998] Randich S., Martín E. L., Garcia-Lopez R. J., Pallavicini R., 1998, A&A, 333, 591
- [\citefmtRandich et al.2001] Randich S., Pallavicini R., Meola G., Stauffer J. R., Balachandran S., 2001, A&A, 372, 862
- [\citefmtRyan & Deliyannis1995] Ryan S. G., Deliyannis C. P., 1995, ApJ, 453, 819
- [\citefmtSiess, Dufour & Forestini2000] Siess L., Dufour E., Forestini M., 2000, A&A, 358, 593
- [\citefmtSmalley, Smith & Dworetsky2001] Smalley B., Smith K. C., Dworetsky M. M., 2001, UCLSYN v3.1 incorporating BINSYN and TELSYN, Keele University
- [\citefmtSmith1992] Smith K. C., 1992, PhD thesis, University of London
- [\citefmtSoderblom et al.1993] Soderblom D. R., Jones B. F., Balachandran S., Stauffer J. R., Duncan D. K., Fedele S. B., Hudon J. D., 1993, AJ, 106, 1059
- [\citefmtSong, Bessell & Zuckerman2002] Song I., Bessell M. S., Zuckerman B., 2002, ApJ, 581, L43
- [\citefmtStauffer & Hartmann1986] Stauffer J. R., Hartmann L. W., 1986, ApJS, 61, 531
- [\citefmtStauffer et al.1989] Stauffer J. R., Hartmann L. W., Jones B. F., McNamara B. R., 1989, ApJ, 342, 285
- [\citefmtStauffer et al.1997] Stauffer J. R., Balachandran S. C., Krishnamurthi A., Pinsonneault M. H., Terndrup D. M., Stern R. A., 1997, ApJ, 475, 604
- [\citefmtStauffer et al.2003] Stauffer J. R., Jones B. F., Backman D., Hartmann L. W., Barrado y Navascués D., Pinsonneault M. H., Terndrup D. M., Muench A. A., 2003, AJ, submitted
- [\citefmtStauffer, Schultz & Kirkpatrick1998] Stauffer J. R., Schultz G., Kirkpatrick J. D., 1998, ApJ, 499, L199
- [\citefmtThorburn et al.1993] Thorburn J. A., Hobbs L. M., Deliyannis C. P., Pinsonneault M. H., 1993, ApJ, 415, 150
- [\citefmtVentura et al.1998] Ventura P., Zeppieri A., Mazzitelli I., D’Antona F., 1998, A&A, 331, 1011
- [\citefmtZahn1994] Zahn J. P., 1994, A&A, 288, 829
- [\citefmtZapatero Osorio et al.2002] Zapatero Osorio M. R., Béjar V. J. S., Pavlenko Y., Rebolo R., Allende Prieto C., Martín E. L., García López R. J., 2002, A&A, 384, 937