ON THE ORIGIN OF LYMAN- BLOBS AT HIGH REDSHIFT: KINEMATIC EVIDENCE FOR A HYPERWIND GALAXY AT = 3.1 11affiliation: Based on data collected at the Subaru Telescope, which is operated by the National Astronomical Observatory of Japan.
Abstract
We present deep optical spectroscopy of an extended Ly emission-line blob located in an over-dense region at redshift ; ‘blob 1’ of Steidel et al. (2000). The origin of such Ly blobs has been debated for some time; two of the most plausible models are (1) that it comes from a dust-enshrouded, extreme starburst galaxy with a large-scale galactic outflow (superwind/hyperwind) or (2) that it is the cooling radiation of proto-galaxies in dark matter halos. Examination of the kinematic properties of the Ly emission-line gas should allow us to determine its nature. With this motivation, we performed optical spectroscopy of ‘blob 1’ using the Subaru Telescope, and found that its kinematic properties can be well explained in terms of superwind activity.
1 INTRODUCTION
Steidel et al. (2000, hereafter S00) found two unusual Ly emission-line objects in an over-dense region at redshift . These two objects are known as Ly emission-line blobs (hereafter LABs). These two LABs comprise the most remarkable class of high-redshift objects observed to date because they are strikingly larger than typical high-redshift Ly emitters. Their observational properties are summarized below 111 We adopt a flat-universe cosmology, with , , and where 100 km s-1 Mpc-1), throughout this Letter. In this cosmology, the angular size distance to blob 1 at is Gpc, so that 1″ corresponds to 7.63 kpc. Note also that its luminosity distance is Gpc. : (1)the observed Ly luminosities are ergs s-1; (2) they are resolved and elongated; (3) their sizes are 100 kpc, (4) the observed line widths (full width at zero intensity; see Fig. 8 of S00) are km s-1, and (5) they are not associated with a strong radio continuum source such as a powerful radio galaxy or a quasar; i.e., there is no evidence for an active galactic nucleus (AGN).
Two models have been suggested for the emissions from these LABs. The first is that they are superwinds/hyperwinds driven by the initial starbursts in forming galaxies; all of the above observational properties, as well as the observed frequency of LABs, can be explained in terms of this superwind model (Taniguchi & Shioya 2000; hereafter TS00). TS00 also discuss the evolutionary link between dust-enshrouded (or dusty) submillimeter sources and LABs; they argue that the central starburst region in a forming elliptical galaxy would be enshrouded by large amounts of gas and dust. This superwind model predicts that the LABs should be bright in the rest-frame far-infrared, and thus at observed submillimeter wavelengths. Indeed, strong submillimeter continuum emission has been detected in the blob 1 (hereafter LAB1; Chapman et al. 2001). Taniguchi, Shioya, & Kakazu (2001; hereafter TSK01) investigated the spectral energy distribution (SED) of LAB1, and found it quite similar to that of Arp 220. They also found that its infrared luminosity exceeds , and therefore proposed that LAB1 is a hyperluminous infrared galaxy or a hyperwind galaxy at .
The second model suggests that LABs are cooling radiation from proto-galaxies within dark matter halos (Haiman, Spaans, & Quataert 2000; Fardal et al. 2001; Fabian et al. 1986; Hu 1992). Standard cold dark matter models predict that a large number of dark matter halos collapse at high redshift; proto-galaxies in the halos can emit significant Ly fluxes through collisional excitation of hydrogen. The expected properties of these Ly-emitting halos are also consistent with the observed linear sizes, velocity widths, and Ly fluxes of the LABs. However, it is uncertain how much far-infrared and submillimeter continuum emission should be emitted in this model, because little is known about the dust content and its spatial distribution in such dark matter halos.
One of the key ways to discriminate between these two models is to investigate the kinematical properties of the Ly-emitting nebula in detail; the mechanism of the velocity broadening of the emission lines is different in the two models. S00 presented optical spectroscopy of the two LABs and showed that the Ly nebulae have peculiar velocity fields with FWHM (full width at half maximum) up to 2000 km s-1. However, since their slits did not cover the central regions of the LABs, their results could not be used to distinguish between the two models. In this Letter, we present new, deep optical spectroscopy for LAB1 using the Subaru Telescope.
2 OBSERVATIONS
Spectroscopic observations were made with the FOCAS (Kashikawa et al. 2002) on the Subaru Telescope (Kaifu 1998) on 17 June 2002 (UT). The seeing was 05 during the observations. To observe both the line and continuum emission properties of LAB1, we aligned the 10-wide slit so as to observe both the Ly peak of LAB1 and the source found by S00 at a position angle of 134∘. The 300B grism together with a Y47 filter allowed us to obtain an optical spectrum between 4700 Å and 9400 Å with a spectroscopic resolution of 18 Å (the instrumental FWHM) at 5577 Å, or 970 km s-1. The pixel sampling was 04 in angle (4-pixel binning) and 5.65 Å in wavelength (4-pixel binning). We obtained seven spectra, each one based on an exposure of 1800 s. An offset of 20 along the slit was applied between adjacent exposures; i.e., we operated in a nodding mode with 2″ offsets. The total exposure time was 3.5 h. Data reduction was made in a standard manner (bias subtraction, flat fielding, optical distortion corrections, wavelength calibration, and flux caribration) using specialized software developed by the FOCAS team (Yoshida et al. 2000) as well as IRAF.
We imaged the source on the same night in band using the direct imaging mode of FOCAS. We obtained two -band images with a CCD binning of pixels ( arcsec2 per binned pixel). Each exposure time was 300 s, so that the total integration was 600 s. The sky conditions were photometric. Bias subtraction, flat-fielding, and optical distortion corrections were applied using the FOCAS software and IRAF. The flux calibration was made using flux conversion data obtained on another photometric night with the same observing settings.
3 RESULTS
3.1 Kinematical Properties
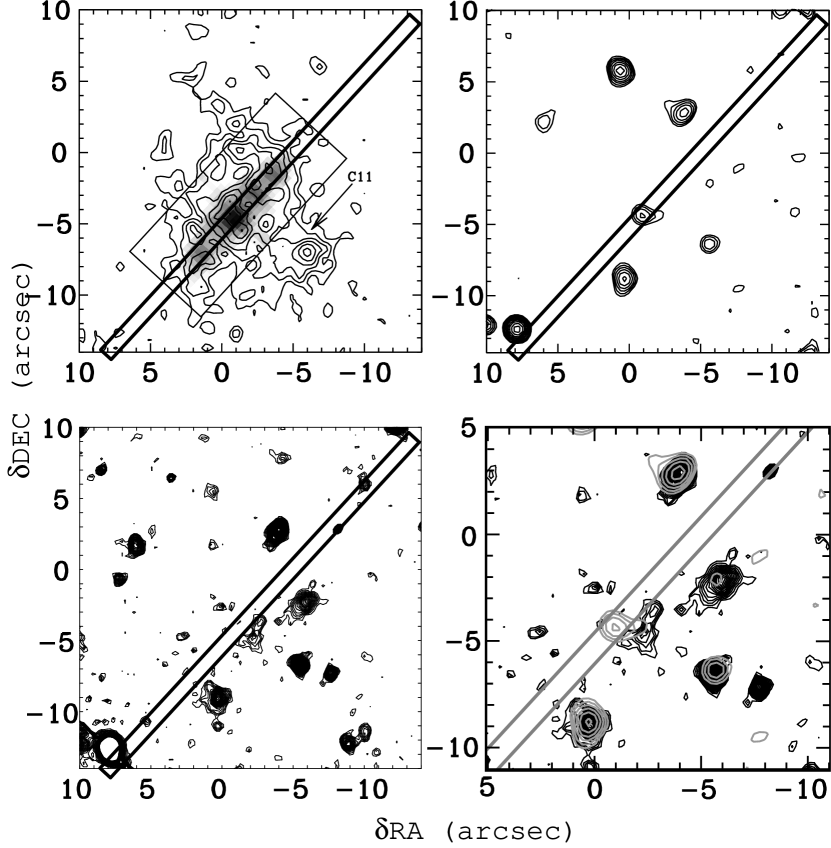
In Fig. 1, we show the slit position for our optical spectroscopy overlaid on (1) Ly, (2) -band, (3) -band images, and (4) a zoomed -band image overlaid on the -band image. Ly and -band images are taken from S00. The - and -band images were registered by utilizing the positions of four brighter objects present in both images; the positional error of registration is estimated to be ”. We also show our Ly spectrogram as a greyscale in the first panel. Our slit covers the peak of Ly emission and the source.
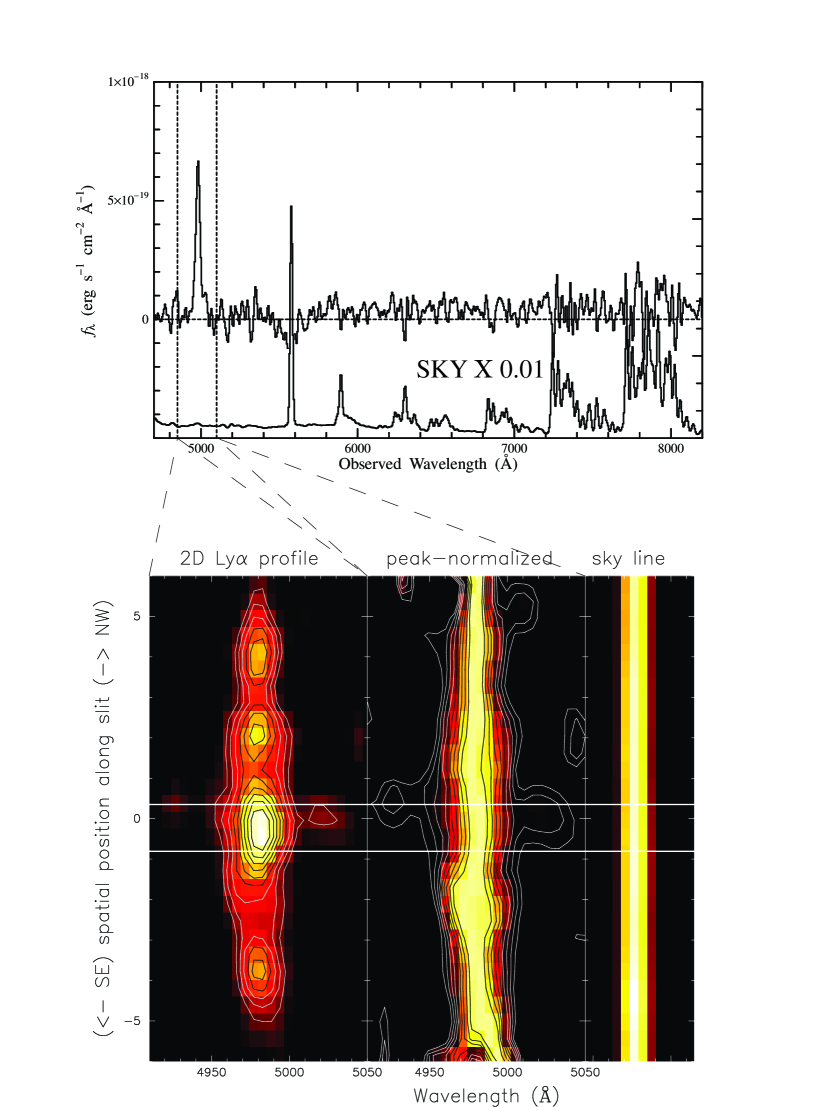
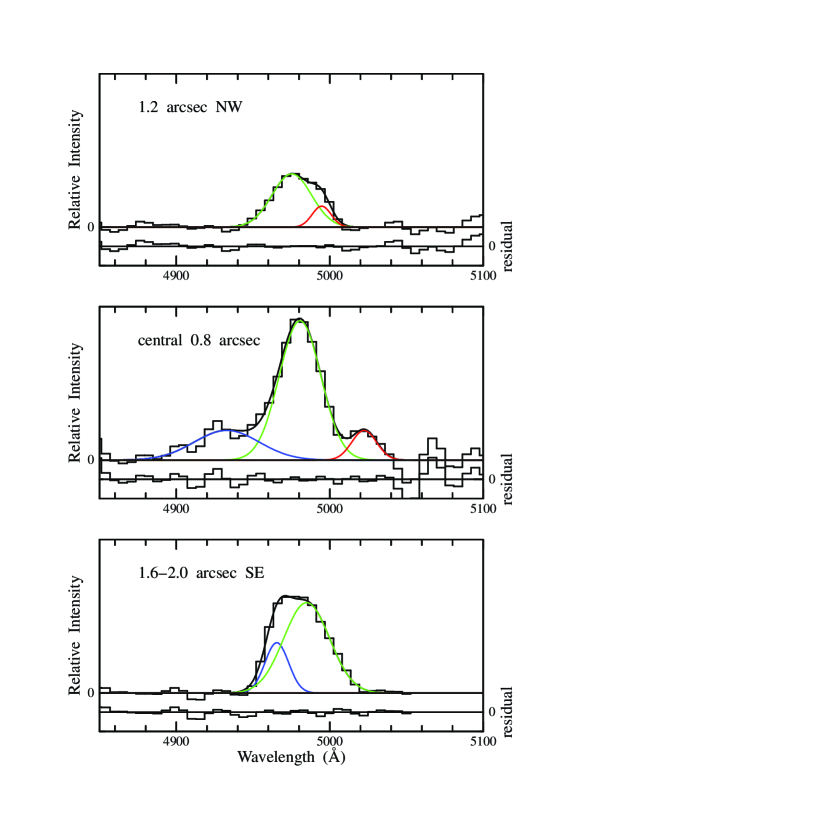
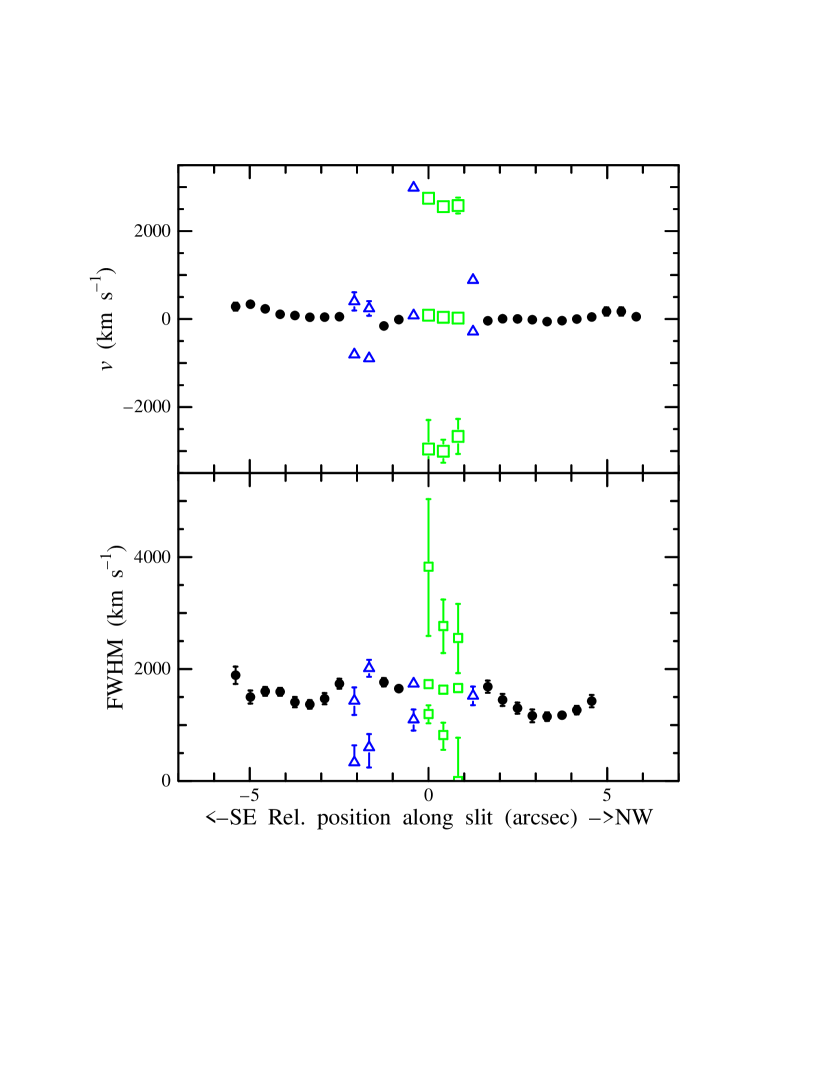
In Fig. 2, we show a one-dimensional spectrum over a wider wavelength range (4700Å– 8200Å) extracted from the central 12 of the source. To show the detailed kinematical properties of the nebula, we also show our Ly spectrogram together with the peak-normalized spectrogram. In the latter panel, the intensity peak of the profiles is normalized to be unity along the spatial direction, so that it is possible to see interesting velocity structures at fainter intensity levels. The peak-normalized sky emission line at 5577 Å is also shown at the same intensity scale as that of the peak-normalized Ly spectrogram to illustrate the instrumental velocity resolution. It can be seen from this Figure that the inner part of the nebula (″ from the center) is clearly resolved in velocity. We have performed single and/or multiple Gaussian component fittings to measure the kinematical properties of the Ly nebula. In the central 2″ region, we find the following three emission-line components (see also Fig. 3): (1) The main component is centered at Å, giving a redshift of . Its FWHM222All the line widths in this Letter are corrected for the instrumental resolution of 970 km s-1 FWHM. is km s-1. (2) An additional redshifted component is seen; its peak velocity is shifted by 2500 km s-1 with respect to that of the main component. Its FWHM is measured to be km s-1. (3) A blueshifted component is also seen; its peak velocity is shifted by 3000 km s-1 with respect to that of the main component. Its FWHM ranges from 2500 km s-1 to 3500 km s-1. The presence of this blueshifted component makes the global Ly emission-line profile blueward asymmetric (see middle panel of Fig. 3). Double-peaked profiles are found both at 1-2″ NW of the center and at 15 - 25 SE of the center. Although the double peaks are not clearly separated in the spectrogram, the profiles seem to be well deconvolved by the double Gaussian components (Fig. 3) since the total line width is wider than those of the outer regions (Fig. 2) and the profiles show a flat-topped shape (Fig. 3). The velocity difference between the two peaks is 1200 km s-1. Outside these double-peaked profile regions (at radial distances from the center - 5”), we see that the emission line profile is singly peaked on either side. The FWHM in these regions ranges from 1000 km s-1 to 1500 km s-1. We find no evidence for any global rotation within ”. All these observed kinematical properties are summarized in Fig. 4.
3.2 The -band Counterpart of the Source
Our observations detect a probable -band counterpart of the -band source. S00 found the source ( 21.2) close to the peak of both the Ly emission line and the submillimeter peak, and thus suggested that it was probably the host galaxy of LAB1. Although they could not detect its -band counterpart (), we have detected a probable -band counterpart of LAB1 (hereafter the source) at for the first time. The source is found at 1″ south west of the source, not at the same position. It has an amorphous shape without any obvious light concentration, and appears to surround the source along its south-western side. Although such a distinctive shape suggests a physical association between the and sources, its origin is unknown, since our slit was not placed on the source due to its slight displacement (Fig. 1).
4 DISCUSSION
One of possible origin of LAB1 is scattering of the nuclear Ly photons within the halo. However, since the Ly line is a resonance line and a multiple scattering process is required to reproduce such a huge nebula ( kpc) in the Case B condition (Osterbrock 1989), the Ly flux would be expected to be reduced significantly by dust grains within the halo (e.g., Ferland & Netzer 1979). In the case of LAB1, there are some lines of evidence for the presence of a significant amount of dust, such as the extremely high FIR luminosity ( ), most probably originating from warm dust (TSK01), and the red color of the source () which is magnitude redder than that of a nearby Lyman break galaxy, C11, at the same redshift (see Fig. 7 in S00). Therefore, scattering of a nuclear source does not seem a likely explanation for the observations of LAB1.
Another possible explanation of the Ly emission from the LABs is the cooling radiation from proto-galaxies within dark matter halos (Haiman et al. 2000; Fardal et al. 2001; Fabian et al. 1986; Hu 1992). This model may also explain the observed velocity widths as well as the linear sizes and the Ly fluxes of LABs (Haiman et al. 2000). The wider velocity widths of the Ly lines from proto-galaxies are attributed to the frequency shift of the Ly emission required for the photons to escape from the optically thick core of a Voigt profile (i.e., diffusion). Therefore, this model predicts that only simple line profiles should be observed over the halo. However, our optical spectroscopy reveals a complex, structured velocity field. These observed properties do not have a straightforward explanation in the cooling-radiation model. Since the superwind model does not have difficulty in explaining these properties (see below), our observations favor the superwind model over the cooling radiation model.
Possible alternative ideas for explaining LAB1 are an inflow of halo material around the young, forming galaxy or an outflow of the superwind associated with star-formation activity of the host galaxy. Detection of double-peaked profiles on large scales around the central source ( - 2”, or 7.6 - 15 kpc) provides good constraints on possible models, since this type of profile requires an inflowing or outflowing shell (or cone) of material around the galaxy. The presence of such an expanding shell or cone is a natural consequence of superwind activity (e.g., Heckman et al. 1990), whereas the inflow of halo matter would not necessarily take the form of a large-scale shell. Other pieces of kinematical evidence also favor the model in which the outflow is associated with a superwind. The overall blueward asymmetric profile in the central region is often taken to be a signature of superwind galaxies (e.g., Taniguchi et al. 1988; Heckman, Armus, & Miley 1990). The presence of both the blueshifted (3000 km s-1) and the redshifted (2000 km s-1) components in the central region can be attributed to the expanding motion of the shocked shell (see TS00). The main component is considered to be the central starburst region, which has the systemic velocity of the host galaxy. Although the double-peaked profiles disappear further out (”, or kpc), this can be understood if the peaks’ velocity separation is narrower than our velocity resolution (i.e., 970 km s-1). This would come about if the wind had a slower speed in the outer regions due to momentum loss as it interacted with the ambient halo gas. Therefore the superwind/starburst scenario for the LAB1 looks more plausible than other models, from a kinematical point of view. In this model, the velocity gradient within the nebula (the velocity splitting) would help the Ly photons generated by the local shock within the nebula to escape, although a fraction of the photons would still be absorbed by dust during their scattering within the nebula. Although the superwind model suggests that emission-line morphology should appear either as a bi-conical nebula or as a pair of superbubbles (e.g., Heckman et al. 1990), the LAB1 appears chaotic probably due to a strong interaction between the superwind and ambient gaseous matter around the host galaxy.
In conclusion, all the kinematical properties of LAB1 can be explained by the superwind model proposed by TS00. Together with the submillimetric evidence presented by TSK01, we conclude that LAB1 is one of the largest superwind (or hyperwind; TSK01) galaxies in the early universe observed to date. Such superwind phenomena are a natural consequence of the intense starbursts that are expected to occur in forming galaxies (Larson 1974; Arimoto & Yoshii 1987). Indeed, recent optical spectroscopy has found possible superwind galaxies beyond (Dawson et al. 2002; Ajiki et al. 2002). Since the surface brightness of LABs is very low, future deep imaging surveys with narrow-band filters will be necessary to detect larger numbers of LABs in the early universe.
References
- (1) Ajiki, M., et al. 2002, ApJ, 576, L25
- (2) Arimoto, N., & Yoshii, Y. 1987, A & A, 173, 23
- (3) Chapman, S. C., Lewis, G. F., Scott, D., Richards, E., Borys, C., Steidel, C. C., Adelberger, K. L., & Shapley, A. E. 2001, ApJ, 548, L17
- (4) Dawson, S., Spinrad, H., Stern, D., Dey, A., van Breugel, W., De Vries, W., & Reuland, M. 2002, ApJ, 570, 92
- (5) Fabian, A. C., Arnaud, K. A., Nulsen, P. E. J., & Mushotzky, R. F. 1986, ApJ, 305, 9
- (6) Fardal, M. A., Katz, N., Gardner, J. P., Hernquist, L., Weinberg, D. H., & Davé, R. 2001, ApJ, in press (astro-ph/0007205)
- (7) Ferland, G., & Netzer, H. 1979, ApJ, 229, 274
- (8) Haiman, Z., Spaans, M., & Quataert, E. 2000, ApJ, 537, L5
- (9) Heckman, T. M., Armus, L., & Miley, G. K. 1990, ApJS, 74, 833
- (10) Hu, E. M. 1992, ApJ, 391, 608
- (11) Kaifu, N. 1998, Proc. SPIE, 3352, 14
- (12) Kashikawa, N., et al. 2002, PASJ, 54, 819
- (13) Larson, R. B. 1974, MNRAS, 169, 229
- (14) Osterbrock, D. E., 1989, in Astrophysics of Gaseous Nebulae and Active Galactic Nuclei, section 4, University Science Books (Mill Valley, California)
- (15) Steidel, C. S., Adelberger, K. L., Shapley, A. E., Pettini, M., Dickinson, M., & Giavalisco, M. 2000, ApJ, 532, 170 (S00)
- (16) Taniguchi, Y., Kawara, K., Nishida, M., Tamura, S., & Nishida, M. T. 1988, AJ, 95, 1378
- (17) Taniguchi, Y., & Shioya, Y. 2000, ApJ, 532, L13 (TS00)
- (18) Taniguchi, Y., Shioya, Y., & Kakazu, Y. 2001, ApJ, 562, L15 (TSK01)
- (19) Yoshida, M., et al. 2000, SPIE, 4009, 240