Measuring Global Galaxy Metallicities Using Emission Line Equivalent Widths
Abstract
We develop a prescription for estimating the interstellar medium oxygen abundances of distant star-forming galaxies using the ratio formed from the equivalent widths of the [O II] , [O III] and H nebular emission lines. This approach essentially identical to the widely-used method of Pagel et al. (1979). Using data from three spectroscopic surveys of nearby galaxies, we conclude that the emission line equivalent width ratios are a good substitute for emission line flux ratios in galaxies with active star formation. The RMS dispersion between and the reddening-corrected values is dex. This dispersion is comparable to the emission-line measurement uncertainties for distant galaxies in many spectroscopic galaxy surveys, and is smaller than the uncertainties of dex inherent in strong-line metallicity calibrations. Because equivalent width ratios are, to first order, insentitive to interstellar reddening, emission line equivalent width ratios may actually be superior to flux ratios when reddening corrections are not available. The method presented here is likely to be most useful for statistically estimating the mean metallicities for large samples of galaxies to trace their chemical properties as a function of redshift or environment. The approach developed here is used in a companion paper (Kobulnicky et al. 2003) to measure the metallicities of star-forming galaxies at in the Deep Extragalactic Evolutionary Probe spectroscopic survey of the Groth Strip.
1 Introduction
Abundances of chemical elements in galaxies are commonly measured using the emission lines emitted by astrophysical nebulae (e.g., see Osterbrock 1989). Recombination lines of hydrogen (e.g., the Balmer series) or helium and forbidden lines of singly and doubly ionized carbon, nitrogen, oxygen, neon, and sulfur are among the strongest observable lines in the visible and ultraviolet spectrum. The relative strengths of each emission line, combined with some knowledge of the temperature and density of the nebulae, provide information about the relative and absolute abundances of each ion. Chemical analyses of individual nebulae have been used to test nucleosynthesis models of stars, the chemical evolutionary history of galaxies, and nucleosynthesis in the big bang (review by Aller 1990; Pagel 1998). Even integrated spectra of entire galaxies may be used to estimate the overall degree of chemical enrichment of a galaxy (Kobulnicky, Kennicutt, & Pizagno 1998).
Observational techniques sometimes permit the relative fluxes of emission lines from galaxies to be measured with a high degree of precision. However, in the current generation of wide-field galaxy surveys on multi-object spectrographs, flux calibration is frequently problematic due to unfavorable observing conditions or instrumental effects such as a variation in system response over the field of view. For such surveys, it is still desirable to extract chemical information from the data, where possible. In this paper we explore the possibility of estimating mean gas-phase oxygen abundances for galaxies based the equivalent widths (rather than fluxes) of strong Balmer recombination line and forbidden [O II] and [O III] emission lines. Our approach is to develop the method from basic principles, and to test and empirically calibrate it using three spectroscopic galaxy datasets, and in the end compare the oxygen abundances derived from traditional line fluxes and flux ratios to results using only the equivalent widths and equivalent width ratios. We also assess the applicability of this method to measuring abundances for a particular set of intermediate-redshift galaxies observed as part of the Deep Extragalactic Evolutionary Probe (DEEP) spectroscopic survey in the Groth Strip (DGSS) presented in a companion paper, Kobulnicky et al. (2003; Ke03).
2 Gas-phase Oxygen Abundance Measurements from Emission Lines
Osterbrock (1989) reviews the standard techniques for measuring chemical abundances in astrophysical nebulae from the fluxes and flux ratios of nebular emission lines. The most direct and reliable techniques involve measuring a suite of temperature-sensitive and density-sensitive line ratios to determine the physical conditions of the plasma. In the absence of high signal-to-noise data measuring temperature–sensitive line ratios (e.g., [O III] 4363/[O III] 5007), the default diagnostic for measuring the oxygen abundance of ionized nebulae has become the ratio of strong oxygen emission lines (Pagel et al. 1979). Subsequently, many authors have developed formulations relating this strong line ratio to the gas-phase oxygen abundance (e.g., Edmunds & Pagel 1984; McCall, Rybski & Shields 1985; Dopita & Evans 1986; McGaugh 1991). Other authors (Kobulnicky, Kennicutt, & Pizagno 1998; KKP) have shown that this approach is valid even when applied to galaxies as a whole. Even when the signal to noise ratio of these lines is as low as 8:1 or when a spectroscopic observation encompasses a range of metallicities and ionization conditions within a galaxy, this ratio provides a rough, but reliable, estimate of the mean gas-phase oxygen abundance when used in conjunction with the appropriate calibration relating to . At this signal-to noise ratio, the associated uncertainty on the oxygen abundance due to line measurement error is typically comparable to the uncertainty due to the calibration of the vs. O/H relationship: dex. In this paper we show that the uncertainty introduced by substituting emission line equivalent widths is less than these other sources of uncertainty, and thereby establish a new method for measuring interstellar medium oxygen abundances.
3 Justification of Equivalent Width Method
The original method involves line ratios, so we consider the effects of using equivalent width ratios in place of flux ratios. For generality, we include the effects of reddening in the discussion. First, the equivalent width can be written as
| (1) |
where represents the line flux and is the underlying continuum flux. The fluxes do not need to be calibrated, since the calibration affects both quantities equally. The dereddened, calibrated flux value for a line, , or continuum, , is given by
| (2) |
where is the logarithmic attenuation at and is a function describing the reddening curve, according to the prescription of Seaton (1979). Combining these leads to a general line ratio formulation of
| (3) |
where we group all the continuum and reddening terms into the factor . Note that the continuum will be attenuated by an amount characterized by , and reddened by (presumably) the same reddening law. Thus,
| (4) |
The factor contains two unknowns, the ratio of the dereddened continuum fluxes, which depends on the underlying stellar population, and the difference in the attentuation of the emitting gas and the continuum light. Note that values of can range from 0 to quite large for individual HII regions, although large values are severely deweighted in the average over an entire galaxy. Typical derived values are in the range 0–1, with a median value around 0.3 (McCall et al. 1985; Oloffson 1995). Values of can be estimated from the relation from Seaton. For in a typical range of 0–0.2, 0–0.3. We would expect some correlation of and , and also we expect () 0.
Let us now consider the specific line ratios of interest for the method. The first is . For the purposes of reddening, we adopt the wavelength of the stronger [O III] 5007 line. The value of in this case is
| (5) |
Due to the proximity of these emission lines in wavelength, we expect the flux ratios of the underlying stellar population to be very close to unity. Similarly, for realistic , the reddening factor will be 1 to 0.92. Thus, for this line ratio, , and we will ignore it in further discussion. To a very good approximation,
| (6) |
The second ratio, , is more problematic; for these lines,
| (7) |
In principle, we could estimate from a detailed spectral analysis of the flux-calibrated, integrated stellar spectrum and Balmer line ratios, but for faint, galaxies with redshifts we will have neither the signal-to-noise nor access to the H line in order to do this. In practice, we need to adopt a constant average value of .
Galaxy light tends to be dominated by A main sequence and G and K giants (e.g., Morgan & Mayall 1957; Pritchet 1977; Kobulnicky & Gebhardt 2000), and assuming an underlying stellar spectrum composed of a linear combination of these two spectral types implies that the dereddened flux ratio of the continuum ranges from 1 for late-B stars to 0.4 for mid-G giants to 0.2 for early-K giants (although galaxies whose 3727 flux is dominated by K stars is unlikely to have any line emission from star formation). Examining the spectra in Kennicutt (1992b) shows the 3727-to-4861 ratio of the continuum fluxes in galaxies with obvious emission lines ranging from 0.4–1.0; if these were dereddened the range would shift upwards and might possibly narrow somewhat.
On the other hand, the reddening correction ranges from 1 to 1.8 for realistic values of and , with a typical likely difference giving a reddening factor of 1.2. Combining the two factors leads to an expected value of . This average value for differs from unity by less than 0.1 dex.
We find the measure can now be expressed
| (8) |
Not surprisingly, the measured using equivalent widths and a constant value of will be most in error when [OII] dominates O[III].
The final line ratio of interest is the ionization parameter, and it is easy to see that
| (9) |
This ratio is probably the easiest means to empirically estimate an average value for .
4 Data Selection and Analysis
The thesis of this paper is that even when the line flux ratio is not available, a corresponding ratio of equivalent widths can still provide an estimate of the oxygen abundance. This ratio of equivalent widths is given by
| (10) |
At the simplest level, contains neither corrections for interstellar reddening nor absorption by atmospheres of the stellar population. To test the suitability of in place of we compiled three sets of spatially-integrated (i.e., global) emission-line spectra of nearby galaxies. The first set consists of 16 objects from the 55-object spectroscopic galaxy atlas of Kennicutt (1992a,b; K92) plus six additional emission-line objects from KKP. We refer to this sample as the K92+ sample. The K92+ spectra are produced by drifting a longslit across each galaxy and have spectral resolutions of 5-7 Å (K92) and 3 Å (KKP). The 16 K92 galaxies in our subsample are the strongest emission-line objects where global metallicity measurements are possible. The full set of K92 galaxies represents a range of morphological types from Sa to Im, but it includes only the bright galaxies of each type. As a second local sample, we culled 98 objects with measurable , [O III] and [O II] emission lines from the 198-galaxy Nearby Field Galaxy Survey (Jansen et al. 2000a,b; NFGS). The full NFGS sample is selected from the CfA redshift catalog (Huchra et al. 1983). These spectra have a resolution of 6 Å and include a larger range of luminosity () and surface brightnesses than K92+ while spanning morphological types. The K92+ objects have a higher fraction of star-forming galaxies (objects with strong emission lines) compared to the NFGS sample. As a third local sample, we used emission-line selected galaxies in the Kitt Peak National Observatory Spectroscopic Survey (KISS; Salzer et al. 2000). KISS is a large-area objective prism survey of local () galaxies selected by strong emission, and thus, preferentially contains objects with active star formation. From a list of 519 KISS galaxies with high-quality slit spectroscopy (Melbourne & Salzer 2002), we removed 396 galaxies lacking [O II] measurements, leaving 123 galaxies. This analysis makes use of KISS line strengths obtained during followup longslit spectroscopy with 5–8 Å resolution (Salzer et al. 2003).
In summary, the 22 K92+, 98 NFGS, and 123 KISS galaxies were selected from their larger parent samples because of strong emission lines suitable for nebular metallicity measurement. Following KKP, we chose only galaxies with detectable [O II]3727, [O III]4959, [O III]5007, and H emission lines. Only galaxies where all four emission lines were measured with a S/N of 8:1 or greater were retained. This selection criterion preferentially includes galaxies with high equivalent width lines, but it also includes galaxies with low equivalent width lines where the continuum is smooth and well-measured.
For each galaxy in the K92+ sample we measured the emission-line fluxes and equivalent widths manually using Gaussian fits. For the NFGS and KISS surveys, we adopted the published emission-line fluxes and equivalent widths. Dereddened emission-line fluxes were computed for all three samples by comparing the observed ratios to theoretical ratios.111 = 2.75-2.86 for wide temperature range, e.g., (Hummer & Storey 1987). Here we assumed fixed electron temperature of 12,000 K so that = 2.85. The line fluxes are dereddened using the law of Seaton (1979) as parameterized by Howarth (1983) and as described in Kobulnicky & Skillman (1996). We did not correct the Balmer emission lines for underlying stellar absorption. The effects of Balmer absorption by the stellar population are discussed in Section 5.3
While the K92+KKP sample consists entirely of starforming galaxies, several low-level AGN are known to exist in the NFGS. These four objects are not included in the our subsample. The 123 KISS galaxies included here do not contain any AGN, as they were selected to be conventional starforming galaxies based on analysis high-quality spectroscopic observations (Salzer 2003). In any case, the presence of AGN among the samples would not have a significant bearing on the results of this paper since we are interested in comparing observable properties of emission lines rather than deriving physical quantities such as density or metallicity which are sensitive to the nature of the ionizing source.
5 Analysis of Emission Line Quantities
5.1 [O II] and [O III] Equivalent Widths versus Fluxes
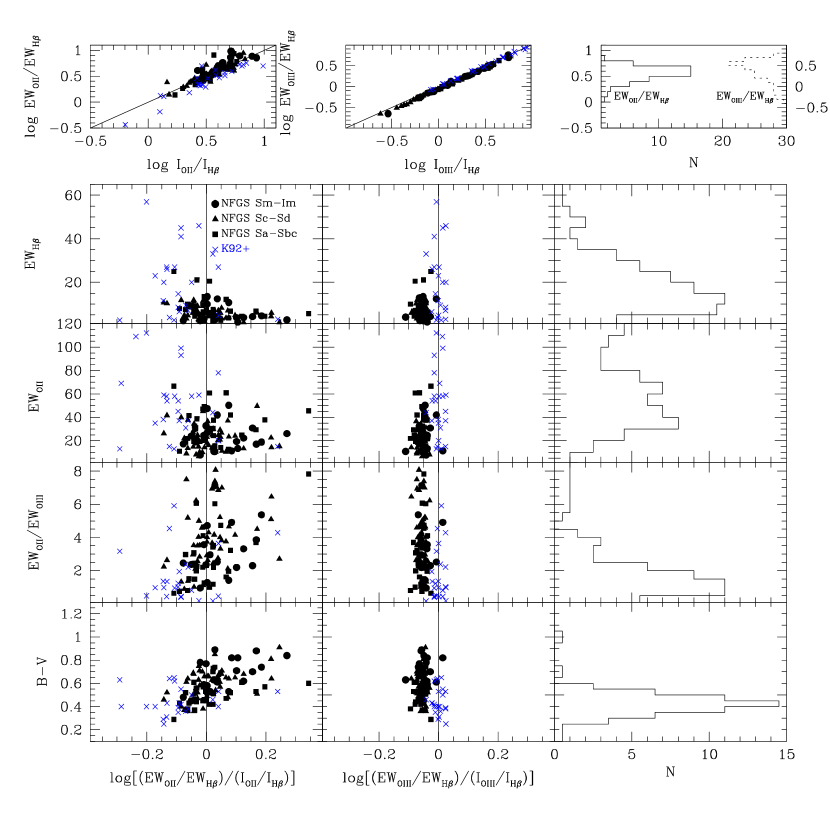
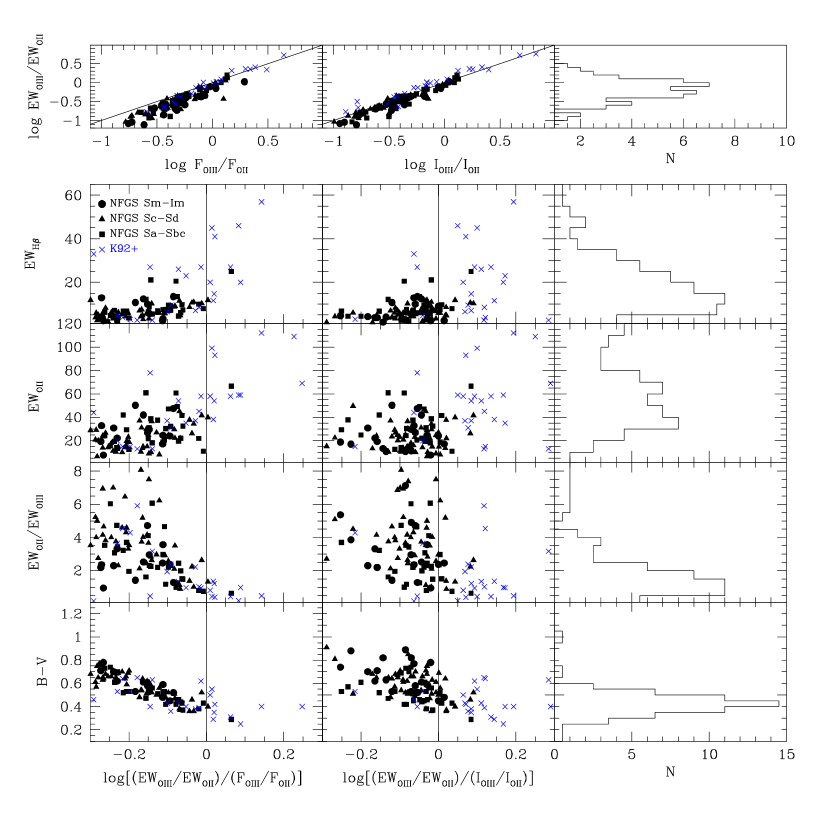
Figure 1 compares the oxygen and hydrogen emission-line flux ratios to equivalent width ratios as a function of emission line strength and color for the K92+ and NFGS samples. Solid symbols denote the Nearby Field Galaxy Sample while crosses denote the K92+ galaxies. The upper left panel compares the ratio of dereddened [O II] to fluxes, , versus the ratio of [O II] to equivalent widths, . A solid line marks the 1-to-1 correspondence. There is a good correlation between the two quantities, indicating that strong-line equivalent widths are a good surrogate for dereddened line fluxes. The RMS deviation from the 1-to-1 correspondence is dex for the combined K92+NFGS samples. Similarly, the panel at top center shows the versus ratios and indicates that equivalent widths are a good surrogate for dereddened line fluxes. The RMS deviation from the 1-to-1 correspondence is dex for the combined K92+NFGS samples. The panel at upper right shows the histogram of and distributions for the DGSS galaxies (Ke03) galaxies. The ratios observed in Groth Strip galaxies fall within the range where the relations between flux ratios and EW ratios are well-behaved, suggesting that the approach could be used to estimate oxygen abundances of this sample.
The lower panels of Figure 1 show residuals from the 1-to-1 line as a function of EW and galaxy color. The K92+ galaxies have very small residuals in the middle column which compares [O III] to ratios. The excellent correspondence of [O III] fluxes to equivalent widths may be easily understood since the [O III] 4959,5007 lines are close in wavelength to H so that neither changes in the underlying galaxy continuum light nor relative extinction will alter this ratio. The K92+ and NFGS galaxies have small, slightly-systematic residuals in the left column which compares the [O II] to ratios. We attribute the larger residuals in the [O II] comparison in the left column to uncertainties in the reddening correction, and possibly a systematic overestimate of the reddening correction to the [O II] 3727 flux due to low spectral resolution in the K92 atlas. The NFGS, by comparison, shows systematic trends in the residuals with B-V color, with and with . The galaxies with the largest residuals are also the reddest. They have very low equivalent widths, and they have the largest ratios. Such objects may be understood to be the galaxies with the lowest rates of star formation per unit luminosity and the oldest stellar populations. For these objects, the line ratios become increasingly uncertain as the line strengths become weak and the (uncorrected) effect of underlying Balmer absorption by the stellar population begins to be a dominant source of scatter.
The right column of histograms in Figure 1 shows the distribution of colors and EW ratios for galaxies in the DGSS selected for chemical analysis in our companion paper (Kobulnicky et al. 2003). The selected DGSS galaxies have strong emission lines and tend to be most similar to the K92+ and KISS galaxies, having blue colors, small ratios, and large in comparison the NFGS. These characteristics suggest that, like the K92+ and NGFS galaxies with these properties, the DGSS galaxies will exhibit a close correlation between the emission line equivalent width and flux ratios, facilitating chemical abundance analysis.
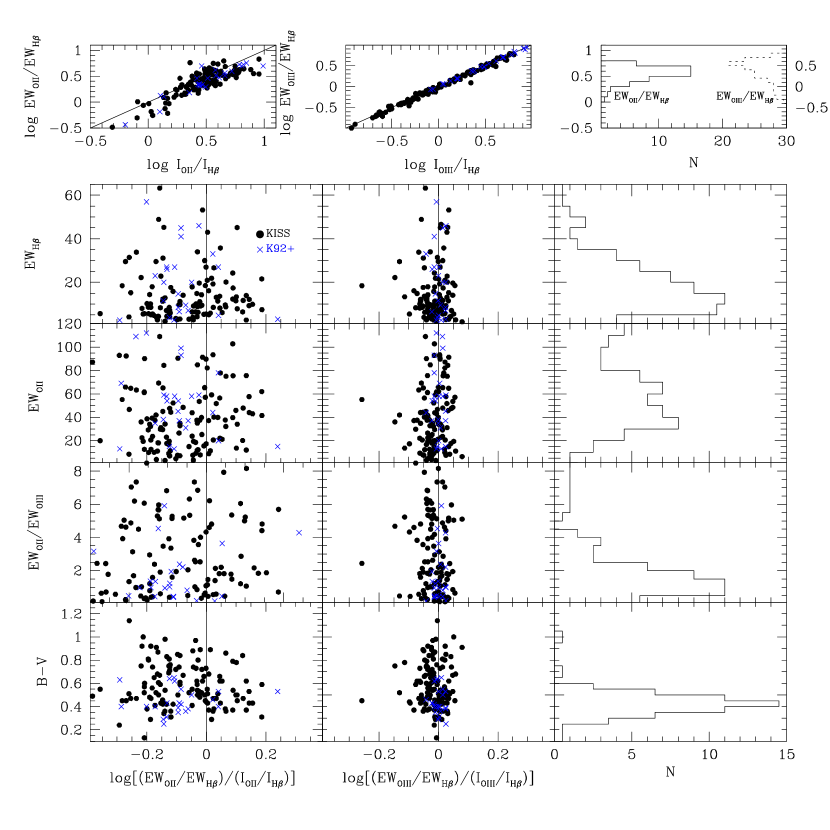
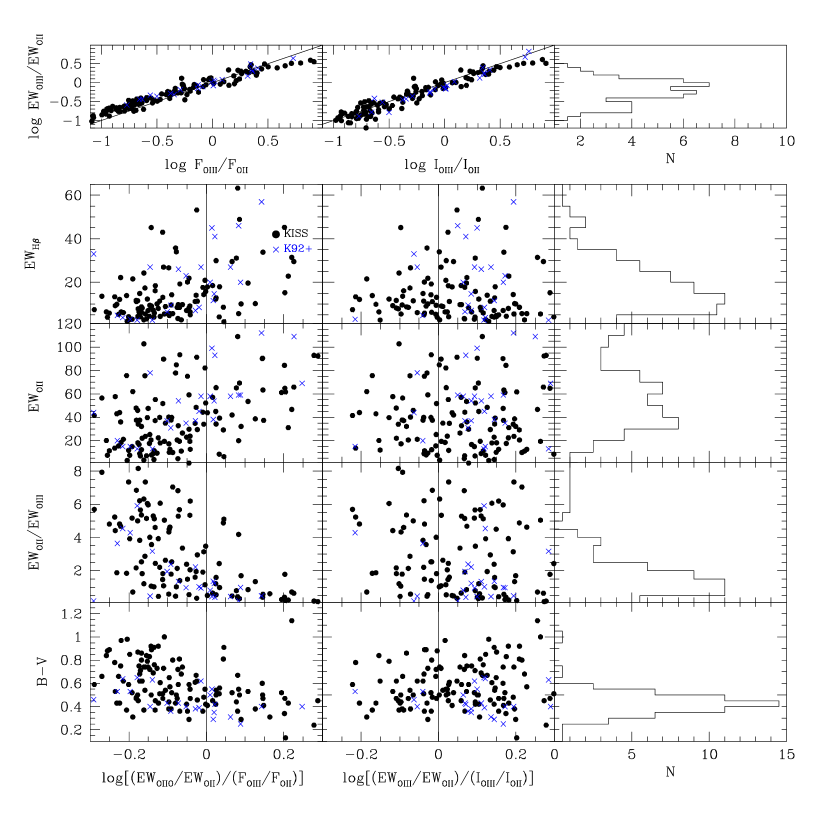
In Figure 2 shows the same comparison as Figure 1 but for the KISS and K92+ samples. The upper left panel compares the ratio of dereddened [O II] to fluxes, , versus the ratio of [O II] to equivalent widths, . A solid line marks the 1-to-1 correspondence. There is a good correlation between the two quantities, indicating that strong-line equivalent widths are a good surrogate for dereddened line fluxes. The RMS deviation from the 1-to-1 correspondence is dex for the combined K92+KISS samples. Similarly, the panel at top center shows the versus ratios and indicates that equivalent widths are a good surrogate for dereddened line fluxes. The RMS deviation from the 1-to-1 correspondence is dex for the combined K92+KISS samples.
The lower panels of Figure 2 show residuals from the 1-to-1 line as a function of EW and galaxy color. The middle column shows very small and non-systematic residuals, indicating excellent correspondence between [O III] equivalent widths and fluxes for all KISS galaxy colors and line ratios. However, the left column shows significant dispersion of 0.15 dex between and . The residuals are not correlated with galaxy color or EW, suggesting that measurement errors and/or uncertainties in the reddening correction are responsible for the dispersion.
The right column of histograms in Figure 2 shows the distribution of colors and EW ratios for galaxies in the DGSS selected for chemical analysis in our companion paper (Kobulnicky et al. 2003).
5.2 EW versus
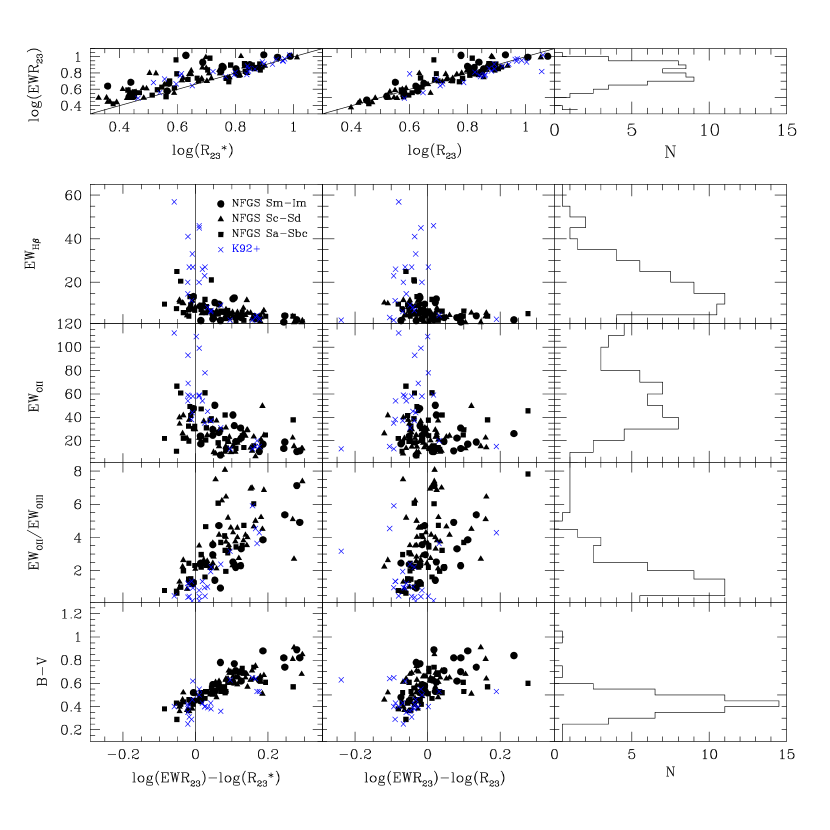
A more direct test of the suitability of emission line equivalent width ratios for abundance analysis can be achieved by comparing the quantity EW with for the same three local galaxy samples. Figure 3 (upper left panel) shows the comparison between and for K92+ and NFGS galaxies constructed from the raw fluxes and equivalent widths. denotes the value of without correcting line fluxes for reddening. A solid line illustrates a 1-to-1 correspondence. The lower rows in the left column of Figure 3 show residuals from the 1-to-1 correspondence as a function of , , and galaxy color. The correlation between and is strong but has considerable scatter. Formally, the RMS dispersion from the 1-to-1 relation is dex for the combined K92+NFGS samples.
The correlation is strongest for objects in the K92+ sample and for objects with large values of . Deviations from 1-to-1 are greatest for objects in the NFGS sample which have low , high ratios, and red colors. These systematic residuals may be understood as a consequence of the lack of corrections for extinction. [O II] 3727 is significantly affected by extinction compared to the H and [O III] lines. The measured [O II] flux is a lower limit to the true unextincted intensity whereas the measured [O II] equivalent width should be unaffected by extinction provided that the extinction toward the gas and stars are similar222See Calzetti, Kinney, & Storchi-Bergmann (1994) for evidence that this assumption is sometimes invalid.. The strong systematic residuals with color seen in the lower left panel is a most likely a consequence uncorrected extinction, since redder galaxies are often those with greater extinction.
In the middle column of Figure 3 we show a similar comparison of with , where has been corrected for reddening using the theoretical Balmer decrement. Here the correlation is much stronger. The strong correlation between galaxy color and residuals seen in left column is now mostly gone, suggesting that the [O II] line fluxes have been successfully corrected for reddening. The RMS dispersion from the 1-to-1 relation is dex for the combined K92+NFGS samples. The ratio of equivalent widths is a good substitute for the reddening-corrected ratio. Use of equivalent widths may even be superior to line ratios if the reddening corrections are not known, as in the case of galaxies for which the H/H ratio is not available (typically true for redshifts ). In the presence of reddening, the EW of the [O II] line is unchanged because both the continuum and line flux are suppressed in equal amounts if the reddening toward stars and gas is similar. The residuals in the lower panels of column 2 are mostly symmetric about zero, with the largest scatter again occurring for objects with very low values of EW(H). Some of the systematic residuals are probably also caused by varying continuum shapes, especially among the NFGS, which affect the equivalent widths of the [O II] lines in a systematic manner which is realted to galaxy color and the average age of the stellar population. In any case, the RMS of 0.07 dex in will often be on the same order as, or even less than the statistical measurement uncertainties on the strong line equivalent widths in high-redshift spectroscopic surveys, even when the signal-to-noise of the emission line equivalent widths is as low as 8:1.
The right column of Figure 3 shows the distribution of the 66 galaxies from the DGSS selected for chemical analysis in Kobulnicky et al. (2003). The range of , , , and among the sample galaxies covers the range over which the local calibration galaxies show a well-behaved relationship between and . The good correlation (=0.08 dex) between and in the local samples provides confidence that measuring rough ISM oxygen abundances in large surveys of distant galaxies is feasible even when only equivalent widths are recorded.
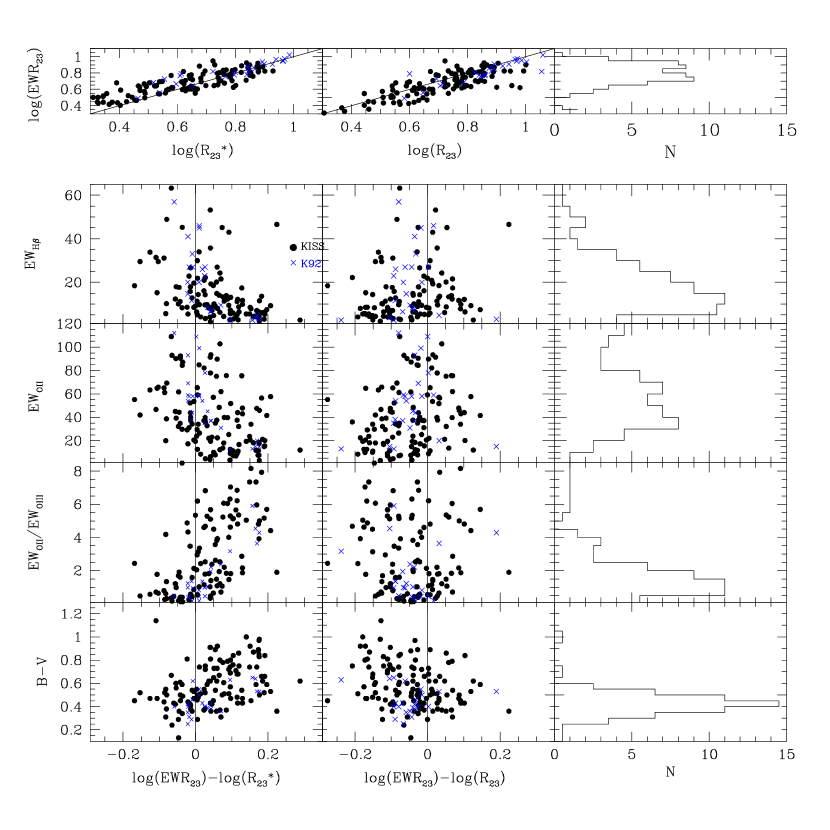
Figure 4 shows a comparison of EW with and for the K92+ and KISS galaxy samples. The left column shows the comparison of EW with and the associated residuals from the 1-to-1 correspondence. There is a good correlation between EW with in the upper left panel. The RMS dispersion from the 1-to-1 relation is dex for the combined K92+KISS samples. The left column shows systematic residuals with galaxy color and line strength indicating that reddening is significant for some galaxies. The center column shows the comparison of EW with and the associated residuals as a function of EW and galaxy color. The residuals for the KISS galaxies are now slightly smaller and much less systematic after application of a reddening correction. The RMS dispersion from the 1-to-1 relation is dex for the combined K92+KISS samples. The residuals are larger than than for the K92+ and NFGS objects, but the KISS galaxies do not show the systematics with galaxy color or EW which the NFGS galaxies exhibit. The increased scatter in may be traced to the increased scatter in the [O II] lines seen in Figure 2. The lack of systematic residuals is probably a result of the relative homogeneity of the KISS sample. KISS galaxies have stronger emission lines and do no include the diversity of more quiescent galaxies with older stellar populations found in the NFGS.
5.2.1 Effects of Stellar Balmer Absorption
Ideally, the quantity from which a metallicity is derived should be computed using an line strength which has been corrected for both interstellar reddening and absorption by atmospheres of the underlying stellar population. In practice, the amount of underlying absorption is difficult to measure even under ideal circumstances with high signal-to-noise data. Spectra of distant galaxies frequently lack the signal-to-noise necessary to measure multiple Balmer lines and correct simultaneously for extinction and Balmer absorption in a self-consistent fashion. For galaxies with strong emission lines due to active star formation (i.e., Å), a correction of a few Å to the line will have a small impact on the derived or . However, in galaxies dominated by older stellar populations with weak emission lines, or will depend sensitively on the correction for Balmer absorption.
Until this point in the analysis, we have not made any corrections for stellar Balmer absorption. The effect of underlying Balmer absorption (specifically the amount of absorption in the H line, will depress the measured and . This leads to systematically large or , and systematically low oxygen abundances for objects on the upper (metal-rich) branch of the empirical calibrations.
The impact of stellar absorption can be assessed using Figure 5. Using the K92+ galaxies, we performed a self-consistent reddening and stellar absorption correction for each galaxy. The upper left panel compares the raw ratio with the quantity which includes the corrections for reddening and stellar absorption. The correlation between and is modest, with a dispersion of dex and a systematic offset of 0.06 dex. The lower panels illustrate the nature of the residuals as a function of galaxy color and EW. As might be expected, galaxies with the lowest are the most deviant, while galaxies with show a much smaller dispersion. A more logical approach is also to add a correction to for the underlying stellar absorption, forming a new quantity . Galaxies with the lowest are affected most by this correction. A 2 Å correction to was chosen because it was the mean correction needed to produce , and is consistent with mean corrections found for other galaxies (e.g., McCall et al. 1985; Olofsson 1995). The center top panel shows plotted against . The residuals are now much smaller with dex and a systematic offset of less than 0.01 dex. In the absence of direct measurements of the Balmer absorption due to stellar populations, application of a 2 Å blanket correction to appears to be prudent.
5.3 The Ionization Parameter Quantity [O III]/[O II]
Modern calibrations relating to oxygen abundance include a measure of the ionization parameter, such as as a second parameter (e.g., McGaugh 1991; Pilyugin 2001). We test the suitability of using a quantity in place of in Figure 6. K92+ galaxies appear as crosses and the NFGS galaxies appear as solid symbols. The upper left panel shows the correlation between and , where denotes line strengths that have not been corrected for reddening. Although the correlation is strong, the residuals in the lower rows are large and strongly systematic with galaxy color and emission line . The top middle panel shows the correlation between and , where denotes line strengths that have been corrected for reddening. The correlation is now much stronger and less systematic. The RMS dispersion is dex. The mean residuals of the two samples are systematic in different directions. The residuals of the K92+ galaxies suggest a systematic reddening overcorrection of the [O II] 3727 line. The residuals for the NFGS galaxies are still systematic with galaxy color and suggest a reddening undercorrection for the reddest galaxies. The two samples have been analyzed identically, and we have no explanation for the apparent differences. A more rigorous comparison would require re-measuring all of the line strengths and equivalent widths to ensure uniform treatment of the samples. However, electronic spectra for the NFGS and KISS galaxies are not publicly available.
In Figure 7 we show the versus and comparisons for the KISS galaxies. The residuals for both the left and center columns are dex and dex. The lack of improvement with reddening correction is undoubtedly traceable to the large, apparently random, dispersion in the [O II] line strengths and EWs of the KISS spectra, as noted in previous figures.
In summary, the ratios could be used as a surrogate for ratios as a indicator of the ionization parameter. The residuals are on the order of dex and are sometimes strongly systematic with galaxy color. The mean of the residuals varies considerably from -0.08 dex to 0.12 dex in depending on the galaxy sample under study.
6 Discussion and Conclusions
The ratios of the equivalent widths of strong oxygen and hydrogen emission lines from the ionized component of distant galaxies can be used as a measure of the global ISM metallicity via the substitution of for . We recommend the use of where the has been corrected for stellar Balmer absorption assuming a mean correction of 2 Å. The typical dispersion from the 1-to-1 relation between either or and the canonical reddening and absorption-corrected ratio is dex. Residuals are somewhat smaller ( dex) for galaxies with the largest emission-line equivalent widths (i.e., those having the largest rates of star formation per unit luminosity). The additional uncertainty introduced by translating a set of measured equivalent widths into the traditional flux ratio diagnostic is comparable to or less than the typical observational line measurement uncertainties and systematic errors in the to O/H calibration which run 0.15 dex in O/H (e.g., Kobulnicky, Kennicutt & Pizagno 1999 for a more detailed discussion of the error budget). We anticipate that the method tested here will be useful for performing rough chemical abundance estimates in large high-redshift galaxy samples. The approach described here will be most useful in a statistical sense when large numbers of objects are available for study. Possible applications include understanding the overall chemical evolution of star forming galaxies over large intervals of cosmic time (Kobulnicky et al. 2003) or assessing the impact of cluster environment and the intracluster medium on the chemical properties of the ISM within galaxies (e.g., Skillman et al. 1996).
References
- (1)
- (2) Aller, L. H. 1990, PASP, 102, 1097
- (3) Calzetti, D., Kinney, A. L., & Storchi-Bergmann, T. 1994, ApJ, 429, 582
- (4) Dopita, M. A., & Evans, I. N. 1986, ApJ, 307, 431
- (5) Edmunds, M. G. & Pagel, B. E. J. 1984, MNRAS, 211, 507
- (6) Howarth, I. D. 1983, MNRAS, 203, 301
- (7) Huchra, J. P., Davis, M., Latham, D., & Tonry, J. 1983, ApJS, 52, 89
- (8) Hummer, D. G., & Storey, P. J. 1987, MNRAS, 224, 801
- (9) Jansen, R. A., Franx, M., Fabricant, D., & Caldwell, N. 2000a, ApJS, 126, 271 (NFGS)
- (10) Jansen, R. A., Fabricant, D., Franx, M., & Caldwell, N. 2000b, ApJS, 126, 331
- (11) Kennicutt, R. C. Jr. 1992a, ApJS, 79, 255
- (12) Kennicutt, R. C. Jr. 1992b, ApJ, 388, 310
- (13) Kobulnicky, H. A., Kennicutt, R. C., & Pizagno, J. 1998, ApJ, 514, 544 (KKP)
- (14) Kobulnicky, H. A. & Gebhardt, K. 2000, AJ, 119, 1608
- (15) Kobulnicky, H. A., Willmer, C. N. A., Weiner, B. J., Koo, D. C., Phillips, A. C., Faber, S. M., Sarajedini, V. L., Simard, L., & Vogt, N. P. 2003, ApJ, 000 (Ke03)
- (16) Kobulnicky, H. A., & Skillman, E. D. 1996, ApJ, 471, 211
- (17) McCall, M. L., Rybski, P. M., & Shields, G. A. 1985, ApJS, 57, 1 (MRS)
- (18) McGaugh, S. 1991, ApJ, 380, 140
- (19) McGaugh, S. 1998, private communication
- (20) Melbourne, J., & Salzer, J. J. 2002, AJ, 123, 2302
- (21) Morgan, W. W., & Mayall, N. U. 1957, PASP, 69, 291
- (22) Olofsson, K. 1995, A&AS, 111, 570
- (23) Osterbrock, D. E. 1989, Astrophysics of Gaseous Nebulae and Active Galactic Nuclei, University Science Books:Mill Valley CA
- (24) Pagel, B. E. J. 1998, Nucleosynthesis and Chemical Evolution of Galaxies, Cambridge University Press
- (25) Pagel, B. E. J. Edmunds, M. G., Blackwell, D. E., Chun, M. S., & Smith, G. 1979, MNRAS, 189, 95
- (26) Pilyugin, L. S., 2001, A&A, 369, 594
- (27) Pritchet, C. R. 1977, ApJS, 35, 397
- (28) Salzer, J. J. 2003, private communication
- (29) Salzer, J. J. et al. 2003, in press
- (30) Salzer, J. J., Gronwall, C., Lipovetsky, V. A.; Kniazev, A., Moody, J. W,, Boroson, T. A., Thuan, T. X., Izotov, Y. I., Herrero, J. L., Frattare, L. M. 2000, AJ, 120, 80 (KISS)
- (31) Seaton, M. J. 1979, MNRAS, 187, 73p
- (32)
- (33) Skillman, E. D., Kennicutt, R. C., Shields, G. A., & Zaritsky D. 1996, ApJ, 462, 147