H2 absorption in a dense interstellar filament
in the Milky Way halo
We investigate interstellar absorption from molecular hydrogen (H2) and metals in an intermediate-velocity cloud (IVC) in the direction of the LMC star Sk -68 80 (HD 36521), based on data from the Far Ultraviolet Spectroscopic Explorer (FUSE) satellite. H2 absorption from the Lyman- and Werner bands is detected in 30 lines at radial velocities km s-1 in this IVC that is presumably located in the Milky Way halo. We obtain a total logarithmic H2 column density of log H along with a very low Doppler parameter of km s-1. The presence of molecular material in this cloud is suprising, given the fact that the O i column density (log O i) implies a very low neutral gas column density of cm-2 (assuming a solar oxygen abundance). If the H2 column density represents its abundance in a formation-dissociation equilibrium, the data imply that the molecular gas resides in a small, dense filament at a volume density of cm-3 and a thickness of only 41 Astronomical Units (AU). The molecular filament possibly corresponds to the tiny-scale atomic structures (TSAS) in the diffuse interstellar medium observed in high-resolution optical data, H i 21cm absorption, and in CO emission.
Key Words.:
Galaxy: halo - Interstellar Medium (ISM): molecules - ISM: structure1 Introduction
Recent high resolution absorption line measurements in the optical and ultraviolet have shown that the interstellar medium (ISM) consists of significant small-scale structure at sub-pc scales (e.g., Meyer & Lauroesch 1999; Lauroesch & Meyer 1999; Lauroesch, Meyer, & Blades 2000). Small-scale structure can be identified as variations in the shapes of absorption line profiles toward background sources at very small angular separation (e.g., toward stellar clusters or binary stars) and/or by re-observing the same background source at different epochs. Optical depth variations on the scale of several AUs are observed through H i 21cm absorption toward high-velocity pulsars and extragalactic radio sources (Frail et al. 1994; Faison et al. 1998), also indicating the presence of small-scale structure in the ISM. Such optical depth variations in local gas can introduce significant systematic errors in observations for which foreground absorption has to be considered. For example, reddening variations at arcmin scales are found to be responsible for substantial color variations among giant branch stars in the Galactic globular cluster M22 (Richter, Hilker, & Richtler 1999); they are also observed toward other globular clusters (e.g., von Braun et al. 2002). All these observations indicate that small-scale structure may represent an important aspect of the ISM that yet is poorly understood.
Optical and ultraviolet absorption spectroscopy of stars and extragalactic background sources is a very sensitive method to study small-scale structure in the diffuse ISM because of the large number of spectral lines that are available for this task, sampling the molecular, neutral and ionized gas phases at a very high accuracy. Particulary interesting for this purpose are observations of diffuse halo clouds that typically have H i column densities cm-2 (see Wakker 2001) and which are well separated in radial-velocity ( km s-1) from the strong local disk absorption. These intermediate- and high-velocity clouds (IVCs and HVCs, respectively) trace various processes that circulate gas through the Milky Way halo, such as the “Galactic Fountain” (Shapiro & Field 1976; Houck & Bregman 1991), infall of low-metallicity gas from intergalactic space (Wakker et al. 1999; Richter et al. 2001a, 2001b), and interaction with the Magellanic Clouds (Lu et al. 1998). Spanning a wide range of metallicities and not being exposed to intense stellar UV radiation, IVCs and HVCs serve as important interstellar laboratories to study physical processes in the diffuse ISM.
In this paper we use far-ultraviolet (FUV) absorption line data from the Far Ultraviolet Spectroscopic Explorer (FUSE) obtained to study molecular and atomic absorption in intermediate- and high-velocity gas toward the Wolf-Rayet star Sk -68 80 (HD 36521) in the Large Magellanic Cloud (LMC). We emphasize molecular hydrogen (H2) absorption in the IVC gas that possibly samples small-scale structure at sub-pc levels (Richter et al. 2003). This paper is organized as follows: In Sect. 2 we describe the FUSE observations, the data reduction, and the analysis method. In Sect. 3 we review the sight-line structure in the direction of Sk -68 80. In Sect. 4 we analyze in detail absorption by metals and H2 in the IVC component at km s-1. In Sect. 5 we briefly consider atomic and molecular absorption in the HVC component near km s-1. A discussion of our results is presented in Sect. 6. In the Appendix we review other LMC sight lines; in particular we re-analyze the FUV spectrum of Sk -68 82 (HD 269546).
2 Observations and data handling
The LMC star Sk -68 80 (HD 36521; ) is a Wolf-Rayet star (WC4+O6.5; ), and part of the OB association LH 58 in the H ii region N 144 (Massey, Waterhouse, & DeGioia-Eastwood 2000). FUSE observations of Sk -68 80 (program ID P1031402) were carried out on 17 December 1999 through the large aperture (LWRS) of the FUSE instrument. Four exposures were taken, totalling 9.7 ks of integration time. FUSE is equipped with four co-aligned Rowland circle spectrographs and two microchannel-plate detectors, covering the wavelength region between 905 and 1187 Å. Two of the four available channels are coated with Al+LiF (for maximum throughput at Å), the other two with SiC (for Å). The LiF and SiC channels and their segments overlap in the wavelength region between and Å. FUSE provides three entrance apertures: (LWRS; the one used for the observations presented here), (MDRS), and (HIRS). Details about the instrument and its on-orbit performance are presented by Moos et al. (2000) and Sahnow et al. (2000). The FUSE spectrum of Sk -68 80 was recorded in photon-address mode (storing the arrival time, the pulse height and the X/Y location of each detection) and was reduced with the v2.0.5 version of the CALFUSE standard pipeline, which corrects for the detector background, orbital motions of the spacecraft, and geometrical distortions. We find that the wavelength calibration provided by CALFUSE v2.0.5, as well as the spectral resolution (as checked by fitting Gaussian absorption profiles to the data), has significantly improved the data quality for Sk -68 80 in comparison to reductions with earlier CALFUSE versions. For the purpose of this study (measuring weak absorption components in a multi-component absorption pattern; see next section), this improvement is crucial in view of the determination of precise equivalent widths and the separation of the various absorption components. The reduced FUSE data of Sk -68 80 have a velocity resolution of km s-1 (FWHM), corresponding to a resolving power of . Radial velocities were transformed into the Local Standard of Rest (LSR) system. For this spectrum, we estimate an uncertainty of km s-1 () for the velocity calibration provided by the CALFUSE v2.0.5 pipeline.
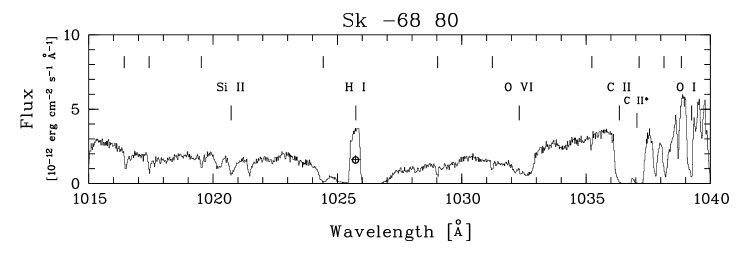
The average continuum flux is erg cm-2 s-1 Å-1, resulting in a signal-to-noise ratio (S/N) of per resolution element. The individual exposures were co-added, and the data were rebinned to km s-1 wide bins (3 pixel rebinning). Fig. 1 shows the FUSE spectrum of Sk -68 80 in the wavelength range between and Å. Atomic absorption features are labeled above the spectrum; molecular hydrogen absorption lines are marked with tic marks above the metal line identifications. The continuum flux of Sk -68 80 varies on large scales ( Å) in the FUSE spectrum. On smaller scales ( Å) the continuum is relatively smooth, making the continuum placement for interstellar absorption towards Sk -68 80 relatively reliable, in contrast to many other LMC stars that have strongly varying continua even in the sub-Å regime (e.g., Sk -68 82, see Appendix). The continuum was fitted locally for each measured absorption line, using low-order polynomials. Equivalent widths of the absorption components were measured by fitting multi-component Gaussian profiles to the data. Column densities were derived using a standard curve-of-growth technique.
3 The sight-line structure towards Sk -68 80
Although the LMC provides an excellent set of stellar backgound sources for the study of intermediate- and high-velocity halo gas, the complex sight-line structure toward the LMC makes the analysis of foreground halo components a difficult task (e.g., Savage & de Boer 1979).
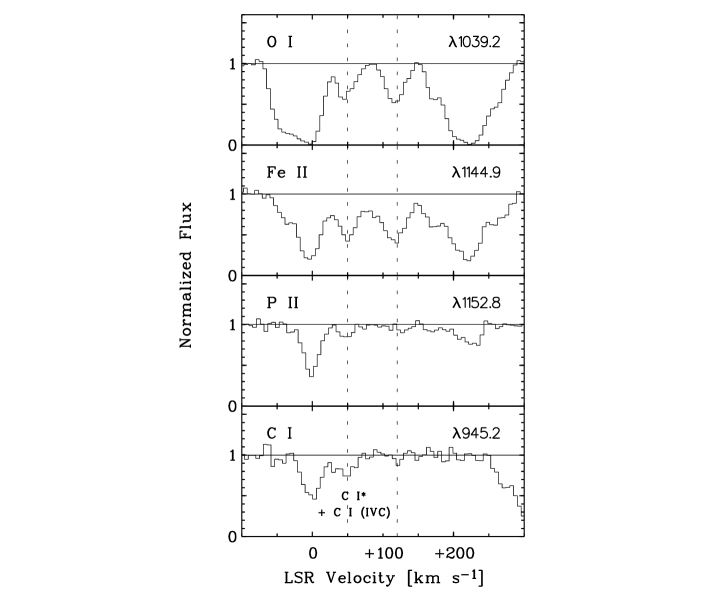
Fig. 2 shows FUSE absorption profiles of O i , Fe ii , P ii , and C i in the direction of Sk -68 80, plotted on the LSR velocity scale. The various absorption components can be divided into three different groups: (1) absorption by local Milky Way gas in the velocity range between to km s-1, (2) absorption by intermediate- and high-velocity clouds at velocities near to km s-1 (IVC) and to km s-1 (HVC), and (3) absorption by LMC gas in the velocity range between to km s-1, with a component structure that generally varies over the field of the LMC, as seen toward other background sources (Tumlinson et al. 2002; Howk et al. 2002). While the IVC gas in front of the LMC most likely belongs to the Milky Way, the origin of the HVC is not clear. This cloud could be Galactic fountain gas (Richter et al. 1999; Welty et al. 1999) or high-velocity gas that has been pushed out of the LMC (Staveley-Smith et al. 2003).
The individual absorption components exhibit sub-structure, which is clearly visible in Fig. 2 in the Fe ii absorption of the local Milky Way component and the LMC component. It is very likely that most of the existing sub-components are not resolved in the FUSE data, a fact that has to be taken into account for the interpretation of the observed absorption pattern. Indeed, Welty et al. (1999) find at least 46 absorption components in the direction of the LMC SN1987A using high-resolution (FWHM km s-1) optical spectra, which emphasizes the extreme complexity of the sight-line structure in the general direction of the LMC.
In this paper, we concentrate on absorption from the IVC and HVC gas. At the resolution of FUSE, both halo components are well fitted by single Gaussian profiles, with central velocities near km s-1 (IVC) and km s-1 (HVC), as marked in Fig. 2 with dotted lines. Because of the large number of absorption features in the spectrum, severe blending problems occur for many atomic and molecular lines; thus, possible blending effects have to be considered carefully for each absorption line. H i 21cm data for the IVC and HVC material towards N 144 is available from a Parkes spectrum (32 arcmin beam) centered on Sk -68 82, arcmin away from Sk -68 80 (McGee & Newton 1986). The Parkes data show the IVC component at an H i column density of H i cm-2, while the HVC component has H i cm-2 (McGee & Newton 1986). Newer Parkes data ( arcmin beam), however, imply lower column densities of H i cm-2 and H i cm-2 in the direction of Sk -68 80/Sk -68 82. The differences in column densities may indicate the existence of H i sub-structure on scales between 15 and 32 arcmin ( pc at a distance of 2 kpc). Therefore, the 21cm data most likely provide only a rough estimate of the H i column densities in the IVC and HVC towards Sk -68 80. The H i radio data suggest, however, that the column densities of the neutral gas within the two halo clouds in front of the LMC are relatively low when compared to other Galactic IVC and HVC complexes (see Wakker 2001).
4 The IVC at near km s-1
4.1 Metal absorption
We have measured equivalent widths for IVC absorption in 13 lines of C i, O i, Si ii, P ii, Ar i, and Fe ii, as listed in Table 1. The six Fe ii lines that are detected in the IVC component fit on a single-component curve of growth with a Doppler parameter km s-1 and a column density of log Fe ii (Fig. 3). Fitting the lines of O i, Si ii, P ii, and Ar i (see Table 1) to the same curve of growth, we derive log (O i), log (Si ii), log (P ii), and log (Ar i). Column densities are also listed in Table 2. Unfortunately, C i absorption at IVC velocities is blended by Galactic C i⋆ (see Fig. 2); however, assuming that all of the absorption is due to C i in the IVC, we obtain an upper limit of log (C i). It is possible that the values for these species are slightly different than that of Fe ii, depending on the ionization structure of the cloud. However, due to the limited number of lines and the lack of further information we have to adopt km s-1 for all atomic species.
The ratios of [Fe ii/O i] and [Si ii/O i] (where [Fe/O] represents the solar abundance ratio on a logarithmic scale; Anders & Grevesse 1989; Grevesse & Noels 1993) are relatively high, indicating a substantial amount of ionized gas that is sampled by Fe ii and Si ii (ionization potentials are 16.2 and 16.4 eV, respectively), but not by O i (ionization potential is 13.6 eV, identical with that of H i). The data for Fe ii and Si ii suggest that the column density of ionized gas in the IVC exceeds that of the neutral gas by a factor of . This factor could be even higher if some of the Fe and Si is depleted onto dust grains. This high degree of ionization may indicate the presence of shocks. Due to the uncertainty of the H i column density in the IVC towards Sk -68 80 from the 21cm data (see previous section) and the high column density of ionized gas we refrain from calculating gas phase abundances for these elements. Instead, we use the O i absorption line data to estimate the H i column density in the IVC along this sight-line, which will be important for the interpretation of the H2 abundance in the IVC (next section). The abundances of O and H are coupled by charge exchange reactions. Moreover, oxygen does not significantly deplete onto dust grains. Assuming an intrinsic oxygen abundance, we can use (O i) to obtain the H i column density in the IVC. Previous studies of Galactic IVCs (Richter et al. 2001a, 2001c) indicate that these clouds have solar metal abundances, suggesting that they originate in the disk of the Milky Way. If we assume that the IVC in front of the LMC also has a solar oxygen abundance, and take log (O/H) (Holweger 2001), we derive H i cm-2. This value is compatible with the upper limit for H i) from the newer Parkes data (see Sect. 3).
| Species | b | log | IVC | HVC |
| [Å] | [mÅ] | [mÅ] | ||
| C i | 945.191 | 2.411 | ||
| O i | 948.686 | 0.778 | ||
| 1039.230 | 0.980 | |||
| Si ii | 1020.699 | 1.225 | ||
| P ii | 1152.818 | 2.451 | ||
| Ar i | 1048.220 | 2.440 | ||
| Fe ii | 1055.262 | 0.962 | ||
| 1096.877 | 1.554 | |||
| 1121.975 | 1.512 | … | ||
| 1125.448 | 1.244 | |||
| 1142.366 | 0.633 | |||
| 1143.226 | 1.342 | |||
| 1144.938 | 2.096 | |||
| H2 R(0),4-0 | 1049.366 | 1.383 | … | |
| H2 R(0),1-0 | 1092.194 | 0.814 | … | |
| H2 R(0),0-0 | 1108.128 | 0.283 | … | |
| H2 R(1),8-0 | 1002.457 | 1.256 | ||
| H2 P(1),8-0 | 1003.302 | 0.948 | … | |
| H2 R(1),4-0 | 1049.960 | 1.225 | ||
| H2 P(1),4-0 | 1051.033 | 0.902 | … | |
| H2 P(1),3-0 | 1064.606 | 0.805 | c | … |
| H2 R(1),2-0 | 1077.702 | 0.919 | … | |
| H2 R(1),1-0 | 1092.737 | 0.618 | … | |
| H2 R(1),0-0 | 1108.639 | 0.086 | … | |
| H2 R(2),8-0 | 1003.989 | 1.232 | ||
| H2 P(2),8-0 | 1005.398 | 0.993 | … | |
| H2 Q(2),0-0 | 1010.938 | 1.385 | ||
| H2 R(2),7-0 | 1014.980 | 1.285 | … | |
| H2 P(2),7-0 | 1016.466 | 1.007 | c,d,f | … |
| H2 R(2),4-0 | 1051.498 | 1.168 | … | |
| H2 P(2),4-0 | 1053.284 | 0.982 | … | |
| H2 P(2),2-0 | 1081.269 | 0.708 | f | … |
| H2 R(3),0-0 | 1010.128 | 1.151 | ||
| H2 R(3),7-0 | 1017.427 | 1.263 | e | |
| H2 P(3),6-0 | 1031.195 | 1.055 | ||
| H2 R(3),5-0 | 1041.159 | 1.222 | … | |
| H2 P(3),5-0 | 1043.504 | 1.060 | … | |
| H2 R(3),4-0 | 1053.975 | 1.137 | … | |
| H2 P(3),4-0 | 1056.471 | 1.006 | … | |
| H2 P(3),3-0 | 1070.141 | 0.910 | ||
| H2 P(3),1-0 | 1099.792 | 0.439 | ||
| H2 R(4),5-0 | 1044.543 | 1.195 | ||
| H2 R(4),4-0 | 1057.379 | 1.138 |
a Equivalent widths, errors and
upper limits are given.
b Wavelengths and oscillator strengths from
Morton (1991), Morton (2003, in preparation), and Abgrall & Roueff (1989).
c Suprisingly strong.
d H2 absorption extends to km s-1.
e Possibly blended by H2 W Q(5),0-0.
f Line not included in curve-of-growth fit.
4.2 H2 absorption
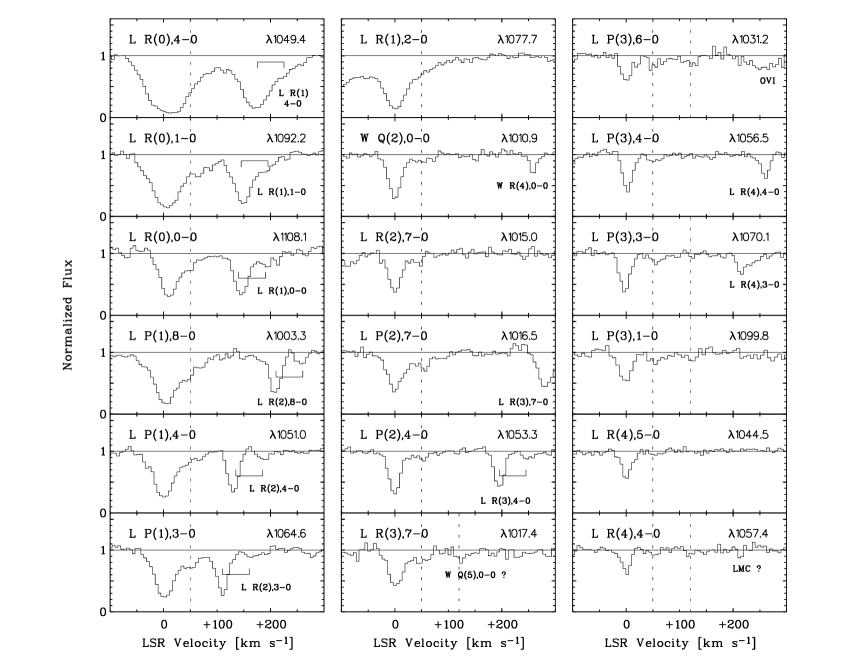
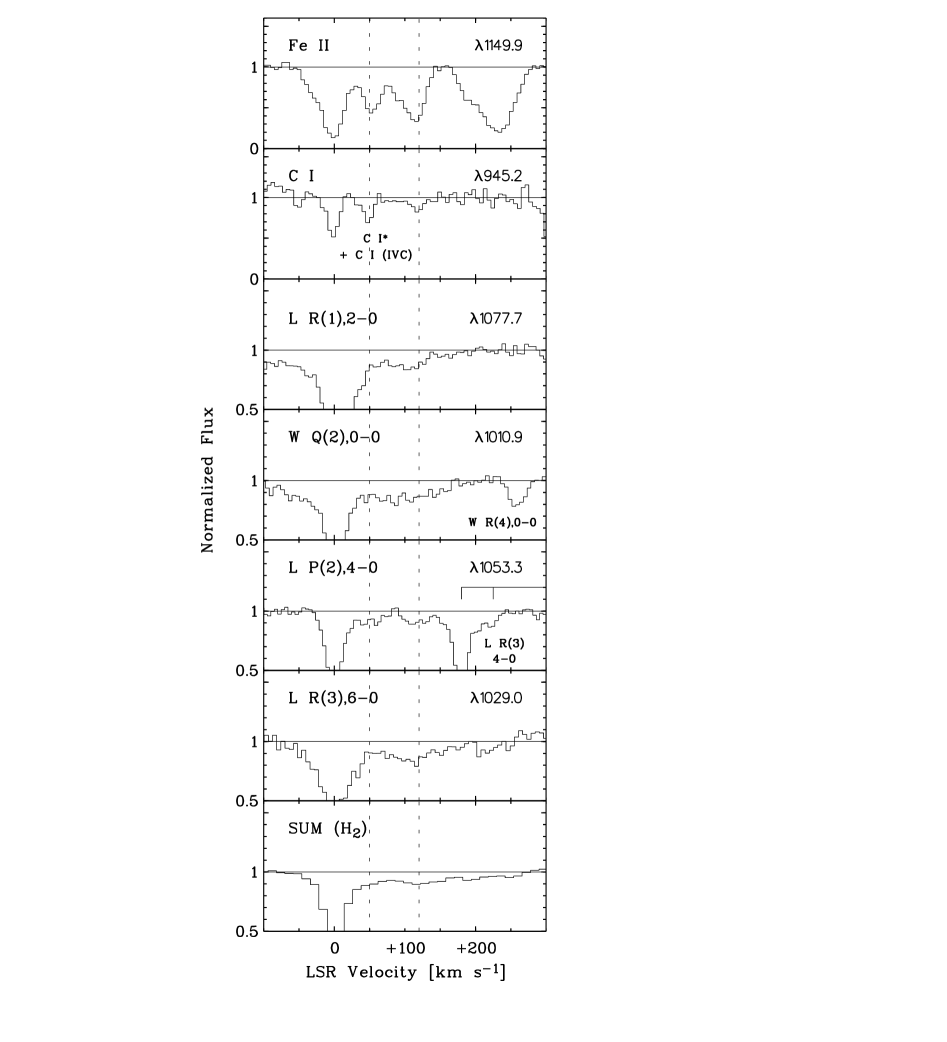
Molecular hydrogen absorption in the IVC component at km s-1 is found in 30 transitions in the Lyman- and Werner electronic bands. IVC H2 absorption is present in rotational levels at relatively low equivalent widths ( mÅ). The fact that weak H2 absorption occurs in so many lines that span a wide range in oscillator strengths (see Abgrall & Roueff 1989) already indicates that most lines must lie on the flat part of a curve of growth with a very low value. Table 1 presents equivalent widths of 30 H2 lines from IVC H2 absorption above a detection level. Fig. 4 shows a selection of H2 absorption profiles plotted on the LSR velocity scale. The data points fit best on a curve of growth with logarithmic H2 column densities, log , of log , log , log , log , and log , and a value of km s-1 (see also Table 2). Such a low value is unusual for Galactic halo clouds (e.g., Richter et al. 2003), implying that the H2 gas is located in a relatively confined region with little interstellar turbulence. In order to check the quality of the fit we also have put the data on curves of growth with higher values. The H2 data points, however, are confined in a relatively narrow region in the log (log () parameter space, and all fits to curves of growth with km s-1 lead to very unsatisfying results. We thus adopt km s-1 for the discussion below. Adding the individual column densities for given above, the total H2 column density is log H, the highest found for IVC gas so far (see Richter et al. 2003). The fraction of hydrogen in molecular form, H(H iH, can be estimated only indirectly, since the H i column density from the 21cm observations probably does not give a reliable estimate for (H i in the IVC towards Sk -68 80 (see Sect. 4.1). If we assume that H i cm-2, as estimated from O i in the previous section, we obtain . Thus, in comparison to previous IVC H2 results, the molecular hydrogen fraction is remarkably high, especially in light of the fact that the neutral gas column density appears to be rather small, and that most of the IVC gas is ionized.
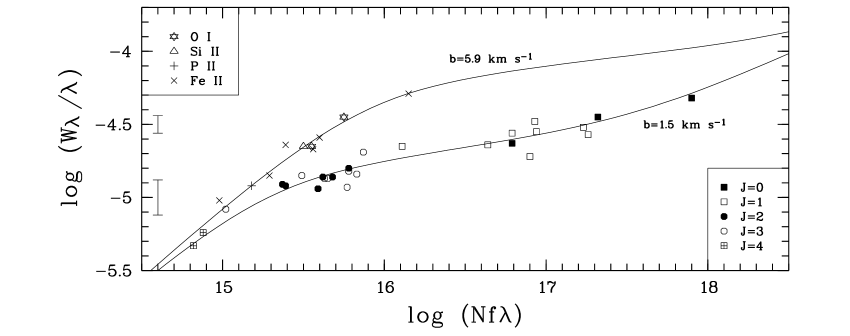
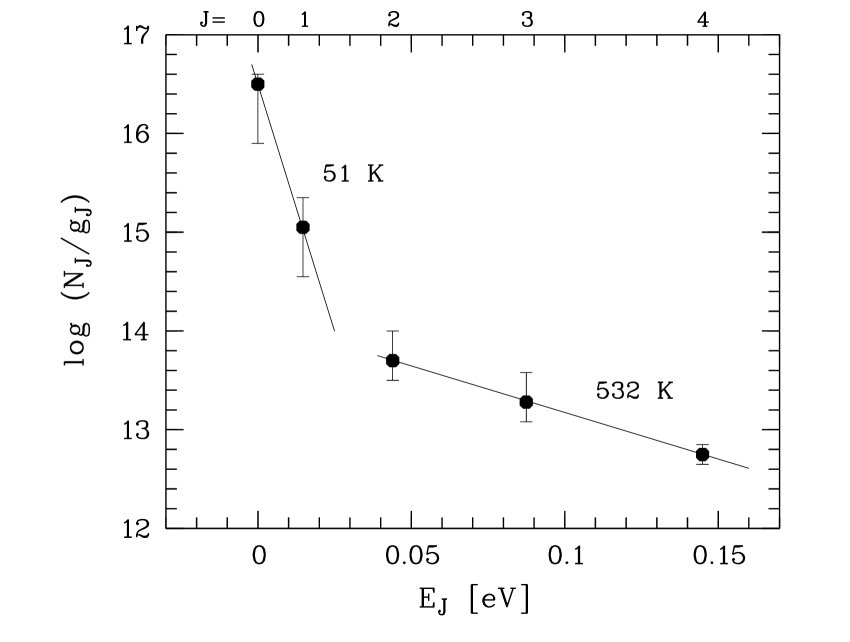
We now analyze the rotational excitation of the H2 gas. In Fig. 5 we have plotted the H2 column density for each rotation level, , divided by the quantum mechanical statistical weight, , against the rotational excitation energy, . The data points follow the usual trend that is seen for many H2 absorption line measurements: the two rotational ground states ( and ) lie on a straight line that represents the Boltzmann distribution for a temperature of T01, whereas a different Boltzmann fit with TT01 is required to describe the level population for . We obtain T K and T K. The value for T01 probably reflects the kinetic temperature of the H2 gas, implying that H2 line self-shielding is protecting the interior of the cloud from being excited and dissociated by UV photons. The value of K is lower than found on average in local disk gas ( K) and on the lower side of the distribution of kinetic temperatures in local diffuse H2 gas (Savage et al. 1977). UV photon pumping and H2 formation pumping (see, e.g., Shull & Beckwith 1982) are believed to excite the higher rotational states () of the H2, resulting in an equivalent Boltzmann temperature (532 K) that is much higher than that for the rotational ground states. In view of the relatively mild UV radiation field in the halo (see discussion in Sect. 4.3), the enhanced excitation most likely is caused by the formation process of H2 on the surface of dust grains, although other processes, such as shocks, may also play a role here.
| Species | log | log | ||
|---|---|---|---|---|
| [km s-1] | [km s-1] | |||
| C i | ||||
| O i | ||||
| Si ii | ||||
| P ii | ||||
| Ar i | ||||
| Fe ii | ||||
| H2 | ||||
| H2 | ||||
| H2 | ||||
| H2 | ||||
| H2 | ||||
| H2 total |
a Column densities, errors and upper limits are given
4.3 Physical properties of the H2 gas
H2 absorption in intermediate-velocity halo gas is a widespread phenomenon, as is shown in the FUSE survey of molecular hydrogen in H i IVCs (Richter et al. 2003, hereafter R03). The IVC H2 survey data suggest that the possibility of intersecting intermediate-velocity H i gas containing molecular material may be as high as 50 percent. The findings so far imply a very diffuse molecular gas phase with molecular hydrogen fractions typically below (R03).
A simple model for the H2 abundance in IVCs in a formation-dissociation equilibrium (R03) requires that the H2 resides in small ( pc), dense ( cm-3) gas blobs or filaments. In comparison to the previous IVC H2 detections, the present measurement in the IVC towards Sk -68 80 stands out because the H i column density of this component appears to be exceptionally low ((H i) cm-2), as indicated by the low O i column density and the 21cm data (see Sect. 3). Below we suggest an answer to the question of how molecular gas can form in such a low column density environment and can avoid the UV photo dissociation. We assume that the km s-1 absorption is due to gas located in the lower halo of the Milky Way (see, e.g., Welty et al. 1999), so that we can make use of the simple formalism described by R03 to find the hydrogen volume density () required to describe the observed H2 column density in a formation-dissociation equilibrium:
| (1) |
The parameters and represent scaling factors described below. We assume that the H2 grain formation rate in the IVC is similar to that in the disk of the Milky Way, and that the H2 photo-absorption rate at the edge of the IVC is half of that typically found in local interstellar gas subject to the (expected) reduced UV photon flux in the halo of the Milky Way. The parameter in the above equation is a scaling factor that relates the H i and H2 volume densities with their column densities. A detailed discussion about these parameters is presented in R03. Note that the high ionization fraction (Sect. 4.1) possibly indicates that the overall conditions in the IVC may not account for this simple formation-dissociation scenario; this will be further discussed in Sect. 4.4. Some of the neutral and molecular hydrogen may reside in physically distinct regions, and not all of the H i is available for the neutral-to-molecular hydrogen conversion. With we separate the cold neutral medium (CNM), in which the H2 resides, from the warm neutral medium (WNM) that surrounds the CNM in the IVC. In practice, it is difficult to estimate since its value characterizes the physical structure of the IVC, which is unknown. The difference in values found for the atomic species ( km s-1) and the molecular hydrogen ( km s-1) is a strong argument for assuming a pronounced core-envelope structure (CNM versus WNM). It is not clear, however, what fraction of the total IVC H i column density is related to the innermost dense core in which the H2 resides, and what fraction is due to absorption from the (much more extended) lower-density envelope. Similar to our previous study (R03), we will assume that . Equation (1) also includes an H2 line self-shielding factor. The relatively high column density found for the H2 (log H, the low value for T K, and the very low value imply that the H2 absorption in the IVC towards Sk -68 80 arises in a dense, single-component cloudlet, for which H2 line self-shielding has to be taken into account. We use the approximation provided by Draine & Bertoldi (1996), who find that for log H the UV dissociation rate in the cloud core is reduced by the factor Hcm (we here use the letter instead of their in order to avoid confusion with the molecular hydrogen fraction, , defined in Sect. 4.2). In our case, we have H cm-2, , and we assume that H i) cm-2, as indicated by the O i data. From equation (1) we then obtain cm-3, and the linear diameter of the H2 bearing structure, H i, is only cm, or AU. It thus appears that the molecular hydrogen in the IVC towards Sk -68 80 is situated in a very small dense filament, indicating the presence of substantial small-scale structure in this diffuse halo cloud.
4.4 Possible complications
The results that we have obtained above are derived
by a straightforward analysis of the H2 and metal
line absorption in the IVC component in front
of Sk -68 80.
The high density
and the small size of the molecular
structure, inferred from calculating
the H2 abundance in a formation-dissociation
equilibrium, are remarkable. In view of these
results, it is important to consider and discuss
possible complications and systematic errors
that might have influenced
our analysis, and to point to future
observations that could help to confirm or
discard the interpretations that we present
in this paper.
In the following paragraphs, we list several possible
complications:
(1) Significant velocity structure is
present in the atomic IVC gas, but is unresolved in
the FUSE data. The presence of velocity structure
in the IVC appears likely given the many
sub-components in the IVC gas towards SN 1987A
seen in
very-high resolution optical spectra (Welty et al. 1999).
Such unresolved velocity structure in the lower-resolution
FUSE data may introduce a significant uncertainty for
the determination of heavy element column densities, for which
we had assumed a single Gaussian component (see Sect. 4.1)
with a value of km s-1. If several
sub-components with lower -values are present, we
might underestimate the column density of O i
(and the other elements) and thus the total H i gas
column density along the line of sight used for equation (1). Also, it is
possible that the various atomic species (Tables 1 & 2) have different
values
because of the ionization structure in the gas. This introduces
another uncertainty for the atomic column densities listed in
Table 2. High-resolution optical data for Sk -68 80 will help
to investigate possible sub-component structure in the IVC gas.
(2) The metallicity of the gas is lower than solar.
We had assumed a solar metallicity for estimating the
neutral hydrogen column density in the IVC towards
Sk -68 80, assuming that this IVC has abundances similar
to other IVCs in the Milky Way halo (e.g., Richter et al. 2001c).
If the actual metallicty of the gas is
lower (for example, if the gas belongs to the LMC rather
than to the Milky Way), we will underestimate (H i)IVC
using this method, and the parameters and
derived from equation
(1) would have to be corrected. The H i 21cm
data gives no evidence that we have significantly
underestimated (H i)IVC by this method,
but radio beam smearing may complicate
such a comparison. If the metallicity is lower than solar, the
dust abundance in the gas should be reduced as well,
so that the H2 grain formation rate in the IVC
(see equation (2) in R03)
should be smaller than for solar-metallicity gas.
In this case, we would overestimate the H2 formation
rate and underestimate the hydrogen volume
density () that is required to balance
the H2 formation/dissociation at the observed column densities
(see equation (1)).
(3) The dissociating UV radiation field is lower or higher.
We have estimated the dissociating UV radiation field in the
lower Milky Way halo (see R03) using the scaling relation
provided by Wolfire et al. (1995).
Assuming that the IVC is located kpc above the
Galactic plane, the UV radiation field is expected to be reduced
by a factor of in comparison to the midplane
intensity, mainly because of extinction by dust grains.
If the position of the IVC in the halo of the Milky Way is
such that the UV field at the IVC is
much lower than assumed (e.g., due to shielding effects),
then the H2 photo-dissociation rate, and thus ,
would be overestimated. However, the high degree of ionization
(see Sect. 4.1) may also imply that the UV field is much stronger than
assumed, leading to an enhanced photoionization of the IVC. If so, we would
underestimate the H2 photo-dissociation, and thus .
(4) The WNM dominates the neutral hydrogen column density.
Yet another uncertainty is introduced
through the factor which we have used in equation (1) to
account for the possibility that not all of the neutral material
is physically related to the CNM and the molecular gas.
If the WNM is the main contributor to the IVC H i column
density, could be much smaller than the assumed .
In this case,
would be underestimated.
(5) The H2 gas is not in formation-dissociation
equilibrium. Equation (1) describes the hydrogen volume
density that is necessary to balance the formation of H2
on dust grains with the dissociation by UV photons at
a fractional abundance of H2 (in terms of column density)
that is provided by the observations. However, such an equilibrium
situation might not be appropriate, in which case our conclusions
about the hydrogen volume density and diameter of the
structure would be incorrect. Evidence for a possible
non-equilibrium situation is provided by the high
ionization fraction in the IVC gas, which may indicate
the presence of a shock that collisionally ionizes
the gas.
(6) The atomic IVC gas and the molecular hydrogen at
km s-1 are not related. We have assumed that the
IVC H2 absorption towards Sk -68 80
is related to the widespread neutral and ionized material
at intermediate velocities in front of the LMC that is
seen along many sight lines (see, e.g., Danforth et al. 2002).
It is possible, however, that the H2 absorption occurs
in gas that is spatially and/or physically unrelated
to the neutral IVC gas, coincidentally having a similar
radial velocity. Theoretically, the H2 absorption
at similar velocities could be somehow related to circumstellar
material or gas from supernova remnants (e.g., Welsh, Rachford,
& Tumlinson 2002), in which case our conclusions
may be incorrect. Dense molecular clumps in the outskirts
of our Galaxy have been proposed as candidates for
baryonic dark matter (e.g., de Paolis et al. 1995;
Pfenniger, Combes & Martinet 1994).
The H2 absorption
at intermediate velocities may be due to diffuse inter-clump
gas that could arise from H2 clump collisions in the halo,
and that would be spatially much more extended than the dense
clumps. Such gas probably would have a
very low metal and dust content, and the parameters chosen for
equation (1) would be invalid.
5 The HVC near km s-1
The HVC component near km s-1 shows slightly stronger atomic absorption than the IVC component (see Fig. 2), and we have analyzed the HVC absorption in a similar fashion as for the IVC.
Equivalent widths and upper limits for C i, O i, Si ii, P ii, Ar i, and Fe ii are listed in Table 1. The atomic data fit on a curve of growth with km s-1. This rather high value implies the presence of unresolved sub-structure and/or substantial turbulence within the gas. Logarithmic column densities for the species listed above, as derived from the single-component curve of growth with km s-1, are presented in Table 2. Due to the probable existence of unresolved sub-structure and the uncertain H i column density (see Sect. 3 and Appendix), we do not derive gas-phase abundances for this cloud. The relatively high Fe ii and Si ii column densities in comparison to O i ([Fe ii/O i] and [Si ii/O i]) suggest a high degree of ionization, similar to what is found for the IVC gas (see also Bluhm et al. 2000).
Molecular hydrogen in the HVC is possibly detected in a few lines for (Fig. 4 and Table 1), but the features are too weak to claim a firm detection. However, the presence of HVC H2 along the nearby sight line towards Sk -68 82 (see Appendix) may imply that these features indeed are related to H2 absorption in the HVC component. Upper limits for the H2 column densities in the HVC gas towards Sk -68 80 have been derived assuming km s-1; they are listed in Table 2.
6 Discussion
The evidence for the existence of sub-pc structure in the diffuse interstellar medium has been accumulating impressively over the last few years, and is based on independent observations using various different observation techniques, such as H i 21cm absorption lines studies (e.g., Faison et al. 1998) and optical absorption line studies (e.g., Lauroesch, Meyer, & Blades 2000). Observations of diffuse molecular hydrogen, as shown in this study, may represent yet another, independent method to study the nature of the ISM at very small scales, assuming that the parameters that we used for our H2 formation-dissociation equilibrium calculation are roughly correct. The hydrogen volume density derived in this study suggests that the intermediate-velocity H2 gas in front of Sk -68 80 may be related to the tiny-scale atomic structures (TSAS, Heiles 1997) that have been found in H i 21cm absorption line studies. This is also supported by the fact that the H2 excitation temperature of T K corresponds to the canonical value of the CNM (Heiles 1997), in which the TSAS are expected to be embedded. Recently, small scale structure in the ISM has also been found in CO emission (Heithausen 2002). It is possible that the H2 gas detected here samples the transition zone from the cold neutral gas to the dense molecular gas phase at small scales.
While more and more observations indicate that small-scale structure represents an important aspect of the ISM, very little is known about the overall physical properties. At a temperature of T K and a density of cm-3 the thermal pressure, T, is cm-3, about 13 times higher than the standard thermal pressure in the CNM. Although the turbulent pressure may dominate the total gas pressure in TSAS, it remains unclear whether it could account for this large discrepancy. Heiles (1997) offers several geometrical solutions to account generally for the pressure problem in the TSAS, motivated by the exceptionally high volume densities ( cm-3) inferred from VLBI observations. He finds that if the TSAS are associated with curved filaments and sheets rather than with spherical clouds one could bring the high “apparent” volume densities from the H i observations down to a level of cm-3, thus into the density range we have obtained by a completely different method. Still, our density estimate from the formation-dissociation equilibrium of H2 is not independent of the geometry of the absorbing structure: if the IVC H2 absorption would occur in a sheet or curved filament rather than in a spherical cloud, this would change the geometry for the H2 self-shielding. For an elongated filament with an aspect ratio of four we would overestimate the self-shielding and underestimate the actual volume density for the H2 formation-dissociation equilibrium by a factor of . However, the fact that we additional effort to account for the complex formation and dissociation processes of molecules in such filaments with rather complex geometries. It also remains unknown, whether these structures are related to even smaller and denser structures that may contain a significant amount of baryonic (molecular) dark matter (e.g., Pfenniger, Combes, & Martinet 1994).
One interesting aspect of the detection presented in this paper concerns the line self-shielding of the H2. Since the efficiency of H2 self-shielding mostly depends on the H2 column density, small filaments with low neutral gas column densities (such as the IVC H2 filament towards Sk -68 80) are not able to shield their molecular interior completely from the dissociating UV radiation. This probably prevents the the formation of CO (but see Heithausen (2002) for higher-column density gas) and keeps the gas from turning completely molecular. At a given volume density distribution and H2 grain formation rate, the molecular gas fraction at every point in such a filament is determined completely by the intensity of the ambient UV radiation field. Thus, if the volume density distribution in the filament does not change dramatically in time, the UV field stabilizes the molecular fraction in the filament at a moderate level and may prevent a further fragmentation. Switching off the external UV field would rapidly increase the molecular fraction at each point, the self-shielding would become more efficient, and the structure may turn completely molecular. If the ISM favors the formation of low-column density filamentary structure instead of the large-column density clouds, this could be a very efficient way to suppress rapid star formation in dynamically quiescent regions of galaxies 111Here, dynamically quiescent means that no local star formation and supernova explosions are present, which would dominate the evolution of the surrounding ISM by way of shocks and compression., because the gas is confined to very small gas pockets that cannot turn completely molecular due to the lack of efficient self-shielding.
The many detections of H2 in IVCs (R03) imply that halo clouds respresent an excellent laboratory to study diffuse molecular gas and its small-scale structure because of the velocity separation of these clouds from strong local disk components and the moderate gas column densities that characterize these clouds. In the local ISM, such small-scale H2 filaments (if they exist) might be invisible because their radial velocities along a given line of sight through the disk would not be significantly different from those of the high-column density disk clouds. High-column density absorbers would clearly dominate the H2 absorption spectrum and completely overlap the much weaker absorption caused by low-column density filaments. Such filaments in the disk would therefore remain unnoticed. The detection of H2 in solar-metallicity IVCs in comparison to the non-detection of H2 in the metal-poor HVC Complex C (Richter et al. 2001b) supports our original idea that observations of H2 are helpful to distinguish between the various processes that are responsible for the phenomenon of IVCs and HVCs in the Milky Way halo (Richter et al. 1999).
With the large number of UV bright stars distributed over a relatively small area of the sky, the LMC provides an excellent backdrop to study small-scale structure in the halo IVC and HVC gas in front of it. Additional high S/N FUSE data would be helpful in searching for other directions in which H2 halo absorption might be present. High-resolution optical data for Sk -68 80 and other sight lines are required to better understand the velocity structure of the halo gas in front of the LMC and to derive accurate values. This will be crucial to test the conclusions we have drawn in this paper from the intermediate-resolution FUSE data.
Acknowledgements.
This work is based on data obtained for the the Guaranteed Time Team by the NASA-CNES-CSA FUSE mission operated by the Johns Hopkins University. Financial support has been provided by NASA contract NAS5-32985. P.R. is supported by the Deutsche Forschungsgemeinschaft. JCH recognizes support from NASA grant NAG5-12345. We thank K.S. de Boer and W.P. Blair for helpful comments.References
- (1) Anders E. & Grevesse N. 1989, Geochim. Cosmochim. Acta 53, 197
- (2) Abgrall H. & Roueff E. 1989, A&A 79, 313
- (3) Bluhm H., de Boer K.S., Marggraf O., & Richter P. 2001, A&A 367, 299
- (4) Danforth C.W., Howk J.C., Fullerton A.W., Blair W.P., & Sembach K.R. 2002, ApJS 139, 81
- (5) de Paolis F., Ingrosso G., Jetzer P., Qadir A., & Roncadelli M. 1995, A&A 299, 647
- (6) Draine B. & Bertoldi F. 1996, ApJ 468, 269
- (7) Faison M.D., Goss W.M., Diamond P.J., & Taylor G.B. 1998, AJ 116, 2916
- (8) Frail D.A., Weisberg J.M., Cordes J.M., & Mathers C. 1994, ApJ 427, 43
- (9) Grevesse N. & Noels A. 1993, in: Orgin of the Elements, ed. N. Prantzos, E. Vangioni-Flam, & M. Cassé, (Cambridge: Univ. Press), 15
- (10) Heiles C. 1997, ApJ 481, 193
- (11) Heithausen A. 2002, A&A 393, L41
- (12) Holweger H. 2001, in “Solar and Galactic Composition”, AIP Conference Proceeding 598, ed. R.F. Wimmer-Schweingruber, (New York: American Institute of Physics), 23
- (13) Houck J.C. & Bregman J.N. 1990, ApJ 352, 506
- (14) Howk J.C., Savage B.D., Sembach K.R., & Hoopes C.G. 2002, ApJ 572, 264
- (15) Lauroesch J.T. & Meyer D.M. 1999, ApJ 519, L181
- (16) Lauroesch J.T., Meyer D.M., & Blades J.C. 2000, ApJ 543, 43
- (17) Lu L., Sargent W.L.W., Savage B.D., Wakker B.P., Sembach K.R., & Oosterloo T.A. 1998, AJ 115, 162
- (18) Massey P., Waterhouse E., & DeGioia-Eastwood K. 2000, AJ 119, 2214
- (19) Meyer D.M. & Lauroesch J.T. 1999, ApJ 520, L103
- (20) McGee R.X. & Newton L.M. 1986, PASA 6, 358
- (21) Moos H.W., et al. 2000, ApJ 538, L1
- (22) Morton D.C. 1991, ApJS 77, 119
- (23) Pfennifer D., Combes F., & Martinet L. 1994, A&A 285, 79
- (24) Richter P., Hilker M., & Richter T. 1999, A&A 350, 476
- (25) Richter P., de Boer K.S., Widmann H., Kappelmann N., Gringel W., Grewing M., & Barnstedt J. 1999, Nature 402, 386
- (26) Richter P., Savage B.D., Wakker B.P., Sembach K.R., & Kalberla P.M.W. 2001a, ApJ 549, 281
- (27) Richter P., Sembach K.R., Wakker B.P., & Savage B.D. 2001b, ApJ 562, L181
- (28) Richter P., et al. 2001c, ApJ 559, 318
- (29) Richter P., Wakker B.P., Savage B.D., & Sembach K.R. 2003, ApJ 586, 230
- (30) Sahnow D.J., et al. 2000, ApJ 538, L7
- (31) Savage B.D. & de Boer K.S. 1979, ApJ 230, L77
- (32) Savage B.D., Drake J.F., Budich W., & Bohlin R.C. 1977, ApJ 216, 291
- (33) Shapiro P.R. & Field G.B. 1976, ApJ 205, 762
- (34) Shull J.M. & Beckwith S. 1982, ARA&A 20, 163
- (35) Staveley-Smith L., Kim S., Calabretta M.R., Haynes R.F., & Kesteven M.J. 2002, MNRAS, in press (astro-ph 0210501)
- (36) Tumlinson J., et al. 2002, ApJ 566, 857
- (37) von Braun K., Mateo M., Chiboucas K., Athey A., & Hurley-Keller D. 2002, AJ 124, 2067
- (38) Wakker B.P., et al. 1999, Nature 402, 388
- (39) Wakker B.P. 2001, ApJS 136, 463
- (40) Welty D.E., Frisch P.C., Sonneborn G., & York D.G. 1999, ApJ 512, 636
- (41) Wolfire M.G., McKee C.F., Hollenbach D., & Tielens A.G.G.M. 1995, ApJ 453, 673
Appendix A Sk -68 82 and other LMC sight lines
A.1 LMC sight lines sampled by FUSE
The LMC consists of a large number of UV bright stars that are, in principle, suitable as background sources for absorption-line spectroscopy of intervening interstellar material. So far, FUSE has observed several dozen stars in the LMC as part of various Principle-Investigator (PI) and Guest-Investigator (GI) programs. An atlas of FUSE spectra of Magellanic Cloud stars is provided by Danforth et al. (2002). We have taken a closer look at the FUSE LMC data to identify other sight lines that could be used to study intermediate- and high-velocity H2 gas. In many cases, absorption from the IVC and HVC components are quite weak (a good indicator for this is the strong Fe ii line; see Figs. 3-59 from Danforth et al. 2002). In other spectra the S/N is low, or the stellar continuum has a very irregular shape at small scales ( Å). For these cases, the identification of H2 at IVC and HVC velocities is hampered by the low data quality. Only a few sight lines (e.g., Sk -67 101 and Sk -67 104) exhibit relatively strong IVC/HVC absorption at good S/N and a reliable continuum, but no convincing evidence for H2 absorption in the halo components is found from a first inspection. These spectra, however, will be useful to study in detail the atomic gas in the IVC and HVC components in combination with high-resolution optical data that will be necessary to disentangle the sub-component structure.
A.2 Sk -68 82
One special case that we want to highlight is the spectrum of Sk -68 82 (HD 269546), the sight line where the phenomenon of H2 absorption in intermediate- and high-velocity gas was found for the first time in low S/N ORFEUS data (Richter et al. 1999; Bluhm et al. 2000). The ORFEUS H2 findings in the IVC/HVC gas in front of the LMC were coincidental detections during a project searching for H2 absorption in the LMC (Richter 2000). The presence of IVC/HVC H2 is evident at a level in the composite velocity profile of H2 for which we had co-added various H2 transitions for to study the general velocity distribution of the H2 towards Sk -68 82 in the ORFEUS data. In individual lines, however, H2 is detected at low significance (; see Richter et al. 1999, Bluhm et al. 2000) due to the low S/N in the data, so that the H2 column densities, values, and excitation temperatures derived for the IVC and HVC gas are quite uncertain.
We have re-investigated this sight line with much higher quality FUSE data of Sk -68 82 to check the previous results and conclusions. The FUSE data for Sk -68 82 (program IDs P2030101-P2030104) were reduced with the CALFUSE v2.05 pipeline in a fashion similar to the data for Sk -68 80. A detailed inspection of the spectrum shows that the continuum flux of Sk -68 82 is much more irregular and complicated than for Sk -68 60, in particular at scales Å. These irregularities in the continuum complicate the interpretation of interstellar absorption more than was evident from the lower quality ORFEUS data. Fig. A.1 shows several atomic and H2 absorption profiles for Sk -68 82. For each line we show the normalized flux plotted against the LSR velocity. The profiles are normalized to a smooth continuum that describes the background flux on scales Å. We cannot account for the many structures and features in the continuum at smaller scales ( Å), so that absorption components with small equivalent widths (such as the IVC and HVC H2 absorption) exhibit quite irregulary shaped absorption profiles. The two upper panels show absorption by Fe ii and C i . These two lines lie in regions of the spectrum where the choice of the continuum is less critical than for the regions in which most of the H2 lines are located (Å). The velocity distribution of Fe ii absorption is very similar to that of Sk -68 80 (see Fig. 2). C i absorption towards Sk -68 82 is seen not only in the local Galactic gas, but also in the HVC component near km s-1. The IVC component is (as for Sk -68 80) blended by local C i* absorption. The presence of C i at km s-1 suggests the presence of a cool, dense gas component in the HVC, since C i is easily ionized in warm diffuse gas (the ionization potential of C i is eV). The atomic HVC gas towards Sk -68 82 has a much lower value ( km s-1), but higher column densities ( dex for O i and dex for Fe ii and Si ii) than the HVC component towards Sk -68 80. Obviously, small scale structure exists on scales that separate these two stars on the sky ( arcmin). Thus, the new FUSE data imply that the 32 arcmin beam H I 21cm column density is, despite earlier attempts (Richter et al. 1999; Bluhm et al. 2000), not a good reference to calculate precise gas-phase abundances for this cloud.
The interpretation of the H2 absorption towards Sk -68 82 is much more difficult than for Sk -68 80 due to the difficult continuum situation in the wavelength range of the H2 Lyman- and Werner bands. Fig. A.1 shows some examples for the H2 absorption line profiles towards Sk -68 82. For many lines, in particular for rotational states , H2 absorption extends from to km s-1, but is overlapped by the small-scale structure in the continuum. In order to minimize the effects of the (randomly distributed) continuum small-scale structure, we have co-added H2 lines from the rotational states (Fig. A.1, lower-most panel) to analyze the general H2 velocity distribution in the FUSE data of Sk -68 82. As the cumulative H2 absorption profile confirms, H2 is present at IVC and HVC velocities, but is smeared over the velocity range from to km s-1, and a clear component structure is still not readily visible. There are significant discrepancies in the shape of some H2 lines between the FUSE and the older ORFEUS data (e.g., W Q(2),0-0 ; see Richter et al. 1999 and Fig. A.1). Given the low S/N in the ORFEUS data and the resulting uncertainties (Table 1 in Richter et al. 1999), these differences can be easily explained by noise structures in the ORFEUS data. However, since the background star (together with the LMC) has a substantial transversal motion behind the Milky Way halo gas, such differences could also arise from small-scale structure within the HVC H2 gas, considering the results for the IVC H2 gas towards Sk -68 80 and the fact that the ORFEUS data for Sk -68 82 was taken years before the FUSE data. Temporal variations of absorption lines in diffuse interstellar gas have been reported by Lauroesch, Meyer, & Blades (2000). Unfortunately, the S/N in the ORFEUS data is too low to test this interesting idea, but future FUSE observations will help to search for such temporal variations. The absorption depths for the IVC and HVC H2 absorption in the FUSE data of Sk -68 82 correspond to total H2 column densities of log (H, depending on the adopted value. We have to realize at this point that we are unable to improve our knowledge about the molecular material in the IVC and HVC towards Sk -68 82 with the high S/N FUSE data. To correct our previous results (Richter et al. 1999, Bluhm et al. 2000) from ORFEUS to a more conservative statement we can now state that H2 is present in the IVC and HVC towards Sk -68 82, but the high S/N FUSE data show that a determination of precise column densities is impossible due to small-scale structure in the continuum. Similarly, without having reliable values for , we cannot derive accurate excitation temperatures for the IVC and HVC gas. The fact that H2 at IVC and HVC velocities is seen in levels up to , however, implies a relatively high degree of rotational excitation, as was already concluded from the ORFEUS data (Richter et al. 1999; Bluhm et al. 2000). The two stars Sk -68 80 and Sk -68 82 are separated by only arcmin. The presence of H2 in the IVC towards both stars suggests that the IVC gas in this general direction of N 144 in the LMC consists of dense, cool material from which H2 bearing filaments can form. A similar conclusion holds also for the HVC component, in which H2 is present towards Sk -68 82 and possibly also towards Sk -68 80 (see Sect. 4).