A Variable Ultraluminous Supersoft X-ray Source in “The Antennae”:
Stellar-Mass Black Hole or White Dwarf?
Abstract
The Chandra monitoring observations of The Antennae (NGC 4038/39) have led to the discovery of a variable, luminous, supersoft source (SSS). This source is only detected at energies below 2 keV and, in 2002 May, reached count rates comparable to those of the nine ultraluminous X-ray sources (ULXs) detected in these galaxies. Spectral fits of the SSS data give acceptable results only for a 100–90 eV blackbody spectrum with an intrinsic absorption column of . For a distance of 19 Mpc, the best-fit observed luminosity increases from 1.7 erg s-1 in 1999 December to 8.0 erg s-1 in 2002 May. The intrinsic, absorption-corrected best-fit luminosity reaches 1.4 erg s-1 in 2002 May. The assumption of unbeamed emission would suggest a black hole of 100 M⊙. However, if the emission is blackbody at all times, as suggested by the steep soft spectrum, the radiating area would have to vary by a factor of 103, inconsistent with gravitational energy release from within a few Schwarzschild radii of a black hole. Viable explanations for the observed properties of the SSS are provided by anisotropic emission from either an accreting nuclear-burning white dwarf or an accreting stellar-mass black hole.
1 Introduction
At a distance of 19 Mpc (), NGC 4038/39 (The Antennae) have long been studied as the nearest example of a galaxy pair undergoing a major merger (Toomre & Toomre 1972). In the X-ray band of 0.1–10 keV, the first Chandra observation of this system in 1999 December revealed an extraordinarily rich population of luminous point-like sources (Fabbiano et al. 2001). We are now in the midst of a year-long Chandra monitoring program of The Antennae. The first results of this program, on the luminosity and spectral variability of nine ULXs (see Fabbiano 1989 and Makishima et al. 2000 for earlier work on ULXs), detected with luminosities , are reported in Fabbiano et al. (2002).
Here we report the discovery of a very luminous, variable, supersoft source in the Antennae galaxies. While SSSs with blackbody spectra of 40–100 eV have been detected in several galaxies (e.g., in Local Group galaxies: Greiner 1996; M81: Swartz et al. 2002; M101: Pence et al. 2001), their typical luminosities do not exceed erg s-1 and are mostly lower than erg s-1. These sources are believed to be the result of nuclear burning on the surface of accreting white dwarfs in binary systems (van den Heuvel et al. 1992; see also Kahabka & van den Heuvel 1997). However, the source of interest here, CXOANT J120151.6185231.9 (= Source 13 of the Zezas et al. 2002a list), may reach luminosities in excess of erg s-1.
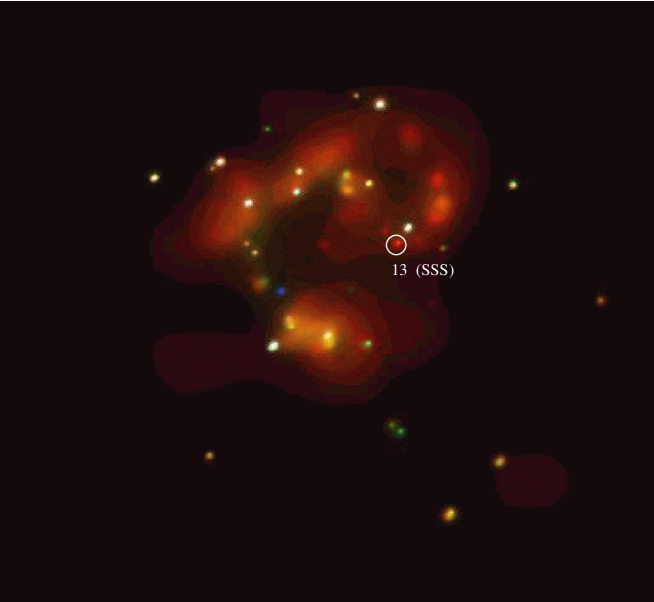
Source 13 was first detected in 1999 December with a count rate 4 times below that of the ULX range. It is indicated by a circle in fig. 1. Our monitoring of The Antennae shows that this source reached a count rate comparable to those of the ULXs in 2002 May, while keeping an unusual, very soft emission. In this paper, we present both the light curve of this source and a spectral study of its emission.
2 Observations and Analysis
Table 1 summarizes the log of the four Chandra ACIS-S3 (Weisskopf et al. 2000) observations of The Antennae discussed in the present paper, and lists the observing times after screening for background flares. Details of the data analysis are given in Fabbiano et al. (2003). This analysis includes astrometric correction of the 2001 December, 2002 April, and 2002 May observations to the 1999 December coordinates, and source detection in four spectral bands following the prescriptions by Zezas et al. (2002a): Full band (0.3–7.0) keV; soft (0.3–1.0) keV; medium (1.0–2.5) keV; and hard (2.5–7.0) keV. The data were corrected for spatial and spectral variations of the ACIS-S3 response, including the time-variable ACIS-S3 effective area111http://asc.harvard.edu/cal/Acis/Cal_prods/qeDeg/ 222http://www.astro.psu.edu/users/chartas/xcontdir/xcont.html. This correction results in a factor of 1.8 increase of the count rate in the last three observations, when compared with the 1999 December data. The back-illuminated ACIS-S3 CCD is not affected by the energy response degradation experienced by the front-illuminated CCDs; therefore the CTI correction is not relevant here.
Figure 2 shows the light-curve of Source 13 in the 0.3–7.0 keV band. We observe a 8-fold increase of the corrected count rate from 1999 December to 2002 May. While detected at sub-ULX count rates in the 1999 December data (Zezas et al. 2002a), in May 2002 the count rate is in the range of the ULX count rate in The Antennae (corresponding to erg s-1, for a 5 keV bremsstrahlung spectrum), but the spectrum is much softer than the spectra of the other ULXs. This source remains undetected in the hard band, and only the color can be derived. This color is 0.880.04, significantly softer than the typical ULX colors that all lie in the 0.2 to 0.4 range (Fabbiano et al. 2003).
We used XSPEC for the spectral analysis (see Zezas et al. 2002a). Source counts were extracted from circles of 3 pixel (1.5″) radius, with background estimated from surrounding annuli. The data from each observation were fitted with a variety of models, available in the XSPEC library, including blackbody, disk-blackbody (used in the ASCA studies of ULXs, see Makishima et al. 2000), bremsstrahlung, Raymond-Smith thin-plasma model (RS), and power-law. A variable absorption column was included in each model. Spectral analysis was performed on data at energies 0.3–7.0 keV for all the data sets, binned so that there were at least 25 counts in each bin. Typically, extremely few spectral counts were detected above 2 keV in the 2002 May data, and above 1 keV in the earlier observations, when the source was fainter. This binning results in four bins for the 1999 December observation, when the source was faintest. To verify that the determination of was not affected by calibration uncertainties, we also (a) ran our spectral analysis excluding data below 0.6 keV (to avoid the Oxygen edge) and (b) added an edge to the models. In all cases, we obtained consistent results.
The RS model is a bad fit for all the data sets. Blackbody, disk-blackbody and bremsstrahlung all give similar quality fits. Best-fit kT is in the range of 150-90 eV for the blackbody model, 110-220 eV for the disk-blackbody, and 120-370 eV for the bremsstrahlung. The power-law model is acceptable for the first and third datasets, but gives a bad fit for the higher statistics 2002 May data; it is also marginal for the 2001 December data. In general power-law indeces tend to be very large, reflecting the very soft spectra. These results, including the best fit and the degrees of freedom (number of bins minus fit parameters) are summarized in Table 2, where the errors are 1 for 1 interesting parameter. To verify that different binning did not affect our results in our lowest count rate dataset (1999 December), we also analyzed these data with 15 counts per bin, as in Zezas et al. (2002a), obtaining consistent results.
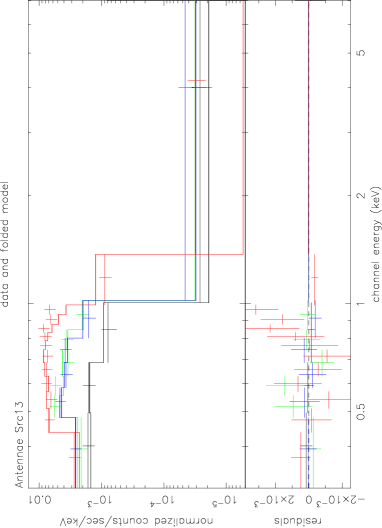
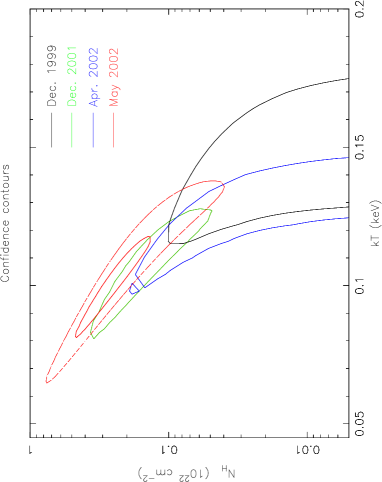
The best-constrained results are from the 2002 May observation, when the source was most luminous: the temperature then was eV for the blackbody model, 110 eV and 120 eV for the disk-blackbody and the bremsstrahlung models, respectively. The fits also suggest a large absorption column , depending on the model. For the rest of this paper we will assume that the emission is optically thick, and for simplicity use the blackbody model. Use of the disk-blackbody model would not change our conclusions. Figure 3 shows the data, best-fit blackbody models, and residuals. Figure 4 shows the 1 2-parameter – confidence contours. For the 2002 May data we also show the 99% confidence contour. Fitting a two-component model (blackbody or disk-blackbody plus power-law) did not produce a significant improvent of the fit.
The observed best-fit source luminosity (0.1–2 keV) varies from 1.7 erg s-1 in 1999 December to 8 erg s-1 in 2002 May (Table 3). These values can be considered to be lower limits to the intrinsic source luminosity, since no extinction correction has been applied. The intrinsic (i.e., emitted) best-fit luminosity is significantly larger in 2002 May, because of the large required by the fit, and reaches 1.4 erg s-1. In 2002 May, we estimate a minimum intrinsic luminosity of erg s-1 by calculating the flux for the 1 lower limit on both and . If the emission of the SSS is due to nuclear burning on a white dwarf (WD) surface (van den Heuvel et al. 1992), a hot WD atmosphere may be more physical than a simple blackbody. However, based on the results of Swartz et al. (2002), we estimate that the adoption of a model WD atmosphere will result in less than a factor of 2 change in the estimated luminosity.
3 Discussion
What is this supersoft, luminous, variable source? The large absorption column and the lack of an obvious identification in the HST WFPC2 data (Zezas et al. 2002b) exclude a foreground object. Given the low density of supersoft AGNs (Puchnarewicz 1998), the likelihood that this source could be a background object is low. If this source belongs to The Antennae, it is the most luminous galaxian SSS ever detected. Our observations suggest that the source has a thermal spectrum. Although the uncertainties are large, the best-fit temperature does not seem to increase with luminosity. Taken at face value, this behavior is incompatible with isotropic emission from a constant radiating area. In the following analysis, we investigate these trends systematically.
King & Puchnarewicz (2002) show that blackbody emission from a region of size times the Schwarzschild radius of a mass obeys the relations
| (1) |
| (2) |
where is the inferred isotropic luminosity of the blackbody, the true source luminosity, the beaming factor that accounts for eventual non-spherical emission, the Eddington factor, a measure of the geometrical deviation from a spherical photosphere, and the source temperature in units of 100 eV.
Dividing (1) by (2) gives in terms of , where . Dividing (1) by the square of eq. (2) gives in terms of , and we can deduce in terms of . We calculate these quantities (listed in Table 3) from the results of Table 2 for the blackbody spectrum. It is easy to show from Table 1 that , so that
| (3) |
Thus at most one of the three quantities can be constant. We consider three cases.
(i) Near-isotropic emission from an intermediate-mass black hole (). Given the peak luminosity of the SSS, this case requires a black-hole mass 100 M⊙(cf Miller et al. 2003) However, the large increase (a factor 1000) in radiating area is very hard to reconcile with a simple picture in which a black hole accretes from an accretion disk and the blackbody emission comes from a region of a few Schwarzschild radii. Column 3 of Table 3 shows that must increase by a factor 81 between the 1st and 4th observations; for this type of geometry we clearly have , so the radius factor must increase by a factor 25. Since the blackbody emission comprises most of the putative accretion luminosity, it must come from deep within the potential well, i.e., a few. So, if we (generously) set in Observation 4, the emission must be confined to an implausibly small region of only 0.1 Schwarzschild radii in Observation 1.
Although the backbody fits point to the exclusion of an massive black hole, this conclusion is not iron-clad. It hinges on the assumption that the 1999 December emission is indeed a blackbody. As discussed earlier, this is the least well constrained dataset, so that we cannot exclude that the spectrum may follow a power-law distribution. Although the power-law we obtain for the 1999 December data is extremely steep, in excess of typical black-hole binary power-laws, the uncertainties are large (see also Zezas et al 2002a). Power-law components have been seen to dominate the emission in ULXs in low state (see, e.g. La Parola et al. 2001; Kubota et al. 2001; Fabbiano et al 2003). If the first observation is discarded from the blackbody analysis of Table 2, the required radius increase between observations 2 and 4 is reduced to a factor . If we only consider observations 3 and 4, we obtain a radius increase of a factor of . It remains to be demonstrated how this smaller increase would fit into an intermediate–mass black hole picture.
(ii) Varying beaming at constant luminosity. An opposite extreme from the near-isotropic case is constant, in which case decreases by a factor 139 between Observations 1 and 4. The last column of Table 1 then shows that must simultaneously increase by a factor 10. Physically, holding constant while other quantities vary widely is plausible only in one situation, namely that the source is radiating constantly at the Eddington limit () while the accretion rate may change. In this case the range of is . The column of Table 1 then shows that in Observation 4, giving the radiating object a radius of . For , this radius is suggestively close to the radius of a white dwarf. This is not surprising, as the inferred temperature and luminosity are now typical of supersoft X–ray binaries, which are thought to be powered by nuclear burning of matter accreting on to a white dwarf.
If the SSS is an accreting WD, our results would be consistent with an increasingly super-Eddington accretion flow ( M⊙yr-1 for steady nuclear burning on a WD surface). As increases beyond , the flow geometry apparently changes gradually from a thin disk (1999 December), with burning on a narrow, isotropically emitting () equatorial band () on the white dwarf, to a thick disk with burning on most of the WD surface (), but now with a strongly anisotropic radiation pattern () in our direction. The most likely cause of this anisotropy is warping of the accretion disk. We note that disks are known to warp in supersoft X-ray binaries (Southwell et al. 1997), essentially because of their proximity to the Eddington limit. At still higher nuclear burning on white dwarfs drives either envelope expansion where the source swells up to red-giant dimensions, or a vigorous wind outflow, or both (cf Hachisu et al., 1996). In all cases the system is likely to be extinguished as an X-ray source.
(iii) Mildly anisotropic emission () from a stellar-mass black hole. At first sight the photospheric radii of 108–109 cm we deduce from our observations do not appear any more natural for a stellar-mass black hole than for an intermediate-mass one as in (i) above. However, Mukai et al. (2002) have pointed out that accretion at rates comparable to Eddington must lead to outflow, and have shown that the electron scattering opacity of the resulting wind does imply supersoft emission with a photospheric size of this order. The M101 source studied by Mukai et al. (2002) has a supersoft luminosity of order erg s-1 and, hence, does not require anisotropic emission for a black hole mass 10 M⊙. However, their analysis is easily extended to the case that an Eddington-limited source blows out a wind confined to a double cone of total solid angle about the black-hole axis. Since this wind represents the path of lowest optical depth through the accretion flow, the radiation will escape this way also, implying . We follow Mukai et al. (2002) in assuming a constant velocity for the outflowing material, since this material is likely to achieve escape velocity and coast thereafter. We neglect any emission from this wind and compute the Thomson optical depth by integrating the electron density from radius to infinity. Since we find a photospheric radius
| (4) |
where is in units of cm s-1 and is the outflow rate in units of g s-1, the Eddington accretion rate for a 10 M⊙ black hole. Clearly, we must choose a mass of this order for consistency. The luminosity 1038 erg s-1 of Observation 1 is then definitely sub-Eddington, so presumably there is very little outflow and we see down to the inner accretion disk directly in this observation. Observations 2, 3, and 4 are all close to , i.e., . Since and the true blackbody radius cm, we can read off the size of the photosphere directly from the last column of the Table, and also. This gives an inner disk radius of order cm for Observation 1, with cm, cm, and cm for Observations 2, 3, and 4, respectively. Simultaneously increases from 0.1 to 3.1, 0.6, and 11. This is consistent with , 1, 1, and 1 over the four observations and eventually decreasing to a value of 0.10, presumably as rises above the Eddington rate. Self-consistently, the assumed is above the escape value for the values of . Of course, would be larger still if we took a BH mass of 15 M⊙ rather than 10 M⊙, as observed in GRO J1915+105 (Greiner et al. 2001).
The above values are consistent with the suggestion by King et al. (2001) and King (2002) that ULXs are actually X-ray binaries involving stellar-mass black holes, but with mildly anisotropic radiation patterns () resulting from accretion at close to the Eddington rate onto the black hole. The above scenario can arise in two cases (i) thermal-time-scale mass transfer when the companion star in a high–mass X–ray binary fills its Roche lobe, and (ii) bright outbursts of soft X–ray transients (King, 2002). The first case is dominant in most galaxies, although the second must account for ULXs in ellipticals. Confirmation that this is a reasonable explanation for ULXs as a class comes from Grimm, Gilfanov, & Sunyaev (2002), who show that—when normalized by the star formation rate—ULXs form a natural extension to the luminosity function of high-mass X-ray binaries in nearby galaxies.
4 Conclusions
We have discovered a variable SSS ( keV) in The Antennae, Source CXOANT J120151.6185231.9, which reached a peak intrinsic luminosity of erg s-1 in 2002 May.
Near-isotropic emission from an intermediate-mass black hole accreting from a disk would be incompatible with our observations of this source in the most likely case of soft thermal emission, as the radiating area would have to increase by more than a factor 1000 over the four observations. There remains a less likely possibility that the 1999 December emission may be due to a low-intensity power-law dominated state (e.g. Kubota et al. 2001), in which case the required area increase is reduced to a less demanding factor 10.
A possible solution is a white dwarf with M⊙, accreting at the Eddington limit () and with a variable beaming factor. This explanation has the advantage of giving a natural scale for the deduced photospheric radius, but does require extreme beaming (up to ) .
A second possible solution involves outflow from a stellar-mass black hole, accreting near the Eddington limit (Mukai et al. 2002). A consistent explanation of our observations results if this hypothesis is combined with the suggestion by King et al. (2001) that ULXs are actually X-ray binaries involving stellar-mass black holes, but with mildly anisotropic radiation patterns ().
The stellar-mass black hole solution is the more conservative choice in the present case, as it does not require as extreme an anisotropy as a white dwarf. However the latter may remain a realistic candidate for slightly less luminous supersoft ULXs.
References
- Fabbiano (1989) Fabbiano, G. 1989, ARA&A, 27, 87
- Fabbiano et al. (2001) Fabbiano, G., Zezas, A., & Murray, S. 2001, ApJ, 554, 1035
- Fabbiano et al. (2003) Fabbiano, G., Zezas, A., King, A. R., Ponman, T. J., Rots, A., Raymond, J., & Schweizer, F. 2002, ApJ(letters), in press
- Greiner (1996) Greiner, J. 1996, in Supersoft X-ray Sources, ed. J. Greiner (Berlin: Springer), 299
- Greiner et al. (2001) Greiner, J., Cuby, J.G., & McCaughrean, M.J. 2001, Nat, 414, 522
- Grimm et al. (2002) Grimm, H.-J., Gilfanov, M., & Sunyaev, R. MNRAS, in press (astro-ph/0205371)
- (7) Hachisu, I., Kato, M., Nomoto, K., 1996, ApJ, 470, L97
- Kahabka & van den Heuvel (1997) Kahabka, P. & van den Heuvel, E. P. J. 1997, ARA&A, 35, 69
- King (2002) King, A.R. 2002, MNRAS, 335, L13
- King et al. (2001) King, A.R., Davies, M.B., Ward, M.J., Fabbiano, G., & Elvis, M. 2001, ApJ, 552, L109
- King & Puchnarewicz (2002) King, A. R., & Puchnarewicz, E. M. 2002, MNRAS, 336, 445
- Kubota et al (2001) Kubota, A., Mizuno, T., Makishima, K., Fukuzawa, Y., Kotohu, J., Ohnishi, T. & Tashiro, M. 2001, ApJ, 547, L119
- La Parola et al (2001) La Parola, V., Peres, G., Fabbiano, G., Kim, D.-W., & Bocchino, F. 2001, ApJ, 556, 47.
- Makishima et al. (2000) Makishima, K. et al. 2000, ApJ, 535, 632
- Miller et al (2003) Miller, J. M., Fabbiano, G., Miller, M. C., & Fabian, A. C. 2003, ApJ(letters), in press (astro-ph/0211178)
- Mukai et al. (2002) Mukai, K., Pence, W.D., Snowden, S.L., & Kuntz, K.D. 2002, ApJ, in press (astro-ph/0209166)
- Pence et al. (2001) Pence, W. D., Snowden, S. L., & Mukai, K. 2001, ApJ, 561, 189
- Pringle (1997) Pringle, J. E. 1997, MNRAS, 292, 136
- Puchnarewicz (1998) Puchnarewicz, E. M. 1998, MNRAS, 299, 299
- Southwell et al. (1997) Southwell, K.A., Livio, M. & Pringle, J.E., 1997, ApJ, 478, L29
- Stark et al. (1992) Stark, A. A., Gammie, C. F., Wilson, R. W., Bally, J., Linke, R. A., Heiles, C., & Hurwitz, M. 1992, ApJS, 79, 77
- Swartz et al. (2002) Swartz, D. A., Ghosh, K. K., Suleimanov, V., Tennant, A. F., & Wu, K. 2002, ApJ, 574, 382
- Toomre & Toomre (1977) Toomre, A. & Toomre, J. 1972, ApJ, 178, 623
- van den Heuvel et al. (1992) van den Heuvel, E. P. J., Bhattacharya, D., Nomoto, K., & Rappaport, S. A. 1992, A&A, 262, 97
- Weisskopf et al. (2000) Weisskopf, M., Tananbaum, H., Van Speybroeck, L. & O’Dell, S. 2000, Proc. SPIE 4012 (astro-ph 0004127)
- (26) Zezas, A., Fabbiano, G. Rots, A. H., & Murray, S. 2002a, ApJS, 142, 239
- (27) Zezas, A., Fabbiano, G. Rots, A. H., & Murray, S. 2002b, ApJ, 577, 710
| OBSID | Date | Net Exp. |
|---|---|---|
| (Ks) | ||
| 315 | 1999-12-01 | 75 |
| 3040 | 2001-12-29 | 64 |
| 3043 | 2002-04-18 | 61 |
| 3042 | 2002-05-31 | 67 |
| OBSID | B. Body | Disk-BB | Bremss. | RS | PO | ||||||||||
|---|---|---|---|---|---|---|---|---|---|---|---|---|---|---|---|
| kT | kTin | kT | kT | ||||||||||||
| keV | d.o.f. | keV | d.o.f. | keV | d.o.f. | keV | d.o.f. | d.o.f. | |||||||
| 315 | 1.3 | 0.43 | 0.3 | 13.4 | 0.23 | ||||||||||
| 1 | 1 | 1 | 1 | 1 | |||||||||||
| 3040 | 4.0 | 3.8 | 3.6 | 11.4 | 6.18 | ||||||||||
| 4 | 4 | 4 | 4 | 4 | |||||||||||
| 3043 | 2.2 | 1.91 | 1.64 | 0.1 | 18.5 | 2.17 | |||||||||
| 3 | 3 | 3 | 3 | 3 | |||||||||||
| 3042 | 21.7 | 22.4 | 23.5 | 44.7 | 39.2 | ||||||||||
| 10 | 10 | 10 | 10 | 10 | |||||||||||
| OBSID | |||||
|---|---|---|---|---|---|
| erg s-1 | erg s-1 | ||||
| (1) | (2) | (3) | (4) | (5) | (6) |
| 315 | 0.17 | 0.17 | 1.33 | ||
| 3040 | 0.43 | 3.9 | 30.5 | ||
| 3043 | 0.53 | 0.8 | 6.2 | ||
| 3042 | 0.80 | 13.8 | 108 |

|
|
|