2Space Research Institute, Moscow, Russia
Bright stars and an inactive disk in Sgr A∗ and other
dormant galaxy centers. I. The optically thick disk.
Cold inactive disks are believed to exist in Low Luminosity AGN (LLAGN). They may also exist in the nuclei of inactive galaxies and in the center of our own Galaxy. These disks would then be embedded in the observed dense nuclear stellar clusters. Making the simplest assumption of an optically thick disk, we explore several ways to detect the disk presence through its interaction with the cluster. First of these is the eclipses of close bright stars by the disk. The second is the increase in the infrared flux of the disk due to illumination of its surface by such stars during close passages. Finally the surface brightness of the star cluster should show an anisotropy that depends on the inclination angle of the disk. We apply the first two of the methods to Sgr A∗, the super massive black hole in our Galactic Center. Using the orbital parameters of the close star S2, we strongly rule out a disk optically thick in the near infrared unless it has a relatively large inner hole. For disks with no inner holes, we estimate that the data permit a disk with infrared optical depth no larger than about 0.01. Such a disk could also be responsible for the detected 3.8 m excess in the spectrum of S2. The constraints on the disk that we obtain here can be reconciled with the disk parameters needed to explain the observed X-ray flares if dust particles in the disk have sizes greater than m. The destruction of small dust particles by strong UV heating and shocks from star passages through the disk, and grain growth during “quiescent” times, are mentioned as possible mechanisms of creating the unusual grain size distribution. We estimate the emissivity of the thin layer photo-ionized by the star in Hydrogen Br line and in the continuum recombination in the 2.2 m band, and find that it may be detectable in the future if the disk exists.
Key Words.:
accretion, accretion disks – dust, extinction – eclipses – Galaxy: center – stars: individual (S2)1 Introduction
In the last decade or so, dramatic improvements in the capabilities of the infrared instruments (e.g., Ott et al. 2003) produced unprecedentedly high quality data on the distribution of stars in Sgr A∗ (e.g., Genzel et al. 2003; Ghez et al. 2003a) and in the centers of other inactive galaxies. These high quality data prove that a super massive black hole (SMBH) exists in the center of our Galaxy (e.g., Schödel et al. 2002; Ghez et al. 2003b) and that the majority of the bright stars in Sgr A∗ cluster are early-type stars (Gezari et al. 2002; Genzel et al. 2003), rising interesting questions about the star formation history in the vicinity of Sgr A∗.
In analogy to the disks present in LLAGN (e.g., Miyoshi et al. 1995; Quataert et al. 1999; Ho 2003), a thin inactive (i.e. formerly accreting; Kolykhalov & Sunyaev 1980) disk may exist in Sgr A∗. In addition, the disk presence may help to explain (Nayakshin 2003; Nayakshin & Sunyaev 2003; Nayakshin, Cuadra & Sunyaev 2003) two major mysteries of Sgr A∗: its amazingly low luminosity (e.g., see Baganoff 2003, and reviews by Melia & Falcke 2001 and Narayan 2002) and the recently discovered large amplitude X-ray flares (Baganoff et al. 2001). Direct observational detection of the disk could be possible if the disk were massive and thus bright enough (e.g., Falcke & Melia 1997 and Narayan 2002) but a very dim inactive disk could have eluded such a detection (Nayakshin et al. 2003).
Nayakshin & Sunyaev (2003) pointed out that the three dimensional orbits of stars such as S2 could be used to test the putative disk hypothesis. Here we extend the work of these authors by doing a much more through analysis of the parameter space as well as including new physics. In particular, under the simplest assumption of an optically thick disk, we discuss three methods to do so: (i) stellar eclipses; (ii) re-processing of the stellar UV and visible radiation into infrared; (iii) asymmetry of the integrated star cluster light. We apply the first two of the methods to the star S2, whose orbit is currently known the best out of all the close sources in Sgr A∗ cluster. We find (§2) that absence of eclipses for S2 could be explained by a disk with a “large” inner hole, , for a rather broad range in the disk orientations. Note that for a distance of 8 kpc to the Galactic Center, 1″ corresponds to cm or , where cm is the gravitational radius for the black hole. The re-processing of the optical-UV luminosity of the star in the infrared, however, creates (§3) a variable and very bright emission in the standard near infrared spectral bands. This emission would add to the total “stellar” flux observed from the source (see Figure 7 below). Considering disks with no inner hole and all possible orientations we find that this additional emission would have been detected by the Genzel et al. and Ghez et al. teams. Therefore an optically thick (in m) disk is ruled out for Sgr A∗ star cluster. We estimate that the maximum near infrared optical depth of the disk that would not violate observational constraints is about 0.01. Finally, the cluster asymmetry measurement is suggested (§4) as means to constrain disk size and orientation in nearby galaxies whose nuclear regions are visible in the optical and UV light. In the discussion section (§5) we summarize our main results.
2 Eclipses (and flares)
2.1 The Method
In this paper we consider an inactive disk optically thick in all relevant frequencies. In our study of the effects of the disk on individual stars, we pick the star S2 (Schödel et al. 2002; Ghez et al. 2003b)111Ghez et al. (2003b) refer to this star as S0-2. as the best example. This is a very bright () star whose orbit is constrained with better precision than that for any other star near Sgr A∗. The existing data on the star positions in the last years cover (Schödel et al. 2002, 2003; Ghez et al. 2003b, see also Figure 2 below) as much as % of its orbit. The coverage will clearly further increase with time. In addition, the star passed mere ″ or about gravitational radii, , from the black hole in the pericenter (Schödel et al. 2002).

Geometrical thickness of a cold disk is very small (see Nayakshin et al. 2003) so we treat the disk as a flat surface. The disk is assumed to be in Keplerian circular rotation and is described by its inner and outer radii: and . An example of the projection of such a disk is shown in Fig. 1. We need two angles to describe the observational appearance of the disk: inclination , between the direction normal to the disk and the line of sight, and rotation , between the West direction and the semi-minor axis of the disk as seen in projection. (Out of the two possible semi-minor axes, we pick the one that lies on the side of the disk closest to the observer.)
Note that the angle is of no importance for disks that have azimuthal symmetry, and is thus rarely defined. For our problem, however, this angle is important since it determines the orientation of the disk relative to stellar orbits. This angle definition is somewhat different from those commonly used to define stellar orbits (see e.g., Roy 1982, §14.8), nevertheless we feel that ours is simpler to use: immediately shows which side of the disk is in front of the plane of the sky centered on Sgr A∗.
We use the S2 orbital parameters given by Schödel et al. (2003) and the sign of the inclination angle measured by Ghez et al. (2003b) to calculate the 3-dimensional positions of the star as a function of time. For each given set of the disk parameters, we determine the parts of the star’s orbit that are eclipsed by the disk (i.e. physically behind the disk) and those that are not. A physically plausible disk should not eclipse any of the star positions measured by Schödel et al. (2002, 2003)222Ghez et al. (2003b) observed this star in similar epochs, so using their data should yield similar constrains.. Note that since the Sun prevents observations of the GC region for about half of a year, there are large portions of the star’s orbit when it simply could not be observed.
The method described in this section can be easily extended to other stars in Sgr A∗, once their orbital parameters are precisely determined. S12 and S14 passed relatively close to Sgr A∗ so they could also be useful in constraining the disk properties. The orbit of S12 is indeed known quite well, except for the sign of its inclination angle (Schödel et al. 2003; Ghez et al. 2003a), so a degeneracy in the 3-dimensional positions remains.
2.2 Sample results


To demonstrate typical results, we present two examples of disks that are not in conflict with the observations of S2. First, we consider a disk with no (or a very small, ) inner hole, outer radius of 0.1”, inclination ∘, and . In this calculation S2 was eclipsed between 2001.7 and 2002.2 (see Fig. 2), and between 2002.75 and 2003.3. The end of the eclipse in 2002.2 coincides with a flare in X-rays and NIR that results from the shock heating of the disk by the star (Nayakshin et al. 2003). The NIR flare may in fact be quite strong due to the disk re-processing of S2 radiation incident on the disk surface, last for months, and be asymmetric (see §3). The same may be said about the second flare in around 2002.75, except that for this one the eclipse begins (rather than ends) with the flare. While fitting the observed data, this set of disk parameters is a rather fine tuned one. Thus such a disk (with ) is likely to be ruled out by future NIR observations of Sgr A∗.
Nayakshin et al. (2003) found that the too frequent crossings of the disk by the close stars in the innermost region of the stellar cluster will actually destroy the disk there. They estimated that the inner radius of the disk may be as large as , roughly 0.01. In addition, the “accretion” disks in LLAGN do appear to have empty inner regions (Quataert et al. 1999; Ho 2003) with similar values for . Similarly, there are arguments for existence of an inner hole in the standard disk surrounding the black hole in Cyg X-1 (Churazov et al. 2001). Thus it is sensible to study a disk with an inner radius . As an example, we take a much larger disk with , , and = 39∘ and = 347∘ (Fig. 3). In this example the star is eclipsed by the disk only once per orbit, not twice as in Figure 2. The star crossed the disk in 2001.8 (producing a flare) and appeared in the projection of the inner disk hole in 2002.2.


An important point to take from Fig. 3 is that the outer disk radius is unconstrained in this case, i.e. it can be arbitrarily large. This is partially due to the “fortunate” orientation of S2 orbit: Ghez et al. (2003b) showed that out of years, the S2 orbital period, the star spent only 0.5 year behind the black hole in the year 2002. If we take the simplest case of , i.e. disk coinciding with the plane of the sky, then only the innermost 2002 points will be eclipsed if . If is greater than about , then the three measured positions of S2 that were behind the plane of the sky in 2002 are observed through the hole and the rest of the star’s orbit is in front of the disk. Therefore in this case there are no eclipses even if the disk is infinitely large.
2.3 Constrains on Disk Size and Orientation
We now search the parameter space to determine the likelihood, in a rough statistical sense, of a disk with some fixed parameters producing no eclipses that would disagree with observations. We make a fine grid in the parameter space (, , and ) for this purpose, and for each combination of these parameters we check whether the disk eclipses any of the measured (Schödel et al. 2002, 2003) star positions. If it does, then this combination of parameters is rejected.
We concentrate first on a disk with . In Fig. 4 we show the maximum disk size, , as a function of the rotation angle, , for three different disk inclination angles . Any value of greater than the respective curve shown in Fig. 4 would produce one or more observable eclipses contradicting the data. It is seen from the Figure that smaller values of the inclination angle generally allow larger disks. This simply reflects the fact that the projected area of the inner missing disk increases as decreases.

If there is no physically preferred orientation of the disk, then all the points in the - parameter space are equally probable. Therefore, to give a rough statistical assessment of the results, we may define probability as the fraction, , of the area in this parameter space that allows the outer radius to be larger than . Fig. 5 shows this fraction for different cases (for a disk with and without an inner hole). If there is no inner hole in the disk, then only 10% of the disk orientations allow outer radius greater than 0.1”. When , this fraction grows to about 1/4. If the inner hole is even larger (0.05”), only a small fraction of the orientations exclude the optically thick disk. This result is at least partially due to the already noted fact that S2 spends only year behind the plane of the sky (Ghez et al. 2003b).

For the sake of the forthcoming data from the new observing season (i.e. in 2003), we added an extra point corresponding to the predicted S2 position on 2003.22. However the effect on the results was rather minor – the fraction changed by only . Finally, since the putative disk is very geometrically thin (, Nayakshin et al. 2003), a nearly edge-on () disk could be rather easily “hidden”.
2.4 Eclipses and flares for S2: Summary
Using the fact that the observations of the S2 star (Schödel et al. 2002, 2003; Ghez et al. 2003b) showed no eclipses in the last 10 years or so we found that an optically thick disk with no inner hole (i.e. ) is allowed for only “small” disks, with outer radii (or about cm). On the other hand, if the disk has an inner hole due to frequent star passages or other reasons, with , then the eclipses are avoided in a large fraction of the parameter space by disks that have relatively small inclination angle . The outer disk radius in this case may be arbitrarily large.
It is important to point out that if the disk is optically thin, with optical depth in the near infrared band, then the eclipses are only partial and therefore harder to observe. Due to the results of the next section we will see that this is the most likely situation for Sgr A∗ inactive disk (if there is any).
3 Disk reprocessed emission
3.1 Setup
The putative disk is heated by the optical and UV radiation of the member stars of Sgr A∗ stellar cluster. The bulk of the absorbed radiation will be re-emitted as the dust thermal emission in infrared frequencies. This radiation may be observable and thus it is desirable to determine the magnitude of the effect. In general the calculation is by no means trivial since the disk may be optically thick in some frequencies and yet optically thin in others, and hence a careful treatment of radiation transfer is needed. However, we will consider only the case of a disk optically thick in all frequencies.
3.1.1 Stellar spectrum
The star S2 is identified as a massive very bright main sequence star of stellar class between B0 and O8. In this range, the corresponding bolometric luminosity of the star is and the temperature is about K (Ghez et al. 2003b). For simplicity, we calculate the “model” spectral luminosity of the star as a pure blackbody with K and . Observations of the Sgr A∗ star cluster in the band (Genzel et al. 2003) showed that S2 has an excess of about 0.6 magnitudes (or 30 mJy for S2’s parameters) in that band, compared with the “normal” colors of the surrounding stars. This excess could be due to contamination of the star spectrum by the reprocessed emission of the disk. What we call below the “observed spectral luminosity” in band is then the blackbody emission described above plus the excess measured by Genzel et al. (2003).
3.1.2 The blackbody emission
The reprocessed disk emission is a function of time. The cooling time of the disk is much shorter than the star’s orbital period (usually by orders of magnitude). The reprocessed emission can then be calculated under the steady state assumption. The disk reprocessed spectrum is thus a function of geometry, i.e. the distance between the star and the disk, . For convenience of this section, we introduce spherical coordinate system in which the disk plane coincides with the plane, and the star is at the axis. The star’s coordinates are thus (, , . (Note that the black hole is offset from the center of these coordinates.)
We assume local black body emissivity for the disk. In this coordinate system the distance from a point in the disk to the star is . We thus treat the star as a point source and the disk as an infinitely thin plane. Clearly this approach is inaccurate for , but we neglect this due to very short duration of such a close approach. The effective temperature of a ring with radius in disk surface is
| (1) |
where is the star luminosity and is the Stefan-Boltzmann constant. Assuming the black body emissivity and integrating over , we arrive at the integrated multicolor black body disk spectrum. If the disk is inclined at angle , an additional factor of should be used.
3.1.3 Photo-ionized layer of the disk
This simple approach (equation 1) to calculating the disk spectrum is an approximation to the more realistic situation. At the temperatures given by equation 1, that are usually K, the main agent responsible for the disk opacity and emissivity is dust. In reality the ionizing UV flux of the star will create a layer of completely ionized hydrogen on the top of the disk. The dominant role in this layer is played by the gas rather than the dust. Within this thin layer, the recombination rate will balance the influx of ionizing photons from the star. Assuming temperature of order K for the layer, we find that its column depth is
| (2) |
where is distance between the star and the disk in units of cm, and is the hydrogen nuclei density in units of cm-3. This column depth is orders of magnitude smaller than that of the putative inactive disk, which was estimated by Nayakshin et al. (2003) to be in the range cm-2 in order to produce luminous enough X-ray flares (depending on the distance from Sgr A∗ and taking model uncertainties into account). The thin layer will re-emit in the optical and the UV the incident stellar radiation. Fraction of the UV flux is emitted back out of the disk, and a fraction is emitted towards the disk, penetrating deeper and ionizing deeper layers. The flux re-emitted below the Lyman limit (and below the corresponding thresholds for photo-ionization of Helium, Oxygen and other abundant elements) can penetrate much deeper in the disk than the original ionizing stellar photons. This radiation will be absorbed chiefly by the dust grains “deep” inside the disk and then be emitted as the blackbody calculated in equation 1.
From this discussion it is clear that in reality a fraction of the incident UV radiation is reflected in the optical-UV band. Correspondingly, this fraction of the incident radiation should not be counted in equation 1. However, for the stellar spectrum that we assume here, i.e. the blackbody with K, only about 20% of the energy is emitted at frequencies above the Lyman limit, and therefore it seems that the shielding effect of the ionized layer should not be very large. Similarly, the dust scattering opacity could in certain wavelengths exceed that for the dust absorption, and then a significant fraction of the incident stellar radiation flux could be reflected back with no change in frequency. However we calculated (using Draine & Lee 1984 optical constants and a Mie code provided by K. Dullemond) the dust opacity for several typical grain sizes and found that this occurs in a rather narrow range of conditions, and hence we neglected this effect.
We also estimated the Brackett (m) line flux from this photo-ionized layer of gas. We used the number of ionizing photons appropriate for a B0 star, a layer temperature of 10,000 K and the case B approximation (see Osterbrock 1989). The resulting equivalent width of this line333This is so for any distance because the line luminosity is const according to equation 2 is 60 Å, about twenty times larger than the absorption in the Br line from the star itself (see Fig. 1 in Ghez et al. 2003b). In addition, we estimated the continuum free-free emission from the photo-ionized layer to yield erg/sec at 2.2 m, which is at the level of a few tenths of S2 spectral luminosity (see Fig. 6), above the current uncertainties in the flux of S2 (see Ott et al. 2003). Thus, if such a strong Brackett and the free-free continuum emission from the disk were present, they should have been detected by now.
However, the above estimates are extremely sensitive to the star’s spectrum. Ghez et al. (2003b) conclude that S2 is an O8-B0 main-sequence star. If we assume that S2 spectral type is B0.5, then the amount of photo-ionizing photons decrease by a factor of . Then both the line and the continuum disk decrease by the same factor. In addition, the PSF in the band is comparable to the size of the emitting area of the disk. It is thus possible that a significant fraction of the ionized layer’s emission would be counted as a background “local” gas emission. Indeed, (Ghez et al. 2003b) note that the background emission accounts for as much as 50 % of S2’s flux. Hence to answer this question quantitatively, one needs to do a much more careful modeling of the disk emission, i.e. convolving the latter with the PSF instead of simply adding the two components.
Finally, due to a much faster disk rotation (compared to 220 km/s for S2; Ghez et al. 2003b) the Br emission line should be 5-10 times broader444Here we assume that the star-disk separation is of order the star’s distance to black hole, , in which case a large fraction of the disk is illuminated by the star. If instead , then the line may be mainly shifted but not significantly broadened. than the line from the star, making it more in line with the observed S2 and “local gas” spectrum (Ghez et al. 2003b).

3.2 Reprocessed emission of an infinite disk
In this section we study the reprocessed disk emission for disks with no inner hole and with an infinitely large outer radius (the disk is then a plane). In Fig. 6 we show the disk spectral luminosity, i.e. , (integrated over the steradian of the sky) for the frequencies corresponding to the infrared bands , and (1.81, 1.38 and 0.79 Hz, or 1.66, 2.18 and 3.80 m, respectively), shown as a function of the star-disk separation . The luminosity of S2 in these three bands is also shown for comparison with the horizontal lines on the bottom of the Figure. On the right vertical axis of the plot, the maximum effective temperature in the disk is shown.
Figure 6 shows that the contribution of the disk can not be ignored for distances few cm. S2 radiates in the Rayleigh-Jeans regime in the near infrared, and therefore only a small fraction of the star’s bolometric luminosity is emitted at these frequencies. The disk captures a half of the star’s bolometric luminosity (mostly optical-UV) and re-processes it into much smaller frequencies. Therefore the near infrared disk emission can be much brighter than the star. The distance of cm is quite large in comparison with S2’s pericenter ( cm), and is of the order of S2’s apocenter. Therefore the reprocessed emission could be expected to be large for S2 for the whole of the year 2002.
Figure 6 also indicates that the optically thick disk assumption may actually break down when the star is too close to the disk. Some of the dust species are destroyed (evaporated) when the dust temperature is greater than several hundred Kelvin, and at K the dust can be nearly completely destroyed. Therefore our treatment is not accurate for cm, where the results will be dependent on the exact disk column depth, dust properties, etc. We overestimate the disk emission at these small distances, and hence the maxima reached by the curves in Figure 6 will be in reality smaller by factors of few to ten. Nevertheless it is clear that the disk emission would still dominate over the S2 emission and this fact will be sufficient for our further analysis.


One important simplifying assumption that we make while performing these calculations is the following. In equation 1 it is explicitly assumed that the illuminated side of the disk faces the observer, i.e. that the star is in front of the disk. In the opposite case the results depend on the mean optical depth of the disk, . Approximately, the radiation emitted from the back side of the disk will be reduced by a factor of . In what follows we neglect this effect, i.e. assume that the front and the back side of the disk radiate the same spectrum which is roughly correct for not too much larger than unity. In the following figures, however, we point out the times when the star was behind the disk; the thermal disk emission at these times should be remembered to be smaller than that indicated in the figures by an amount depending on . To show the maximum possible effect of this complication, we simply turned off all the NIR emission during an eclipse for one particular calculation (see Fig. 8). Our main conclusion – a rather unlikely presence of an optically thick disk in Sgr A∗– is unchanged, and thus a better treatment of the back-side illuminated disk is not necessary.
3.3 The reprocessed disk emission for S2’s orbit
We now calculate the combined star plus disk luminosity for S2 (Figure 7), first assuming that the disk is inclined at ∘ and that rotation angle ∘. The triangles show the times when Schödel et al. (2002, 2003) actually observed the star. The maximum near infrared luminosity reached by the source is the same, roughly half the star’s bolometric luminosity, in all the three frequency bands. The maxima are reached nearly simultaneously around the time when the star physically crosses the disk. The very sharp drops in the disk luminosity near the maxima are simply due to the fact that the disk becomes “too” hot when the star is very close to the surface of the disk (e.g., see Fig. 6). In this case the three near infrared bands are on the Rayleigh-Jeans part of the disk blackbody curves and the emission is therefore weak.
The part of the light curve between the two maxima in and is the time when the star is eclipsed by the disk so that the disk emission should be actually reduced at these moments as we explained above. In Fig. 8 we show the extreme case when the optical depth of the disk is so high that all the emission is absorbed by the disk material during the eclipse. Comparing the Figs. 7 and 8, we observe that any optically thick infinite disk, oriented as in these Figures, is ruled out by the existing data. There has been no changes in S2’s band flux down to % level for all 10 years of the observations (private communication from R. Schödel).
We test the sensitivity of the result on the disk inclination angle, , in Fig. 9, where we fix the disk rotation angle, = 350∘, but vary . Three different values of (30, 60 and 80∘) are chosen. Only the luminosity of the star plus disk system is shown. The maximum near infrared luminosity reached by the three curves is the same as in Figure 7, but the times of the maxima and the width of the curves are different. It is apparent that it is hard to escape the tight observational constraints unless the disk oriented exactly edge on to the observer.


Finally, we perform a search in the parameter space in the manner similar to that done in §2.3. In particular, we make a fine grid in the disk orientation parameter space. For every combination of and , we determine the luminosity of the disk at the epochs when S2 was actually observed by Schödel et al. (2003). We then pick the maximum of these values. The disk luminosity found in this way is the maximum luminosity that should have been observed by Schödel et al. (2003) for given and . The result is displayed in Figure 10 where we show the ratio of the disk flux to that of the star for the three NIR frequencies, averaged over . Except for nearly edge-on disks, the reprocessed emission should have been detected by now. Since this effect has not been observed, we can rule out the existence of an optically thick disk with no inner hole in Sgr A∗.
3.4 The case of S2 and disks with empty inner regions
We now perform similar calculations but allowing the disk to have an inner hole of a given size . Figure 11 shows the light curves in the three frequency bands for the disk inclined at ∘ and ∘, with ″. Comparing the light curves with those shown in Fig. 7, the most striking difference is the absence of the second maximum in the and bands. This is due to the fact that there is now only one crossing of the disk with the star – in 2001.8 – while the second crossing shown in Fig. 7 does not occur because there is no inner disk for . Nevertheless the strength of the first maximum is such that such a disk is still ruled out.

We then repeated the same calculation (same and ) but with a larger inner hole radius, ″. The result is shown in Fig. 12. Since the star is relatively far from the disk surface for all of its orbit for these particular disk parameters, there are no eclipses or detectable increases in the or bands. Further, until 2002, the S2 star has not been detected in the band, therefore the light curves in Fig. 12 appear to be consistent with the observations. In fact, we feel that by adjusting the disk parameters it is possible to obtain the band spectral excess similar to that observed by Genzel et al. (2003). We shall explore this in detail in the future papers.

3.5 Summary: constraints due to disk reprocessed emission
We have shown that the reprocessed emission of the disk illuminated by the star is a very powerful constraint on the disk presence and/or properties. In fact, the effect is “stronger” than stellar eclipses that we studied in §2 (see also Nayakshin & Sunyaev 2003). The luminous stars emit most of their radiation in the visible and UV ranges. The disk re-processes this emission in the NIR band which then appears much brighter than the star itself in the same frequency. We have seen that the reprocessed NIR disk emission is up to a factor of 100 higher than that of the star. At the same time eclipses yield an effect of order unity.
Analyzing the predicted NIR light curves for S2 we found that an optically thin disk with a very small inner hole is ruled out. The disk emission would have been seen by now, whereas observations do not show any variability in S2 band fluxes. We then tested disks with non-zero values of , and found that only for rather large values of ″ such disks are permitted.
4 Star cluster asymmetry due to stellar eclipses
In §2 we explored the eclipses of the individual stars by the putative optically thick disk. To observe such eclipses one should be able to resolve individual star’s orbits, which is extremely difficult and has been made possible only for our Galactic Center (see Schödel et al. 2003; Ghez et al. 2003a). At the same time, similar eclipses of unresolved stars of the cluster should also be occurring, and hence one may hope to detect the disk “shadow” on the background emission of the nuclear cluster. In doing the calculations below, we will be concerned with the optical-UV emission rather than with the infrared, as we were in the previous sections. Our working assumption is that the visible and UV flux incident on the disk is absorbed and reprocessed into the near infrared emission (see §3), reflecting only a small fraction of the radiation in the visible-UV range. Hence we treat the disk as an optically thick absorbing surface in this section.
We will only consider disks with no inner holes, i.e. , since the instrument resolution (for other than Sgr A∗ galactic centers) is usually worse than the actual non-zero value of . Note that an enhanced emission from the inner hole could in principle be detected, but its asymmetry is currently impossible to resolve. In addition, the star cluster is assumed to be spherically symmetric. For this reason the angle is no longer of importance. Instead we define the coordinate system, with axis directed straight to us, and and as in Fig. 13. The axis is positive where the disk is closer to the observer.
We also define the column density of stars along the line of sight, , as the integral of the star density, , through the line of sight from the disk to the observer, located at infinity,
| (3) |
where if the line of sight does not intercept the disk projection, and , the respective -coordinate of the disk in the opposite case. For definitiveness, we take the spherically symmetric density profile with for given by Genzel et al. (2003) and consider the case where .
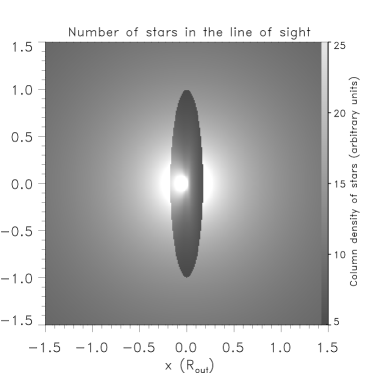
In Fig. 13 we show the resulting map of the stellar column density for the disk inclination angle = 80∘. The projection of the disk shadow is clearly seen. The boundaries of the disk appear as sharp discontinuities in the surface brightness of the star cluster. This effect is the strongest near the side of the disk that is closer to the observer (positive in Figure 13).
Also note that the star cluster image appears anisotropic on all scales smaller than the disk outer radius. This fact allows us to introduce an “anisotropy measure”, , defined as
| (4) |
where is the angle-averaged number count of stars at projected distance from the star cluster center away:
| (5) |
Here we used in the plane of the sky the common polar () coordinates centered on the black hole. We also defined in an analogous way and then .

The anisotropy measure is independent of the disk orientation in the plane of the sky (i.e. angle ; see Fig. 1). It is also independent of the absolute luminosity of the star cluster. Fig. 14 shows the anisotropy measure for three different values of the disk inclination angle as a function of radius in units of the disk radius . For small inclination angles, ∘, is nearly zero in the innermost part of the disk since there is little variation in along the circle with . However for , the projected semi-minor axis of the disk, the anisotropy measure is as high as 0.3, which is due to the high contrast between and . The case of the moderate inclination angle, ∘ shows that the anisotropy measure increases in the innermost parts of the cluster, and there is again a maximum around . This maximum appears to be the feature with which one may attempt to identify the disk inclination angle, if radius of the disk could be inferred from independent considerations. Finally, the case of a very highly inclined disk, ∘, is mostly a declining curve (after ).
This method has the advantage that no individual stellar orbits are needed. As the time scales for disk evolution are very long, data collected over many years and even tens of years may be combined to try to resolve the innermost region of the star cluster.
5 Discussion
In this paper we studied three ways to detect the disk presence in the infrared and optical/UV frequencies, and we then applied them to the particular case of Sgr A∗. We found that the orbit of star S2 alone requires the disk to be optically thin with near infrared optical depth no larger than . We now discuss in greater detail the physical motivation for believing there may be a disk in Sgr A∗, and the implications of this paper’s results for the disk hypothesis.
5.1 A cold disk in Sgr A∗?
Sgr A∗ is thought to be physically similar to Low Luminosity AGN (Ho 1999) since as long as radiative cooling is not important, the dynamics of the accreting gas should be independent of the actual accretion rate (e.g., see review by Narayan 2002). Ho (2003) noted that cold disks seem to be one of the established features of LLAGN. From spectral energy distributions and from profiles of the double-peaked emission lines, the inner radii of these disks are in the range (see Quataert et al. 1999; Ho 2003). By analogy, such a disk can be expected to exist in the Galactic Center.
Furthermore, Nayakshin & Sunyaev (2003) suggested that star-disk crossings may be the process that emits X-ray flares observed in Sgr A∗(Baganoff et al. 2001; Goldwurm et al. 2003). While crossing the disk, the stars drive shocks into the disk material; the gas is heated to temperatures of order K and emits X-rays. Nayakshin et al. (2003) showed that the number of star-disk crossings per day, given by the observed distribution of stars in Sgr A∗ (Genzel et al. 2003) is close to the observed rate of X-ray flaring (Baganoff 2003); the predicted flare duration and multi-frequency spectra are in a broad agreement with the observations. Nayakshin (2003) also suggested that the disk may be an effective cooling surface for the hot winds, and that the hot flow is essentially frozen at large radii, preventing it from piling up at small radii. This suggestion could be a part of the explanation for the observed dimness of Sgr A∗, although there are other possible explanations (see e.g., the review by Quataert 2003, and further references there).
Levin & Beloborodov (2003), using data of Genzel et al. (2000), recently concluded that most of the innermost young bright Helium-I stars (that are thought to “feed” Sgr A∗ by producing powerful hot winds) line up in a single plane. This result makes it very likely that these hot young stars may have been created from a single large molecular cloud that was compressed to high densities that led to star formation. It is not possible that all of the gas in the molecular cloud would turn into stars; the remainder would have to form a relatively massive gaseous disk, similar to the bright disks of AGN. A tiny not accreted remnant of the original disk could then still be present (Nayakshin 2003; Nayakshin et al. 2003).
Finally, Genzel et al. (2003) report discovery of an infrared excess in the spectrum of S2 in 2002 (e.g., see Fig. 7) as compared to other similar sources in the region. Namely, S2 appeared to be brighter by magnitude in the m ( band) compared with what is expected from the spectra of other bright nearby stars. Such an excess is usually interpreted as evidence for the dust presence around the star (e.g., Scoville & Kwan 1976). In the absence of the inactive (dusty) disk, the only source of dust would have to be the hot K flow itself (Genzel et al. 2003). While this is not physically impossible, the presence of the dust in a K gas is somewhat problematic as the dust can be destroyed by sputtering in such a gas (e.g., Draine & Salpeter 1979). Our estimates show that all but the largest interstellar grains would be destroyed by the sputtering by the time the gas reaches radii of order S2’s pericenter. We suggest that the re-processing of the stellar radiation in a putative disk could be an alternative way to explain the infrared excess of S2. Whereas an optically thick disk that we explored in this paper produces in fact a too strong an excess, an optically thin disk (with “right” orientation and values) appears to be promising in this regard (see Fig. 12).
5.2 Constraints on the disk in Sgr A∗
5.2.1 Optically thick disk
As we have shown in §2, the so far absent eclipses of the star S2 (Schödel et al. 2002, 2003; Ghez et al. 2003b) requires an optically thick disk to have a relatively large inner hole few arcsecond (or equivalently few cm). A hole with these dimensions is not unreasonable (e.g., Nayakshin et al. 2003). However in §3 we showed that the disk reprocessed emission yields an even stronger signature than eclipses. We found that the disk with no inner hole and a very large is incompatible with the observations for any combination of disk orientation angles. We then tested the case of a non-zero value for and found that only disks with inner holes as large as yield NIR “echoes” that are weak enough to escape the observational constraints. As such, our results are in a complete agreement with the previous results by Falcke & Melia (1997) and Narayan (2002), who also ruled out the existence of an optically thick disk with in Sgr A∗.
5.2.2 Optically thin disk
It is possible to make rough estimates on how optically thin the disk should be to satisfy the observational constraints. For this we simply assume that the opacity of the grains is gray, in which case the grain temperature should be equal to the effective one (equation 1). Then the disk spectral luminosity is that calculated in this paper but scaled down by factor of , where is the grey disk optical depth in the NIR. Referring now to Fig. 7, we see that in the maximum the band disk spectral luminosity exceeds that of the star by a factor of several hundred. flux did not vary within % uncertainty during the last 10 years of S2 observations (private communications from R. Genzel and R. Schödel). On the other hand the background cluster emission accounts for as much as 50% of the flux in band (Ghez et al. 2003b), and hence we estimate that the optical depth of the disk at 2.2m should be no larger than . However, if , the constrains imposed by the 2002 measured positions can be relaxed and a larger optical depth might be consistent with the observations.
To produce X-ray flares via star-disk interactions as luminous as observed, the mid-plane surface density of the disk was estimated by Nayakshin et al. (2003) at around Hydrogen nuclei per cm3 (although we note that due to simplicity of the calculations this value is uncertain by up to a factor of 10). With this the disk surface density, , was estimated as g/cm2, where is disk radius in units of gravitational radii, . For , we have g/cm2. Using the standard interstellar grain opacity and dust-to-gas mass ratio, one gets opacity at 2.2 m of (see Figure 1 in Voshchinnikov 2002). Such a disk would violate the constraints that we obtained in this paper. Even assuming that Nayakshin et al. (2003) overestimated the mid-plane density by a factor of 10, the NIR opacity still appears to be a little too large.
On the other hand, the dust grains are destroyed with each star’s passage. Smallest grains are especially vulnerable to such a destruction. Of course when the star leaves the disk, the dust will reform. With the gas densities as high as cm-3, the dust grains could grow at a rate as large as cm/year (Nayakshin et al. 2003). In addition, because only the largest grains survive the star passages, the large grains will grow preferentially. Therefore, the combination of the repeated dust destruction and dust growth could create larger grains than that in the interstellar medium. Using the optical constants from Draine & Lee (1984) and a simple Mie theory code to compute dust opacity (provided by K. Dullemond), we estimated that for the standard dust-to-gas mass ratio of the NIR opacity is reduced to a th of its interstellar value at 2.2 m if the typical grain size is m.
5.3 Star cluster asymmetry due to disk presence
In §4 we considered the effects of the disk on the appearance of the integrated star cluster brightness along a given line of sight. The disk was assumed to be optically thick and completely absorbing at the relevant wavelength (i.e. optical or UV). We found that the disk (obviously) imprints a shadow on the star cluster light. We then defined the “asymmetry measure” parameter , defined in equation 4, which appears to be a convenient indicator of the disk presence. In particular, as a function of radial distance from the star cluster center, has a clearly defined shape with characteristic features that could be used to constrain the inclination of the disk. Observational determination of may thus allow one to observationally test the disk presence in the nuclear stellar clusters of nearby galaxies.
6 Conclusions
In this paper we studied some of the potentially observable signatures of a cold disk presence in our Galactic Center, and in the centers of other galaxies. Such disks may be the remnants of previously active, i.e. accreting, disks. This work is essentially an expansion of the ideas presented in Nayakshin & Sunyaev (2003) via (i) using the exact and updated S2 star orbit in the study of possible eclipses of S2; (ii) including new effects – the disk re-processing and star cluster anisotropy. Our present work is also complementary to that of Nayakshin, Cuadra & Sunyaev (2003) who studied X-ray and near infrared flares produced when stars pass through the cold disk.
The strongest of the three effects considered in the paper turned out to be the re-processing of the stellar visible radiation into the near infrared bands (§3). We found that if an optically thick disk were present in Sgr A∗, the reprocessed emission of the bright star S2 would have been observed by now in all , and near infrared bands. Since this contradicts to the data, an optically thick disk would have to have a rather large inner radius, cm.
At the same time, the observed band excess in S2’s spectrum in the year 2002 (Genzel et al. 2003), is most naturally interpreted as a signature of the re-processing of S2 stellar radiation into this band. We estimated that the disk invoked by Nayakshin et al. (2003) would have the “right” dust opacity if the minimum size of the grains in the disk would be about m. Such a large minimum grain size may be the result of the unusually high (by interstellar standards) density in the disk and the too frequent stellar passages through the disk. Therefore, both the X-ray flares of Sgr A∗ and the mid-infrared excess of S2 in 2002 may be the result of the interactions of the stars with an optically thin inactive disk.
Acknowledgements.
We thank R. Genzel and R. Schödel for useful comments and preprints of their new unpublished work. We also acknowledge the expertise and computational help of K. Dullemond in estimating the dust opacity and the resulting disk spectrum. Finally, we thank the referee, W. Duschl, for comments and suggestions that improved the quality of presentation of our paper.References
- Baganoff (2003) Baganoff, F. K., 2003, to be published in Astron. Nachr., Vol. 324, No. S1 (2003), Special Supplement “The central 300 parsecs of the Milky Way”, Eds. A. Cotera, H. Falcke, T. R. Geballe, S. Markoff
- Baganoff et al. (2001) Baganoff, F. K., Bautz, M. W., Brandt, W. N., Chartas, G., Feigelson, E. D., Garmire, G. P., Maeda, Y., Morris, M., Ricker, G. R., Townsley, L. K., Walter, F., 2001, Nature 413, 45
- Churazov et al. (2001) Churazov, E., Gilfanov, M., Revnivtsev, M., 2001, MNRAS 321, 759
- Draine & Lee (1984) Draine, B. T., Lee, H. M., 1984, ApJ 285, 89
- Draine & Salpeter (1979) Draine, B. T., Salpeter, E. E., 1979, ApJ 231, 438
- Falcke & Melia (1997) Falcke, H., Melia, F., 1997, ApJ 479, 740
- Genzel et al. (2000) Genzel, R., Pichon, C., Eckart, A., Gerhard, O. E., Ott, T., 2000, MNRAS 317, 348
- Genzel et al. (2003) Genzel, R., Schödel, R., Ott, T., Eisenhauer, F., Hofmann, R., Lehnert, M., Eckart, A., Alexander, T., Sternberg, A., Lenzen, R., Clenet, Y., Lacombe, F., Rouan, D., Renzini, A., and Tacconi-Garman, L. E., 2003, to appear in ApJ (astro-ph/0305423)
- Gezari et al. (2002) Gezari, S., Ghez, A. M., Becklin, E. E., Larkin, J., McLean, I. S., , Morris, M., 2002, ApJ 576, 790
- Ghez et al. (2003a) Ghez, A. M., Becklin, E., Duchêne, G., Hornstein, S., Morris, M., Salim, S., Tanner, A., 2003a, to be published in Astron. Nachr., Vol. 324, No. S1 (2003), Special Supplement “The central 300 parsecs of the Milky Way”, Eds. A. Cotera, H. Falcke, T. R. Geballe, S. Markoff (astro-ph/0303151)
- Ghez et al. (2003b) Ghez, A. M., Duchêne, G., Matthews, K., Hornstein, S. D., Tanner, A., Larkin, J., Morris, M., Becklin, E. E., Salim, S., Kremenek, T., Thompson, D., Soifer, B. T., Neugebauer, G., and McLean, I., 2003b, ApJL 586, L127
- Goldwurm et al. (2003) Goldwurm, A., Brion, E., Goldoni, P., Ferrando, P., Daigne, F., Decourchelle, A., Warwick, R. S., Predehl, P., 2003, ApJ 584, 751
- Ho (1999) Ho, L. C., 1999, ApJ 516, 672
- Ho (2003) Ho, L. C., 2003, to appear in Active Galactic Nuclei: from Central Engine to Host Galaxy, ed. S. Collin, F. Combes, & I. Shlosman (San Francisco: ASP) (astro-ph/0303059)
- Kolykhalov & Sunyaev (1980) Kolykhalov, P. I., Sunyaev, R. A., 1980, Soviet Astronomy Letters 6, 357
- Levin & Beloborodov (2003) Levin, Y., Beloborodov, A. M., 2003, ApJL 590, L33
- Melia & Falcke (2001) Melia, F., Falcke, H., 2001, ARA&A 39, 309
- Miyoshi et al. (1995) Miyoshi, M., Moran, J., Herrnstein, J., Greenhill, L., Nakai, N., Diamond, P., Inoue, M., 1995, Nature 373, 127
- Narayan (2002) Narayan, R., 2002, in Lighthouses of the universe : the most luminous celestial objects and their use for cosmology : proceedings of the MPA/ESO/MPE/USM Joint Astronomy Conference held in Garching, Germany, 6-10 August 2001 / M.Gilfanov, R. Sunyaev, E. Churazov (eds.), p. 405
- Nayakshin (2003) Nayakshin, S., 2003, to be published in Astron. Nachr., Vol. 324, No. S1 (2003), Special Supplement “The central 300 parsecs of the Milky Way”, Eds. A. Cotera, H. Falcke, T. R. Geballe, S. Markoff (astro-ph/0302420)
- Nayakshin et al. (2003) Nayakshin, S., Cuadra, J., Sunyaev, R., 2003, A&A accepted (astro-ph/0304126)
- Nayakshin & Sunyaev (2003) Nayakshin, S., Sunyaev, R., 2003, MNRAS 343, L15
- Osterbrock (1989) Osterbrock, D. E., 1989, Astrophysics of gaseous nebulae and active galactic nuclei, University Science Books
- Ott et al. (2003) Ott, T., Schodel, R., Genzel, R., Eckart, A., Lacombe, F., Rouan, D., Hofmann, R., Lehnert, M., Alexander, T., Sternberg, A., Reid, M., Brandner, W., Lenzen, R., Hartung, M., Gendron, E., Clenet, Y., Lena, P., Rousset, G., Lagrange, A.-M., Ageorges, N., Hubin, N., Lidman, C., Moorwood, A. F. M., Renzini, A., Spyromilio, J., Tacconi-Garman, L. E., Menten, K. M., Mouawad, N., 2003, The Messenger 111, 1
- Quataert (2003) Quataert, E., 2003, to be published in Astron. Nachr., Vol. 324, No. S1 (2003), Special Supplement “The central 300 parsecs of the Milky Way”, Eds. A. Cotera, H. Falcke, T. R. Geballe, S. Markoff (astro-ph/0304099)
- Quataert et al. (1999) Quataert, E., di Matteo, T., Narayan, R., Ho, L. C., 1999, ApJL 525, L89
- Roy (1982) Roy, A. E., 1982, Orbital motion, Bristol : A. Hilger, 1982. 2nd ed.
- Schödel et al. (2003) Schödel, R., Genzel, R., Ott, T., Eckart, A., Mouawad, N., and Alexander, T., 2003, ApJ submitted (astro-ph/0306214)
- Schödel et al. (2002) Schödel, R., Ott, T., Genzel, R., Hofmann, R., Lehnert, M., Eckart, A., Mouawad, N., Alexander, T., Reid, M. J., Lenzen, R., Hartung, M., Lacombe, F., Rouan, D., Gendron, E., Rousset, G., Lagrange, A.-M., Brandner, W., Ageorges, N., Lidman, C., Moorwood, A. F. M., Spyromilio, J., Hubin, N., Menten, K. M., 2002, Nature 419, 694
- Scoville & Kwan (1976) Scoville, N. Z., Kwan, J., 1976, ApJ 206, 718
- Voshchinnikov (2002) Voshchinnikov, N. V., 2002, in Optics of Cosmic Dust, p. 1