AN XMM-Newton HARD X-RAY SURVEY OF ULTRA-LUMINOUS INFRARED GALAXIES ††thanks: Based on observations obtained with XMM-Newton, an ESA science missions with instruments and contributions funded by ESA Member States and the USA (NASA).
Abstract
XMM-Newton observations of 10 Ultra-Luminous Infrared Galaxies (ULIRGs) from a 200 ksec mini-survey program are reported. The aim is to investigate in hard X-rays a complete ULIRG sample selected from the bright IRAS 60 m catalogue. All sources are detected in X-rays, 5 of which for the first time. These observations confirm that ULIRGs are intrinsically faint X-rays sources, their observed X-ray luminosities being typically , whereas their bolometric (mostly IR) luminosities are . In all sources we find evidence for thermal emission from hot plasma with a rather costant temperature keV, dominating the X-ray spectra below 1 keV, and likely associated with a nuclear or circumnuclear starburst. This thermal emission appears uncorrelated with the far-IR luminosity, suggesting that, in addition to the ongoing rate of star formation, other parameters may also affect it. The soft X-ray emission appears to be extended on a scale of 30 kpc for Mkn 231 and IRAS 19254-7245, possible evidence of galactic superwinds. In these two sources, in IRAS 20551-4250 and IRAS 23128-5919 we find evidence for the presence of hidden AGNs, while a minor AGN contribution may be suspected also in IRAS 20100-4156. In particular, we have detected a strong (EW keV) Fe-K line at 6.4 keV in the spectrum of IRAS19254-7245 and a weaker one in Mkn 231, suggestive of deeply buried AGNs. For the other sources, the X-ray luminosities and spectral shapes are consistent with hot thermal plasma and X-ray binary emissions of mainly starburst origin. We find that the 2-10 keV luminosities in these sources, most likely due to high-mass X-ray binaries, are correlated with LFIR: both luminosities are good indicators of the current global star formation rate in the galaxy. The composite nature of ULIRGs is then confirmed, with hints for a predominance of the starburst over the AGN phenomenon in these objects even when observed in hard X-rays.
keywords:
galaxies: infrared, galaxies: starburst, galaxies: surveys, galaxies: evolution, galaxies: activeAccepted 2002 December 15. Received 2001 February 21; in original form 2000 November 13
1 Introduction
Ultra-Luminous InfraRed Galaxies (ULIRGs, sources with bolometric luminosity LL⊙ mostly emitted in the IR) have received much attention since their discovery during the IRAS survey follow-up observations (Sanders et al. 1988; see a review in Sanders & Mirabel 1996). The main reason for this interest was that, together with optical quasars, these are by far the most luminous objects in the local universe.
The relevance of this class of sources in the cosmological context has been further emphasized by recent findings of cosmological surveys at long wavelengths. Observations at IR and sub-millimeter wavelengths have discovered that luminous and ultra-luminous IR galaxies, which are rare in the local universe (Soifer et al. 1987), are detected instead in large numbers in deep IR surveys, and are a fundamental constituent of the high-redshift galaxy population (e.g. Smail et al. 1997; Genzel & Cesarsky 2000; Franceschini et al. 2001). The number and luminosities of these sources imply that an important fraction of stars in present-day galaxies, or alternatively of the degenerate baryons contained in nuclear supermassive Black Holes, have formed during such IR-luminous dust-extinguished evolutionary phases in the past. It has been argued that luminous and ultra-luminous IR galaxies at high redshifts could trace events of star-formation which may be at the origin of massive elliptical and S0 galaxies (e.g. Franceschini et al. 1994; Lilly et al. 1999). Support for this view has recently come from high-resolution spectroscopy of ULIRG mergers (Genzel et al. 2001), whose dynamical properties have proven that they indeed are ”ellipticals in formation”.
This evidence came along with the discovery by COBE of a bright diffuse radiation, the Cosmic IR Background (CIRB, see Hauser et al. 1998; Lagache et al. 2000), appearently containing a large fraction (up to %) of the total extragalactic background energy density from radio to X-rays, i.e. a major part of the photon energy released by cosmic sources at any redshifts. As discussed by various authors (Elbaz et al. 2002; Smail et al. 2002), there is precise evidence that this background radiation is indeed produced by sources similar in all respects to luminous and ultra-luminous IR galaxies at . These recent facts justify the growing interest in local ULIRGs as possible clues to their supposed high-z counterparts.
However, about 15 years after their discovery, the nature of these sources still remains rather enigmatic. Large gas and dust column densities in the galaxy cores, responsible for the IR emission, prevent a direct observation of the primary energy source and the IR spectral shapes are highly degenerate with respect to the illuminating spectrum. It is widely accepted that both starburst and AGN activity may be responsible for the observed luminosities (Genzel et al. 1998; Veilleux, Kim, Sanders 1999; Risaliti et al. 2000; Bassani et al. 2003, in prep.). If indeed ULIRGs are ”forming spheroids”, an AGN/starburst association is naturally supported by the evidence that all spheroidal galaxies host quasar relics in the form of supermassive BH’s. The same radial inflow of gas produced by the merger is likely to fuel both the starburst and, at some stages, the AGN.
So far conflicting evidence has been reported about the relative contributions of the two energy sources in ULIRGs, stellar and gravitational. Important progress has been achieved with mid- and far-IR spectroscopy, probing the inner optically-thick nuclei. Using diagnostics based on coronal line intensities and PAH line-to-continuum ratios, Lutz et al. (1996), Genzel et al. (1998) and Rigopoulou et al. (1999) have argued that the majority of ULIRGs are powered by star-formation.
On the other end, the presence of energetically important obscured AGNs in ULIRGs has been revealed by optical and near-IR spectroscopy, often detecting Seyfert-like nuclear emission line spectra (Sanders et al. 1988; Veilleux, Sanders & Kim, 1997) as well as evidence for completely buried AGNs (Soifer et al. 2001; Imanishi, Dudley & Maloney 2001).
In principle hard X-ray observations offer an additional important tool to investigate the presence of hidden AGNs, providing quantitative estimates of their contribution to the bolometric luminosity. This diagnostics relies on the fundamentally different spectra and luminosity regimes between starbursts and AGNs in hard X-rays. Hard continuum emission and prominient the Fe-K line(s) are distinguishing features of buried AGNs, which can penetrate large gas column densities. Some of the brightest nearby ULIRGs, classified on the basis of IR spectroscopy as pure starburst, show spectral properties typical of obscured AGNs when observed in hard X-rays (e.g. NGC 6240, Iwasawa et al. 1999; Vignati et al.1999). In practice, so far the utilization of this diagnostics has been limited by the X-ray faintness of most ULIRGs (see previous unsuccessful detection attempts with ROSAT, ASCA and BeppoSAX; Risaliti et al. 2000).
The unique large collective area and hard X-ray response of XMM-Newton have been used here to deeply survey for the first time a representative sample of 10 IRAS-selected ULIRGs for which high-quality mid-IR and optical spectroscopy data are available. Most of these ULIRGs were previously classified as starbursts (Lutz, Veilleux & Genzel 1999). The purpose of the present observations is not only to identify AGN signatures in hard X-rays, but also to separately quantify the contributions of the buried AGN from the starburst emission to the X-ray spectra, and to compare them with independent estimates based on optical and IR observations. This paper summarizes the main X-ray properties of the sample, five sources of which are detected in X-rays for the first time. XMM-Newton observations for two sources of the sample of particular interest, the Superantennae and Mkn 231, are discussed in separate papers (Braito et al. 2003a and 2003b).
Section 2 summarizes the properties of our ULIRG sample. Section 3 details the XMM-Newton observations and data analysis. The resulting hard X-ray properties are reported in Section 4, while Section 5 discusses plausible origins of various X-ray components and compares them with data at other wavelengths. Section 6 contains our conclusions. has been assumed throught.
 |
 |
 |
 |
 |
 |
 |
 |
 |
 |
2 The ULIRG SAMPLE
The sample of 10 ULIRGs discussed in this paper has been selected from the list of IRAS ULIRGs observed with ISO by Genzel el al. (1998). The sample is flux-limited at m and complete to Jy. It includes sources with L⊙ in the total 8–1000 m band, whose far-IR selection makes it unbiased with respect to absorption and representative of the most luminous galaxies in the local universe. High quality IR/optical spectroscopic data are available for all the sample sources (Lutz et al. 1999; Veilleux et al. 1999).
Of the original Genzel et al. sample of 15 ULIRGs, 4 have been observed with XMM-Newton by different teams, while IRAS 23060+0505 has been deeply observed with ASCA (Brandt et al. 1997) and BeppoSAX. Source names, sky positions (which are also the coordinates of the XMM-EPIC observations), IR (8-1000 m) luminosities, redshifts, as well as the XMM-EPIC net exposure times and observation dates, of the 10 ULIRGs presented here, are reported in Table 1. Optical and IR classifications of the ULIRGs presented here are summarized in Table 4.
All 10 objects have been observed with XMM-Newton with 20 ksec exposure each. A fraction of the observations had to be excluded from the analysis because of background flares (this problem was severe for the source IRAS 23128-5919, see Table 1).
3 XMM-Newton EPIC Data Preparation and Analysis
The XMM-Newton observations presented here have been performed between March 2001 and November 2002 with the EPIC (European Photon Imaging Camera: Strüder et al. 2001 and Turner et al. 2001) cameras operating in full-frame mode. Data have been processed using the Science Analysis Software (SAS version 5.3), and have been analyzed using standard software packages (FTOOLS 5.0, XSPEC 11.0). The latest calibration files released by the EPIC team have been used.
Event files produced from the pipeline have been filtered from high-background time intervals, and only events corresponding to pattern 0-12 for MOS and pattern 0-4 for PN have been used (see the XMM-Newton Users’ Handbook, Ehle et al. 2001). We have then generated our own response matrices (that include the correction for the effective area) using the SAS tasks arfgen and rmfgen. The screening process from high background time intervals yielded net exposures between 15.7 ksec and 21.7 ksec (net exposures for PN camera are reported in Table 1), with the exception of IRAS 23128-5919 (9.4 ksec).
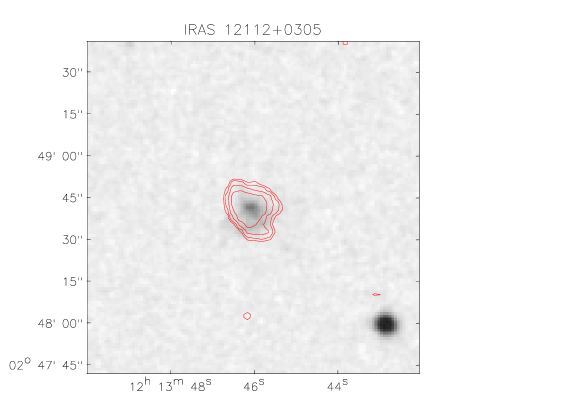
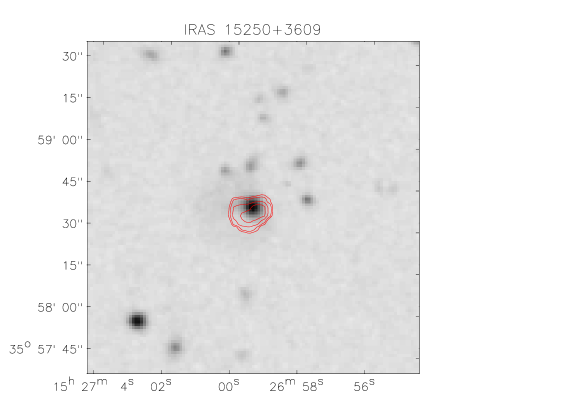
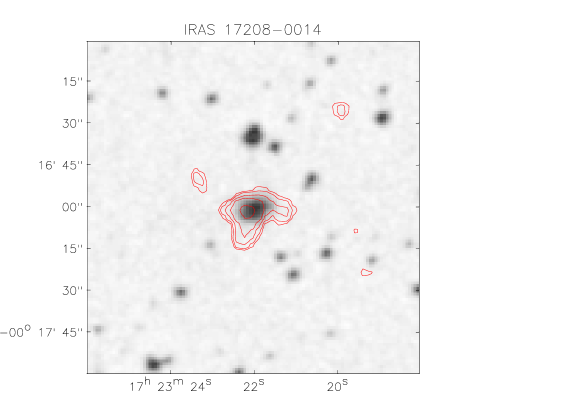
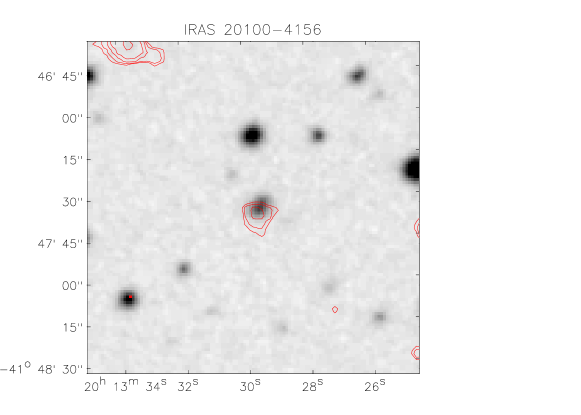
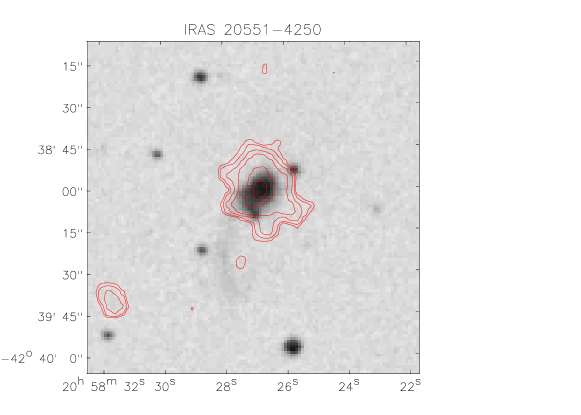
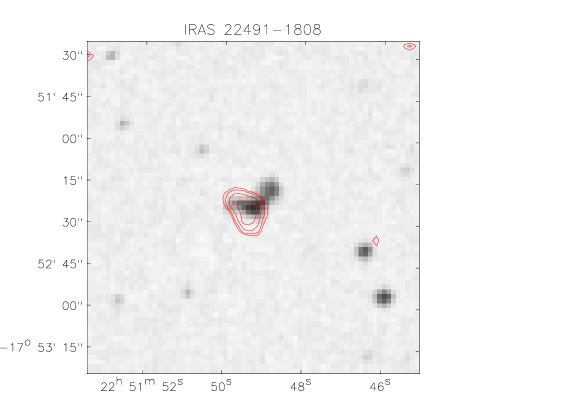
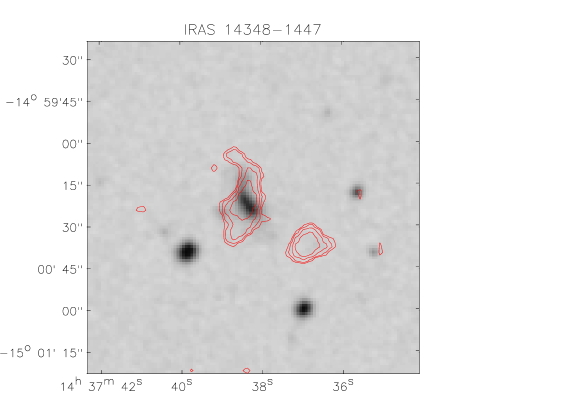
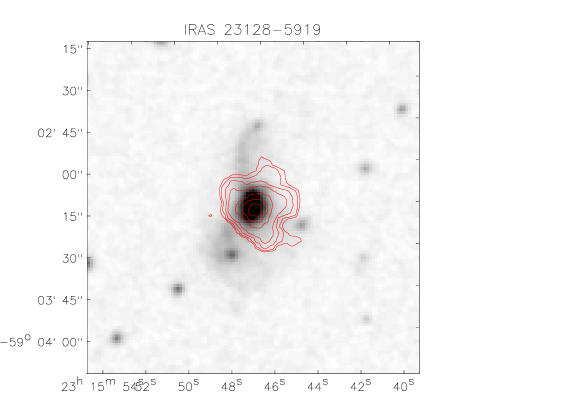
All the 10 ULIRGs have been detected in the MOS1, MOS2 and PN detectors with signal to noise ratios S/N3. Close-up images of the sources are reported in Figs. 1, 2, 3 as overlays of the (0.2–10 keV) X-ray contours on top of the POSS red-band images. For all the ULIRGs the bulk of the X-ray emission is positionally concident (within the XMM-Newton positional error) with the optical-IR core. By accounting in detail for the EPIC PSF, we have found evidence for extended emission only in Mkn 231 and IRAS19254-7245, while the surface brightness distributions for all other sources are consistent with being unresolved by EPIC.
Except for Mkn 231, the most extended source (90% counts in 40 arcsec in the soft X-ray band E 2 keV), the source spectra were extracted from circular regions of arcsec radius. Background spectra have been extracted from source-free circular regions (with typically radius) close to the target.
In order to improve the statistics, MOS1 and MOS2 data have been combined. Both MOS and PN spectra were then automatically rebinned in order to have a counts in each energy channel. The combined MOS data have been fitted simultaneously with the PN data, by keeping the relative normalizations free.
| Name | Coordinates | z | LIR | PN Net exp. time | Obs. Date | Sequence | Filter |
|---|---|---|---|---|---|---|---|
| (J2000) | [ L⊙] | [ksec] | [month/year] | ||||
| IRAS 121120305 | 12 13 46.03 02 48 41.5 | 0.072 | 3.8 | 20.9 | 2001 Dec 30 | 0081340801 | Medium (PN) -Thin |
| MKN231a | 12 56 14.16 56 52 24.9 | 0.042 | 6.7 | 19.8 | 2001 Jun 06 | 0081340201 | Medium |
| IRAS 143481447 | 14 37 38.30 15 00 23.0 | 0.082 | 4.0 | 17.5 | 2002 Jul 29 | 0081341401 | Medium |
| IRAS 152503609 | 15 26 59.43 35 58 37.4 | 0.055 | 2.0 | 17.8 | 2002 Feb 22 | 0081341101 | Thin |
| IRAS 172080014 | 17 23 22.03 00 17 00.3 | 0.043 | 4.7 | 15.7 | 2002 Feb 19 | 0081340601 | Medium |
| IRAS 192547245b | 19 31 21.46 72 39 21.6 | 0.062 | 2.2 | 18.4 | 2001 Mar 21 | 0081341001 | Thin |
| IRAS 201004156 | 20 13 29.75 41 47 34.0 | 0.129 | 7.4 | 18.1 | 2001 Apr 21 | 0081340501 | Medium |
| IRAS 205514250 | 20 58 27.05 42 39 06.8 | 0.043 | 2.1 | 16.1 | 2001 Apr 21 | 0081340401 | Thin |
| IRAS 224911808 | 22 51 49.26 17 52 24.0 | 0.078 | 2.7 | 21.7 | 2001 May 24 | 0081340901 | Medium |
| IRAS 231285919 | 23 15 47.00 59 03 17.0 | 0.044 | 2.0 | 9.4 | 2002 Nov 19 | 0081340301 | Medium |
Note: a: XMM-Newton observations reported in Braito et al. 2003b;
b: XMM-Newton observations reported in Braito et al. 2003a
4 Results
We report in Table 4 the measured fluxes and luminosities of the sources in various X-ray bands. Our XMM-Newton observations show that ULIRGs are rather faint in X-rays if compared with AGNs of similar bolometric (IR) luminosities. Their observed X-ray luminosities are close to or lower than , while their IR bolometric output is always .
The level of detail for our spectral analysis is different for each source depending on the qualities of the XMM spectra, ranging from fairly detailed for stronger sources to only rather coarse spectral fits for the faintest. The two brightest sources, IRAS19254-7245 and Mkn 231, have data of sufficiently high quality to guarantee investigations of both the continuum emission and the Fe-K 6.4 keV line, detected only in these two sources (see Braito et al. 2003a,b).
At energies above 1 keV, the X-ray spectra appear to be dominated by a relatively flat power-law (PL) component in most of the sources. We tried to fit these overall 0.2-10 keV spectra with single-component models, either purely thermal or absorbed PL, as a zero-th order attempt. For all sources, these simple fits were rejected with high statistical significance.
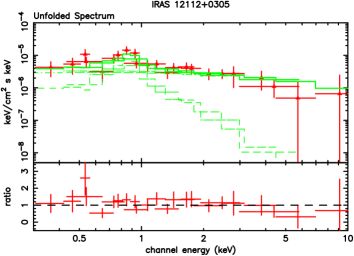
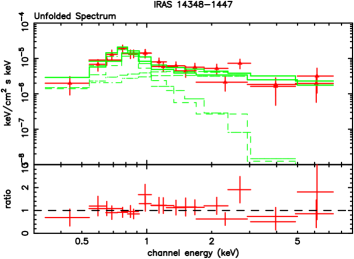
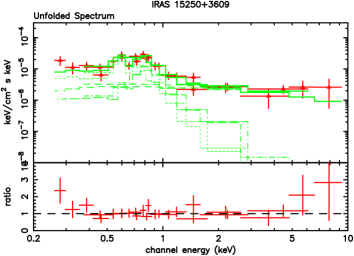
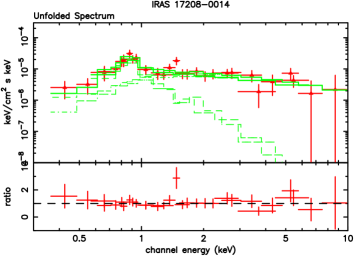
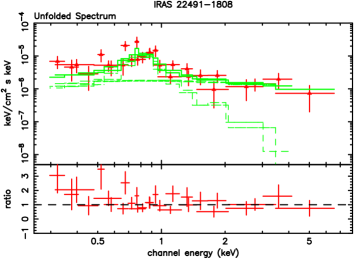
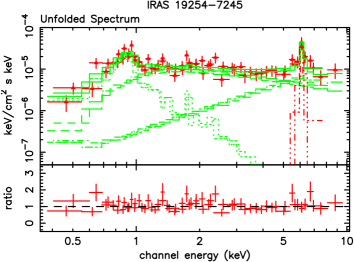
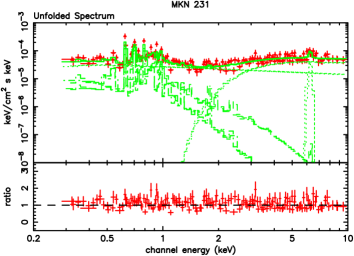
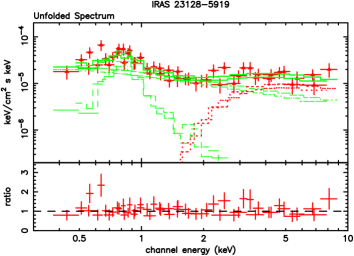
The XMM-Newton spectral data are shown in Figs. 4 and 5 and compared with model spectra. The bottom panel in each figures displays the ratio of the observed to predicted flux as a function of energy. No emission lines are evident in these spectra, if we exclude Mkn 231 and IRAS19254-7245. The only appreciable feature is a fairly sharp, well characterized peak at E keV, likely of thermal origin. We have modelled this component with a thermal emission template using the routine MEKAL in XSPEC (Mewe et al. 1985), whose free parameters are the temperature and the normalization. The plasma metallicity has been set, for simplicity, to the solar value. This has no effect in our estimate of the the plasma temperature, the assumed metallicity essentially affecting only the normalization of the thermal spectrum.
In the rest of the present Section we discuss each source separately. The best-fit parameters are summarized in Table 3. More detailed spectral decompositions are discussed in Sect. 5.
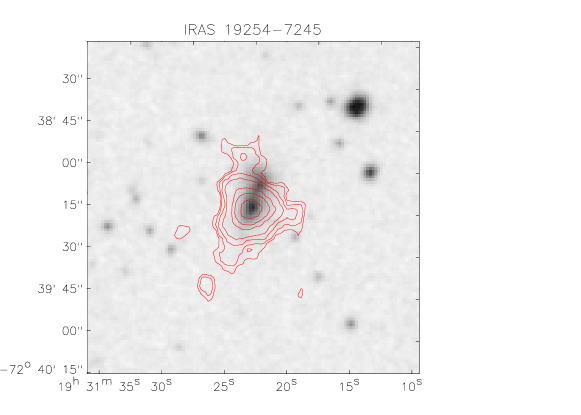
4.1 IRAS 19254-7245, the Superantennae
From the analysis of the ASCA data (Imanishi & Ueno 1999; Pappa, Georgantopoulos, & Stewart 2000), two alternative fits were proposed for this object: a) unabsorbed power law model with flat photon index (), and b) absorbed PL model with and N cm-2. No Fe-K lines were detected by ASCA.
XMM-Newton has detected a strong X-ray flux from IRAS 19254-7245. As shown in Fig. 1, the emission is centered in the southern nucleus of the interacting pair, while no hard X-ray emission is apparently related to the northern one. This is consistent with the results from observations at other wavelengths, which show that the southern nucleus, classified as a Seyfert 2, is always brighter than the nothern one (Melnick & Mirabel 1990). By taking into account the EPIC PSF, the X-ray source appears to be significantly extended at low-energies (E keV). A detailed analysis of this complex source, resembling in many aspects the prototypical type-II quasar NGC 6240, is reported in Braito et al. (2003a).
A single unabsorbed power-law model is not a good description of the XMM-Newton data because it seriously misfits the spectrum at low energies. By adding a thermal component to their composite model, Braito et al. (2003a) have obtained a temperature kT= keV for the thermal component and (Ncm-2) for the hard PL component. The soft X-ray luminosity is erg s-1. Braito et al. (2003a) have also found evidence for a Fe-K line at 6.4 keV, whose large equivalent width (EW keV), together with the flat photon index, indicates that this object is a “Compton thick” AGN, in which the detected hard X-ray emission is due to a pure reflected component plus a scattered one. Hence, the intrinsic AGN luminosity is much higher than the observed value of erg s-1, and likely erg s-1.
| Name | CTS(a) | ||||
|---|---|---|---|---|---|
| PN+MOS1+MOS2 | [ | [ | [ | ] | |
| IRAS 121120305 | 256 | ||||
| MKN231 | |||||
| IRAS 143481447 | |||||
| IRAS 152503609 | |||||
| IRAS 172080014 | |||||
| IRAS 192547245 | |||||
| IRAS 201004156 | |||||
| IRAS 205514250 | |||||
| IRAS 224911808 | |||||
| IRAS 231285919 |
(a) total net counts used in the spectral fits.
(b) observed fluxes.
(c) luminosities are corrected for galactic and intrinsic (NH)
absorption.
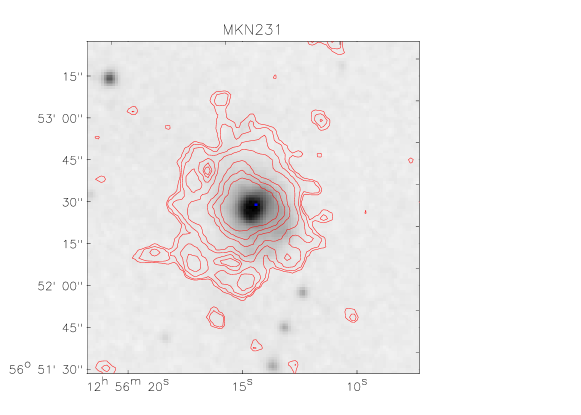
4.2 MKN 231
Among local ULIRGs, Mkn231 is the most luminous object in the IR (Soifer et al. 1984) and one of the best studied at all wavelengths. Observed with many X-ray instruments (ROSAT, ASCA and Chandra), its X-ray properties still remain puzzling. Evidences of a combined AGN and SB activity emerged from the ROSAT and ASCA data (Imanishi and Ueno 1999; Turner 1999). However the flatness of the X-ray spectrum at energies above 2 keV and the lack of detection of any strong Fe lines (Maloney and Reynolds 2000) appeared unusual. These results have been confirmed with a recent Chandra observation (, FeK line with EW188 eV; see Gallagher et al. 2002).
Our XMM-Newton field containing the source is shown in Fig. 2: the source appears very bright and extended. This extension is significantly in excess of the PSF only for low-energy photons (E keV), with a total diameter of arcminute ( kpc), while for higher energy photons the source spatial profile is consistent with the PSF. A detailed analysis of the XMM-Newton data on Mkn 231, plus those from a deep Beppo-SAX observation extending up to 80 keV, is reported in a companion paper by Braito et al. (2003b). Our results also confirm the very flat spectrum and the detection of a moderately intense (EW200 eV) Fe-K line at 6.4 keV. The luminosity of the hard component is erg s-1. The presence of a highly obscured AGN is then confirmed by the BeppoSAX PDS data, but our XMM-Newton observations suggest the concomitant presence of an important starburst component.
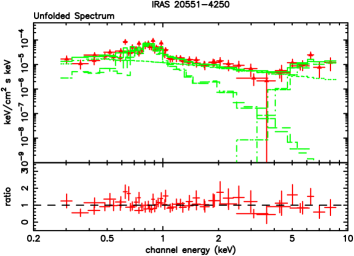
4.3 IRAS 20551-4250 and IRAS 23128-5919
IRAS 20551-4250 has been previously detected with ASCA (Misaki et al. 1999), but at a very low significance level. XMM-Newton detects it with a high enough S/N to allow us to perform a detailed spectral analysis. The source appears as unresolved by EPIC (see Figs. 2).
A good fit (Fig. 5) is obtained only with a three components model: a thermal model (kT=0.68 keV), and a “leaky-absorber” continuum, including an absorbed plus a non-absorbed power law spectrum with the same photon index. We found that a good fit can be obtained with and Ncm-2. The 6.4 keV Fe-K line is not detected, but the upper limit on its equivalent width ( keV) is consistent with the NH value obtained from the fit. The intrinsic 2-10 keV luminosity of this object, corrected for absorption, is erg s-1, while the soft X-ray luminosity is erg s-1. The high X-ray luminosity and the properties of the X-ray spectrum clearly suggest the presence of an extinguished AGN.
The XMM-Newton observations of IRAS 23128-5919 have been strongly affected by high background (only 9.4 ksec of good data are available), and this prevented us from attempting detailed spectral fits. The source appears as point-like and relatively bright. The spectrum is reasonably well reproduced by the sum of a thermal model and a simple power-law with no absorption. However, the power-law’s spectral index in this solution is unphysically hard (), suggesting the presence of an absorbed component. We then adopted the same “leaky-absorber” model as discussed for IRAS 20551-4250, and found best-fit parameters kT=0.65 keV, and Ncm-2. The luminosities of the thermal and de-absorbed power-law components are and erg s-1. The large gas column density and power-law luminosity clearly indicate the presence of an AGN, whereas a spectroscopic IR study by Charmandaris et al. (2002) revealed the predominance of a starburst. Our subsequent analysis in Sect. 5.3 suggests that IRAS 23128-5919 is a transition object, with properties intermediate between those of an AGN and a SB.
4.4 IRAS 14348-1447, IRAS 15250+3609, and IRAS 17208-0014
All these sources have intermediate-quality detections. While the latter two are consistent with a point source emission at all energies, IRAS 14348-1447 appears to be resolved in a bow-like structure of total size 30 arcsec in the North-South direction. The close-up image in Fig. 3 shows also the presence of another relatively bright ( [erg/cm2/s]) source located only 20 arcsec away in the SE direction, a position in which no optical counterpart is detectable in the POSS image.
IRAS 14348-1447 and IRAS 17208-0014 show evidence of a single-temperature plasma emission with kT keV and kT keV respectively. The spectrum of IRAS 15250+3609, instead, is unique among those from our spectral survey in requiring the presence of multi-temperature plasmas (a two-temperature solution indicates kT keV and kT keV).
In addition to these thermal emissions we find a very significant hard X-ray component in all three sources. Acceptable spectral fits have then been obtained by combining a Mekal-modeled thermal emissions and an absorbed PL having , except for IRAS15250+3609 whose photon-index is flatter () (see Table 4). In all sources some absorption in excess of the galactic value is required (cm-2). All three sources have X-ray luminosities in the range erg s-1.
| Name | MODEL(c) | kT | L | NH | L | ||
| L | |||||||
| [keV] | [] | [] | |||||
| IRAS 121120305 | A | 0.79 | 1.92 | 0.8 | |||
| B | 0.80 | 1.1⋆ | / | ||||
| MKN231(b) | D(f) | 196.8/156 | |||||
| IRAS 143481447 | A | 10.3/15 | 0.61 | 2.18 | 0.3 | ||
| B | 13.7/16 | 0.64 | 1.1⋆ | 0.5 | |||
| IRAS 152503609(a) | A | 0.64 | 1.21 | / | |||
| 0.26 | |||||||
| B | 0.66 | 1.1⋆ | / | ||||
| 0.26 | |||||||
| IRAS 172080014 | A | 0.76 | 2.26 | 1.1 | |||
| B | 0.74 | 1.30 | 2.6 | ||||
| IRAS 192547245(b) | C | 0.85 | 1.84 | 0.47 | |||
| IRAS 201004156 | A | 0.75 | 1.7⋆ | 2.6 | |||
| B | 0.75 | 1.1⋆ | 2.2 | ||||
| IRAS 205514250 | E(f) | 0.66 | 1.8 | 7.9 | |||
| IRAS 224911808 | A | 0.69 | 1.98 | / | |||
| B | 0.66 | 1.1⋆ | / | ||||
| IRAS 231285919 | E(f) | 0.65 | 1.67 | 6.9 |
(a): For this source an acceptable fit requires a two-temperature plasma.
(b): XMM-Newton observations reported in Braito et al. (2003a and 2003b)
(c): Model A: Thermal emission plus an absorbed power-law model; Model B: thermal
emission plus cutoff power-law; Model C: Thermal emission plus a Compton reflected and
scattered countinum (see Braito et al. 2003a); Model
D: two thermal emission plus a “leaky-absorber”; Model
E: thermal emission plus a “leaky-absorber” continuum.
(d): Luminosities are between 0.5 and 10 keV.
(f): The covering factor for the “leaky-absorber” continuum are 9%, 5%
and 54% for MKN231, IRAS 205514250 and IRAS 231285919 respectively.
N.B. The symbol ⋆ indicate that the parameter has been kept fixed.
 |
 |
 |
 |
 |
 |
 |
 |
 |
 |
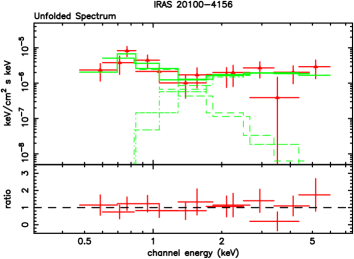
4.5 IRAS 12112+0305, IRAS 20100-4156 and IRAS 22491-1808
All these sources are detected at the lowest level of significance. This has prevented us from performing any detailed spectral analyses. We only tried on these sources two separate fits with a thermal model and an absorbed PL. For all three sources, a single thermal or a PL model are rejected by the data. Successful spectral fits require a combination of thermal and PL emissions (see Table 4).
The intrinsic hard ( keV) X-ray luminosities are erg s-1 for IRAS 22491-1808, erg s-1 for IRAS 20100-4156, and erg s-1 for IRAS 12112+0305.
5 THE SPECTRAL ANALYSIS
The X-ray spectral properties of the ULIRG sample appear to be fairly uniform. The spectra are well reproduced by the combination of a soft thermal and a hard PL components. For a physical interpretation of the ULIRG phenomenon, the implications of these results are briefly discussed in this and the next Section. A more detailed comparison of these XMM-Newton spectra with model predictions is deferred to Persic et al. (2003a).
5.1 Evidence for AGN-dominated emission
One of the motivations for the present survey has been the opportunity offered by hard X-ray data to constrain the relative AGN and starburst contributions to the source activity. A dominant AGN contribution should be detectable in X-rays as either a) an high-luminosity X-ray emission, L; or b) highly extinguished hard X-ray components with N, as revealed by very flat or inverted hard X-ray spectra; or c) Fe-K complexes at 6.4 keV with large Equivalent Widths (1 keV), corresponding to Iron fluorescent emission by cold molecular material illuminated by the AGN’s energetic radiation field.
We found such evidence for an AGN spectrum in 4 out of the 10 sources observed. The most obvious AGN is IRAS 19254-7245, which has both a strong Fe-K line and a very flat (probably scattered) hard continuum, implying an intrinsic luminosity (Braito et al. 2003a).
The ULIRG Mkn 231 has been clearly identified from optical/IR observations as an AGN-dominated source, as inferred in particular from the flat, almost power-law, mid-IR continuum observed by Genzel et al. (1998) and the low EW of the PAH emissions. The source is also classified as a Broad Absorption Line quasar from optical spectroscopy (Smith et al.1995). The XMM-Newton observations reveal a moderate luminosity X-ray source with a very flat spectrum () between 1 and 10 keV, while Beppo-SAX data reported by Braito et al. (2003b) reveal an highly extinguished (N) component above 10 keV. These data fully confirm the classification of Mkn 231 as a dusty and extinguished AGN.
IRAS 20551-4250 is a third ULIRG with evidence from the XMM-Newton spectrum of harboring a high-column-density (N) extinguished AGN, and a similar evidence for the presence of a low-luminosity AGN was found in IRAS 23128-5919. Neither these two sources nor IRAS 19254-7245 showed evidence for AGN activity from infrared spectroscopy (Genzel et al. 1998), which illustrates the useful complementarity between the IR and the X-ray approach. A detailed spectrophotometric study of Superantennae by Berta et al. (2003) has found evidence, however, for a combined AGN and starburst emissions with comparable IR bolometric luminosities.
Further indications about the relative AGN/starburst contributions will come from the comparison of soft X-ray thermal and hard X-ray power-law emissions discussed in Sect. 5.3.
5.2 Starburst emission
The spectra of local SB galaxies in the 0.5-10 keV band can be described as a combination of warm thermal emission (with typically keV) dominating at energies keV, plus a harder spectrum producing the bulk of the 2-10 keV flux.
The warm thermal component is interpreted as originating from the boundary region between the hot, tenuous outgoing galactic wind and the cool, dense ISM (e.g., Strickland et al. 2000).
 |
 |
 |
 |
 |
The harder component has various interpretations in the literature 111Various authors have analysed X-ray data on specific nearby starbursts: Ptak et al. (1997) and Cappi et al. (1999) for NGC 253 and M 82; Okada et al. (1997) for M83; Della Ceca et al. (1996) for NGC 1569; Della Ceca et al. (1999) for NGC 2146; Moran et al. (1999) for NGC 3256; Della Ceca et al 1997 for NGC449; Zezas et al. (1998) and Della Ceca et al. (2002) for NGC 3310, NGC 3690 (Arp 299). See also Dahlem et al. (1998) for a review., either in terms of a very hot (kT5 keV) thermal or a PL model, but no definitive conclusions were reached, as the thermal and PL fits are, in general, similarly successful.
Recently, Persic & Rephaeli (2002; see also David, Jones & Forman 1992) have developed a detailed quantitative model of synthetic X-ray spectra of SB galaxies, based on evolutionary populations of galactic stars and adopting template X-ray spectra for the relevant emission processes. They suggested that high- and low-mass X-ray binaries (HMXBs, LMXBs) contribute most of the 2-15 keV spectrum, in the absence of AGN emission. Both categories of X-ray binaries have spectra that can be described as variously cutoff PLs (White et al. 1983; Christian & Swank 1997). For example, in the case of one isolated episode of intense star formation, the 2-10 keV emission of the starburst would be dominated by HMXBs, and would be described as a power law. In more moderate starbursts (such as those observed in local SB galaxies), in addition to the HMXBs related to the SB proper, also the LMXB population in the underlying disk is expected to provide important contributions to the X-ray emission. In the case of a mix of HMXBs and LMXBs of various luminosities with Galactic proportions, the 2-10 keV emission can be described as a cutoff PL of the form , with photon index and cutoff energy keV (Persic & Rephaeli 2002). This spectrum is to be corrected for the intrinsic absorption with variable column density NH.
| Name | Optical | Mid-IR | X-ray |
|---|---|---|---|
| (1) | (2) | (3) | (4) |
| IRAS 12112+0305 | L | SB | SB |
| Mkn 231 | AGN-1 | AGN | AGN |
| IRAS 14348-1447 | L | SB | SB |
| IRAS 15250+3609 | L | SB | SB |
| IRAS 17208-0014 | HII | SB | SB |
| IRAS 19254-7245 | AGN-2 | SB | AGN |
| IRAS 20100-4156 | HII | SB | SB/AGN |
| IRAS 20551-4250 | HII | SB | AGN |
| IRAS 22491-1808 | HII | SB | SB |
| IRAS 23128-5919 | HII | SB | SB/AGN |
Note. Col.(1): Object name. Col.(2): Optical classification: Liner (L), AGN or HII region (Lutz et al. 1999; Veilleux et al. 1999). Col.(3): Mid Infrared classification based on ISO spectroscopy Starburst (SB) or AGN (Genzel et al. 1998). Col.(4): X-ray Classification.
5.3 Spectral decompositions
Following the above guidelines, we have tried to fit the spectra of our ULIRGs with various astrophysically motivated composites. The first clear feature to consider is the ubiquitous low-energy excess emission between 0.5 and 1 keV. One possibility to explain it would be a reflected component by photoionized gas, as found for example in the Seyfert 2 NGC 1068 (Kinkhabwala et al. 2002, Brinkman et al. 2002). We have tried to reproduce the source spectra with such an emission, but in all cases have failed to obtain acceptable fits. In particular, for IRAS 19254-7245 the Fe-K line at 6.49 keV detected by Braito et al. (2003a) implies the presence of an essentially cold neutral gas, which is unable to explain the low-energy emission features. For MKN 231, Braito et al. (2003b) attempt to explain it entirely with an ionized reflection, which provides however a very poor overall fit, while a thermal ionized gas emission is required by the data. As for IRAS 20551-4250, an attempt to fit the low-energy spectrum with photo-ionized emission is similarly unsuccessful, as it would require an unphysically large value of the X-ray spectral index and would generate a quite poor overall fit.
Also in all other sample’s sources the photo-ionized AGN emission model would leave significant residuals in all cases, which implies that collisionally ionized hot thermal gas is in any case required. We have modelled this ubiquitous low-energy thermal component with the Mekal/XSPEC code at constant (solar) metallicity (for the source IRAS 15250+3609 a two-temperature component was required).
Then we have added a PL with photon index , photoelectrically absorbed through a column density NH to describe the hard X-ray excess that shows up at energies keV. For IRAS 20551-4250 we have used the ”leaky absorber” model (Sect. 4.3), while for Mkn 231 we have not considered in the present analysis the highly-extinguished (N) component found in Beppo-SAX data by Braito et al. (2003b). Alternatively, for all the sources we have attempted also to fit the high-energy data with an X-ray binary model with , cutoff energy keV and variable low-energy absorbing column density NH (see Sect. 5.2).
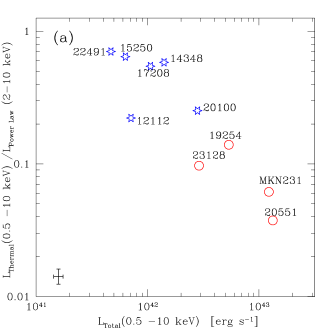
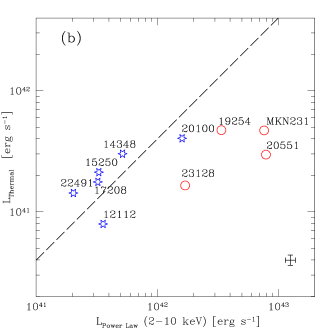
The results of these spectral decompositions are reported in Table 4 and shown in Figs. 4 and 5. In Fig. 6 we explore possible relationships between the best-fit parameters. Fig.6(a) is a plot of the ratio between the luminosities of the thermal and PL components (after correction for intrinsic absorption), as a function of the X-ray luminosity measured in the total 0.5-10 keV band. SB-dominated ULIRGs (starred symbols) occupy a fairly well defined region with L and Lthermal/L. IRAS 12112+0305 appears to have a very low value of Lthermal compared with other starbursts. The AGN-dominated sources have enhanced X-ray luminosities with Lthermal/L: as expected, these AGN ULIRGs have an energetically-dominant power-law component. In the following we use the symbol LPL to indicate the luminosity derived from the fit with a generic PL, rather than the one corresponding to the best-fit X-ray binary model (in any case the difference between the two is a few tens percent at most, see Table 4).
Fig. 6(b) compares the luminosities of the thermal and PL components: a fairly clear correlation is apparent, with the AGN population occupying the high-luminosity end in both quantities. Again the AGN-dominated sources show an excess of the PL component luminosity compared with that of the thermal plasma.
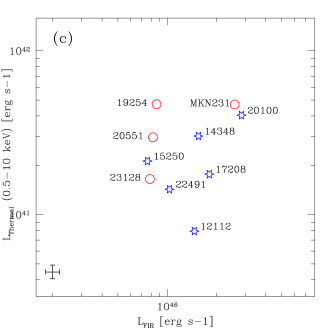
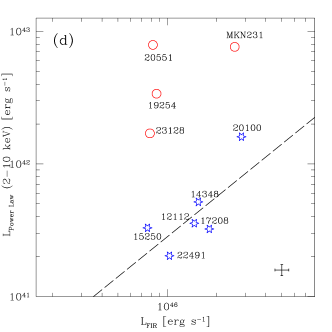
Fig. 6(c) plots the luminosities of the thermal component Lthermal against the bolometric far-IR luminosities LFIR, while Fig. 6(d) does the same for the luminosities of the PL component. If we consider the starburst-dominated population, the LPL and LFIR luminosities appear both reasonably correlated, while the AGN-dominated sources show similar LFIR values but largely enhanced X-ray PL emission. On the contrary, we find a remarkable lack of correlation between LFIR and the emissivity of the thermal component.
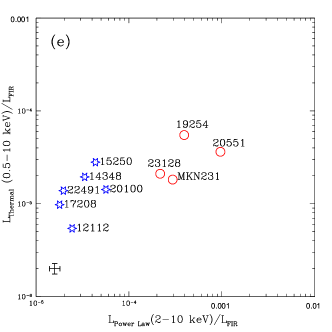
Finally, panel 6(e) shows that the SB-dominated sources have fairly well defined LX/LFIR ratios for both the thermal and PL components. The AGN sources display the usual excess of PL emission. On this regard, the sources IRAS 20100-4156 and 23128-5919 tend to occupy positions in the various plots which are intermediate between SB and AGN dominated populations, and may have genuinely intermediate properties.

6 DISCUSSION
Altogether, in spite of the limited statistics of the sample, there are some remarkable regularities emerging from the spectral analysis of the XMM-Newton data.
The first one is that hot thermal plasma emission, likely a SB signature, is present in all objects of the sample. We find, however, a remarkable lack of correlation between thermal emission and far-IR luminosity (which is supposed to be a good indicator of the rate of star formation in the galaxy). Our conclusion is that, although this plasma emission should be traced back to a galactic wind triggered by young and exploding stars, the process may be ruled by various additional parameters, like the density and pressure of the surrounding ISM. According to the study by Strickland & Stevens (2000), the soft X-ray emission from SB-driven galactic winds comes from a low filling-factor (%) gas, which contains only a small fraction (%) of the mass and energy of the wind. Soft X-ray observations therefore do not probe the gas that contains the bulk of the energy, mass or metals in the outflow, while the bulk of the hot plasma radiates and cools on timescales longer than that of the starburst evolution.
To test the possible effect of the long cooling time, we have attempted to compare the thermal X-ray emissivity with the starburst ages. To this end, since all optical counterparts of our sources show double or multiple nuclei (supposed in a merging system), we have adopted as a rough estimate of the merger stage the separation of the nuclear components, and investigated possible relations between the ratio of the thermal X-ray to IR luminosities against nuclear separation. We found essentially no correlations in these plots, which suggests that various parameters in addition to the star-formation rate (SFR), like the pressure of the surrounding medium, should affect the thermal plasma emission. In any case, the soft thermal emission is a quite poor tracer of the ongoing SFR.
On the contrary, the PL emission fitting the hard X-ray excesses in the spectra of our SB-dominated ULIRGs seems well correlated with LFIR. We understand this as an effect of both quantities being closely linked to the newly formed stellar populations, in one case (LFIR) due to dust reprocessing of the UV flux by young massive stars, in the other (LPL) to the number of HMXBs which are a subset of the young stellar population (see below).
6.1 Stellar contribution to the X-ray emission
We now check the hypothesis that, in ULIRGs not dominated by an AGN, the hard X-ray 2-10 keV emission may be mainly due to luminous ( erg s-1) HMXBs. To this aim, we compare the rate of star-formation (SFR) estimated from the X-ray flux with that traced by the FIR, under the assumption that both the X-ray emitting HMXBs and the OB stars heating the dust responsible for the FIR flux are short-lived, in which case they can both be used as indicators of the ongoing SFR. Our definition of the SFR assumes a standard Salpeter stellar IMF between 0.1 and 100 M⊙.
We proceed as follows. Assuming a mean HMXB luminosity of L erg s-1 (e.g., White et al. 1983), we first estimate the number of HMXBs from the 2-10 keV luminosity for each sample object. We consider that our Galaxy, hosting bright HMXBs (Iben et al. 1995, and references therein), has a SFR of yr-1 (e.g., Matteucci 2002). From the number of HMXBs we then estimate the corresponding SFRX-ray.
Then from the FIR luminosity, we calculate (Kennicutt 1998)
We plot the two independent estimates of the SFR in Fig. 7: this shows that the two are in quite good agreement for these non-AGN-dominated objects (filled circles), whereas the SFRX-ray values are clearly in excess for the AGN-dominated sources (empty squares). Given the linear relation between SFR, far-IR and X-ray luminosities, this is obviously nothing else than the plot of Fig. 6d, recast in different units.
We have further checked this X-ray to FIR relationship on a sample of well-known moderate-to-low luminosity local SB galaxies, shown in Fig.7 as crosses (see figure’s caption for references). While comparing these with ULIRGs, and following our previous discussion in Sect. 5.2, we bear in mind one relevant difference between the two classes: the star-forming activity in ULIRGs is very intense, short-lived, and dominates the whole galaxy, so the hard X-ray flux is produced mainly by HMXBs. In lower SFR starburst galaxies the X-ray flux is produced by a mix of HMXBs and LMXBs, coming respectively from SB regions and from the underlying quiescent disk, in comparable proportions. In Fig. 7 we have quantified this effect by the parameter , the fraction of 2-10 keV emission attributable to HMXBs, setting for ULIRGs and for SB’s (Persic & Rephaeli 2002).
These results confirm that, for ULIRGs without dominant AGN components, the 2-10 keV flux from ULIRGs is a good SFR indicator:
| (1) |
for . For lower luminosity SB galaxies (), the relation of the X-ray flux to the SFR is less straightforward, due to the contribution of long-lived LMXBs. In this case the relation becomes
| (2) |
These results are in fair agreement with those found by Ranalli et al. (2002) and Gilfanov et al. (2003), if we consider the different definitions of the SFR. Note that the only SB galaxy lying far out the one-to-one relation in Fig. 7 is the crossed symbol with SFR corresponding to the galaxy Arp 299, which was recently proven to host a luminous obscured AGN (Della Ceca et al. 2002).
Finally, our XMM-Newton data below keV have in all cases a very low S/N, which does not allow us to constrain the origin of this part of the ULIRG spectrum. In some instances (IRAS12112+0305 and IRAS 22491-1808) our formal fit implies a dominance of X-ray binary emission at such low energies, which may not be physical due to the fact that binary spectra typically show photoelectric absorption. To address this problem with more elaborated model spectra would need higher spectral resolution and S/N data.
6.2 The AGN contribution to the ULIRG phenomenon
Altogether, we find in 3 of the 10 sample sources (Mkn 231, IRAS 19254-7245 and IRAS 20551-4250) various independent evidences for the presence of an absorbed AGN dominating the XMM-Newton X-ray spectrum. They show, in particular, values of the 2-10 keV luminosity (after absorption correction) quite in excess compared with the thermal plasma luminosities. This evidence is confirmed in all three objects by X-ray spectral features like a strong Fe-K 6.4 keV line and a very flat or inverted hard X-ray spectrum indicative of high-column density (N) circum-nuclear material.
The source IRAS 23128-5919 displays a hard spectrum and large X-ray luminosity which suggest an AGN contribution. Both IRAS 23128-5919 and IRAS 20100-4156 display intermediate values of the parameters in Fig. 6 between the AGN and SB-dominated sources, which might indicate that an AGN contribution may be present.
It should be noticed that, among X-ray AGNs, IRAS 19254-7245, IRAS 20551-4250 and IRAS 23128-5919 did not show any AGN signatures from spectroscopy of IR coronal lines (Genzel et al. 1998). Consider however that, as shown in Fig. 6e, the X-ray luminosity is only a tiny fraction (% and % for SBs and AGNs, respectively) of the bolometric one. Then even for bona-fide X-ray AGNs, the IR spectrum may well be dominated by the starburst, hence explaining the results of the IR spectroscopy. Although the lack of AGN signatures in the IR spectra of these sources might alternatively be explained as dust obscuration up to 30 m, the evidence for starburst components in the X-ray spectra suggests that indeed an important fraction of the bolometric IR flux is likely of stellar origin (see previous Sect. and Fig. 7).
Though limited by the small statistics of our ULIRG sample, our conclusion is that for a majority of these sources the high rate of star formation indicated by the large far-IR luminosity can account for most of the X-ray emission. The X-ray spectra of roughly half of the ULIRGs show evidence of AGN contributions on top of an, always present, starburst component.
7 CONCLUSION
We have devoted a large observing program with XMM-Newton to survey the hard X-ray properties of a complete and representative sample of Ultra-Luminous IR Galaxies, as a way to probe deeply into the heavily extinguished cores of this still physically elusive class of sources.
All the 10 observed ULIRGs have been detected with high statistical significance by XMM-Newton, but their 2-10 keV fluxes turned out to be rather faint on average.
The X-ray emission appears to be extended on a scale of 30 kpc for Mkn 231 and IRAS 19254-7245, possibly evidence of galactic superwinds. In these same sources, in IRAS 20551-4250 and IRAS 23128-5919 we find evidence for the presence of hidden AGNs, while a minor AGN contribution may be suspected also in IRAS 20100-4156. A strong Fe-K line (EW keV) in the X-ray spectrum of IRAS 19254-7245 and a much weaker line in Mkn 231 (EW keV) are also detected, suggestive of deeply buried type-II quasars (Braito et al. 2003a,b). For the other sources, hence for roughly half of the ULIRG sample, the X-ray luminosities and spectral shapes are mostly consistent with hot thermal plasma and X-ray binary emissions of mainly starburst origin.
We have analysed the XMM-Newton spectra in terms of various physical components, that is thermal plasma emission and hard X-ray power-laws due to either X-ray binaries or true AGNs. We have found interesting regularities in the source parameters. Thermal plasma emission, the signature of a starburst component and dominating the spectra between 0.5 and 1 keV, is present in all the sample objects. The alternative interpretation of this soft X-ray component as due to a reflected emission by AGN-photoionized gas is mostly excluded by our analysis.
This thermal emission is quite unrelated with the far-IR luminosity (a tracer of the ongoing star formation rate), from which we infer that other parameters should determine it in addition to the rate of star formation.
On the contrary, the X-ray binary power-law emission fitting the hard X-ray component in the starburst-dominated ULIRGs is correlated with LFIR, both quantities tracing the number of young stars in the galaxy and measuring the ongoing SFR.
We fully confirm with these data the composite nature of ULIRGs as a class, with indications for a predominance of the starburst over the AGN phenomenon even when observed in hard X-rays.
Acknowledgments
We thank the referee, dr. K. Iwasawa, for his careful reading of the paper and very useful comments. This work received financial support from ASI (I/R/037/01 and I/R/062/02) under the project “Cosmologia Osservativa con XMM-Newton” and support from the Italian Ministry of University and Scientific and Technological Research (MURST) through grants Cofin . PS acknowledges financial support by the Italian Consorzio Nazionale per l’Astronomia e l’Astrofisica (CNAA).
References
- [Berta et al.(2003)] Berta, S., Fritz, J., Franceschini, A., et al., 2003, A&A in press (astroph/0303259).
- [Braito et al.(2002a)] Braito, V., Franceschini, A., Della Ceca, R., et al., 2003a, A&A 398, 107.
- [Braito et al.(2002b)] Braito, V., et al., 2003b, A&A submitted
- [Brandt et al.] Brandt,W. N., Fabian, A. C., Takahashi, K. et al. 1997, MNRAS, 290, 617
- [Brinkman et al.] Brinkman, A. C.; Kaastra, J. S.; van der Meer, R. L. J.; Kinkhabwala, A.; Behar, E.; Kahn, S. M.; Paerels, F. B. S.; Sako, M., 2002, A&A 396, 761
- [Cappi et al.(2002b)] Cappi, M., Persic, M., Bassani, L., Franceschini, A., Hunt, L.K., Molendi, S., Palazzi, E., Palumbo, G.G.C., Rephaeli, Y., & Salucci, P. 1999, A&A, 350, 777
- [Charmandaris et al.] Charmandaris, V., Laurent, O., E.LeFloc’h, E., et al., 2002, A&A 391, 429
- [Christian et al.(2002b)] Christian, D.J, & Swank, J.H. 1997, ApJS, 109, 177
- [Cappi et al.(2002b)] Dahlem, M., Weaver, K.A., & Heckman, T.M. 1998, ApJS, 118, 401
- [] David L.P., Jones C., & Forman, W., 1992, ApJ, 388, 82
- [Cappi et al.(2002b)] Della Ceca, R., Griffiths, R.E., Heckman, T.M., & MacKenty, J.W. 1996, ApJ, 469, 662
- [Dalla Ceca et al.(2002b)] Della Ceca, R., Griffiths, R.E., Heckman, T.M., Lehnert, M.D., & Weaver, K.A. 1999, ApJ, 514, 772
- [Dalla Ceca et al.(1997)] Della Ceca, R., Griffiths, R. E.; Heckman, T. M. 1997, ApJ, 485, 581
- [] Della Ceca, R., Ballo, L., Tavecchio, F., Maraschi, L., Petrucci, P. O., et al., 2002, ApJ 581, L9
- [Devereux et al.(2002b)] Devereux, N.A., Young, J.S. 1989, ApJ, 371, 515
- [Ehle et al. 2001] Ehle, M., et al. 2001, XMM-Newton Users’ Handbook.
- [] Elbaz, D., Cesarsky, C. J., Chanial, P., Aussel, H., Franceschini, A. et al. 2002, A&A, 384, 848
- [Franceschini et al.(2001)] Franceschini A., Aussel H., Cesarsky C., Elbaz D., Fadda D., 2001, A&A, 378, 1.
- [Franceschini et al.(1994)] Franceschini, A., Mazzei, P., De Zotti, G., Danese, L., 1994, ApJ, 427, 140
- [\astronciteGallagher et al. 2001] Gallagher S. C., Brandt, W. N., Chartas, G., Garmire, G. P., Sambruna, R. M., 2002, ApJ 569, 655
- [cesarskygen (2001)] Genzel, R., and Cesarsky, C.J., 2001, ARA&A 38, 761
- [\astronciteGenzel et al.1998] Genzel R., Lutz, D., Sturn, E. et al. 1998, ApJ 498, 579
- [Givanov et al 2003] Gilfanov, M., Grimm, H.J., Sunyaev, R. submitted to MNRAS Letters (astro-ph/0301331)
- [iben (2001)] Iben, I., Jr., Tutukov, A.V., & Yungelson, L.R. 1995, ApJS, 100, 217
- [\astronciteImanishi M. and Ueno S.1999] Imanishi M., and Ueno S., 1999, ApJ 527, 709
- [] Imanishi, M., Dudley, C.C., & Maloney, P.R., 2001, ApJ 558, L93
- [\astronciteIwasawa et al.1999] Iwasawa K. et al., 1999, MNRAS 302,96
- [] Imanishi M., Ueno, S., 1999, ApJ 527, 709
- [] Hauser, M. G., Arendt, R. G., Kelsall, T., Dwek, E., Odegard, N. et al. 1998, ApJ, 508, 25
- [] Kinkhabwala, A., Sako, M., Behar, E., et al. 2002b, ApJ, 575, 732
- [] Kennicutt, R.C., Jr. 1998, ApJ, 498, 541
- [] Lagache, G., et al., 2000, AA 354 L247
- [] Lilly, S. J., Eales, S. A., Gear, W. K. P., Hammer, F. , Le Fèvre, O. et al 1999 ApJ, 518, 641
- [\astronciteLutz et al.1999] Lutz D., Veilleux S. and Genzel, R. 1999, ApJ 517, 13L
- [] Lutz, D., Genzel, R., Sternberg, A., Netzer, H., Kunze, D. et al. 1996, A&A, 315 137
- [\astronciteMaloney & Reynolds2000] Maloney P. R. and Reynolds C. S. 2000, ApJ 545,L23
- [] Matteucci, F. 2002, lecture given at the XIII Canary Islands Winter School of Astrophysics on ’Cosmochemistry: The Melting Pot of Elements’, in press (astro-ph/0203340)
- [] Melnick, J.& Mirabel I. F. 1990, A&A, 231, 19
- [Mewe et al. 1985] Mewe R., Gronenschild E.H.B.M., van den Oord G.H.J., 1985, A&AS 62, 197
- [\astronciteMisaki et al.1999] Misaki. K., Terashima, Y. et al. 1999, IAUS 196, 360M
- [Cappi et al.(2002b)] Mizuno, T., Ohbayashi, H., Iyomoto, N., & Makishima, K. 1998, in ’The Hot Universe’, ed. K.Koyama et al., IAU Symp. 188, 284
- [Cappi et al.(2002b)] Moran, E.C., Lehnert, M.D., & Helfand, D.J. 1999, ApJ, 526, 649
- [Cappi et al.(2002b)] Okada, K., Mitsuda, K., & Dotani, T. 1997, PASJ, 49, 653
- [\astroncitePappa et al.2000] Pappa A., Georgantopoulos I. and Stewart G. C., 2000, MNRAS 314, 589
- [Cappi et al.(2002b)] Persic, M., & Rephaeli, Y. 2002, A&A, 382, 843
- [Persic et al.(2003a)] Persic, M., et al. 2003a, in preparation
- [Persic et al.(2003b)] Persic, M., et al. 2003b, in preparation
- [Ptak et al.(2002b)] Ptak, A., Serlemitsos, P.J., Yaqoob, T., Mushotzky, R., & Tsuru, T. 1997, AJ, 113, 1286
- [Ranalli et al.(2002)] Ranalli, P., Comastri, A., & Setti, G. 2002, in ’New Visions of the X-Ray Universe in the XMM-Newton and Chandra Era’, ESA-SP488, eds. F.Jansen et al. (astro-ph/0202241)
- [Cappi et al.(2002b)] Rephaeli, Y., Gruber, D., & Persic, M. 1995, A&A, 300, 91
- [] Rigopoulou, D., Spoon, H. W. W., Genzel, R., Lutz, D., Moorwood, A. F. M.& Tran, Q. D 1999, AJ, 118, 2625
- [\astronciteRisaliti et al.2000] Risaliti G. et al. 2000, A&A 357, 13
- [Sanders1998] Sanders, D.B., et al., 1988, ApJ 325, 74.
- [Sanders(2002b)] Sanders, D.B., & Mirabel, F., 1996, ARAA 34, 749.
- [Shapley(2001)] Shapley, A., Fabbiano, G., & Eskridge, P.B. 2001, ApJS, 137, 139
- [] Smith, P. S., Schmidt, G. D., Allen, R. G. & Angel, J. R. P. 1995, ApJ, 444, 146
- [Smail et al.(1997)] Smail, I., Ivison, R. & Blain, A. W.: 1997, ApJ Letters, 490, L5.
- [Smail et al.(2002)] Smail, I., et al., 2002, MNRAS in press (astroph/0112100)
- [\astronciteSoifer et al.1984] Soifer B. T. et al. 1984, Ap 278, L71
- [] Soifer, B. T., Neugebauer, G., Matthews, K., Egami, E., Weinberger, A. J. et al. 2001, AJ, 122, 1213
- [] Strickland, D.K., Heckman, T.M., Weaver, K.A., & Dahlem, M. 2000, AJ, 120, 2965
- [] Strickland, D.K., & Stevens, I.R., 2000, MNRAS, 314, 511
- [Strüder et al., 2001] Strüder, L., Briel, U., Dannerl, K., et al. 2001, A&A, 365, L18
- [Turner et al. 2001] Turner, M. J. L., Abbey, A., Arnaud, M., et al. 2001, A&A, 365, L27
- [\astronciteTurner1999] Turner T. J. 1999, ApJ 511, 142
- [\astronciteVeilleux et al.1997] Veilleux, Sanders & Kim, 1997, ApJ 484, 92
- [\astronciteVeilleux et al.1999] Veilleux S., Kim D.-C. & Sanders, D. B. 1999, ApJ 522, 139
- [] Vignati P., Molendi S., Matt G. et al. 1999,A&A 349, 57
- [Cappi et al.(2002b)] White, N.E., Swank, J.H., & Holt, S.S. 1983, ApJ, 270, 711
- [Cappi et al.(2002b)] Zezas, A.L., Georgantopoulos, I., & Ward, M.J. 1998, MNRAS, 301, 915