Is Praesepe really different from the coeval Hyades cluster?
The XMM-Newton view
The Praesepe open cluster represents a puzzle since it has about the same age as the Hyades, and only slightly different metallicity, yet previous ROSAT observations resulted in a detection rate of cluster sources significantly lower than for the Hyades. We present a new 50 ksec observation of Praesepe performed with the EPIC instrument on board XMM-Newton, which resulted in the detection of sources, including 48 cluster members. We detected all solar-type (F–G) stars in the field of view, % of the K stars and % of the M stars. We find that the distribution of X-ray luminosities of solar-type Praesepe members is comparable to that of the Hyades, in contrast with the previous ROSAT results; however, the disagreement between the ROSAT and XMM-Newton results appears to be mostly due to X-ray faint Praesepe members falling outside the XMM-Newton field of view, while it is considerably reduced when considering only the subsample of stars in the ROSAT survey in common with the present observation. The finding supports an earlier suggestion that Praesepe may be formed by two merged clusters of different age.
Key Words.:
Open clusters and associations: individual: Praesepe – stars: activity – stars: coronae – X-ray: stars1 Introduction
The discrepancy in the average X-ray properties of the Hyades and Praesepe clusters represents one of the most surprising results in the context of ROSAT observations of open clusters. The two clusters have a very similar age (about 600 Myr); hence, based on the general age–activity relation which was shown to hold by early Einstein observations and confirmed by ROSAT (e.g. Randich 2000, and references therein), one would have expected that they share very similar X-ray properties. On the contrary, Randich & Schmitt (1995, hereafter RS95) found that the bulk of Praesepe population is significantly underluminous in X-rays with respect to the Hyades. More specifically, RS95 carried out a ROSAT PSPC raster scan covering a large area of the cluster () and detected only about 30% of the late-F and G-type stars, above a sensitivity threshold ranging between and erg s-1. This result must be compared with the % detection rate among the Hyades members with the same spectral type (Stern et al. 1995) and with a median luminosity for this cluster erg s-1. Later-type stars in Praesepe were characterized by even lower detection rates (%), again in contrast with the results for the Hyades (Pye et al. 1994; Stern et al. 1995). As a consequence, the X-ray luminosity distribution functions (XLDFs) of Praesepe stars of different spectral types, and in particular the XLDF of solar-type stars, lied considerably below those of the Hyades and were dominated by upper limits. We mention that a large fraction of the Praesepe ROSAT survey had a similar sensitivity to the ROSAT observations of the Hyades; thus the hypothesis that the difference in the XLDFs of the two clusters could be due to different sensitivities appeared rather unlikely.
As pointed out by RS95, ROSAT observations of Praesepe cast doubts on the universality of the activity–age relation; in other words, this finding may imply that the X-ray activity vs. age relationship is not unique and that a given cluster is not necessarily representative of the whole stellar population at that age.
In order to understand the anomalous X-ray emission of Praesepe members and, in particular, to ascertain whether the available optical catalogs of Praesepe were contaminated by a significant number of non-members which could bias the X-ray results, Barrado y Navascuès et al. (1998) carried out optical follow-up spectroscopic observations of a sample of F-K stars and M dwarfs in Praesepe. Based on the derived radial velocities, they could exclude that a significant number of non-members was present in the Praesepe catalog used for the X-ray analysis. In addition, H was measured for the M dwarf sample; a statistical comparison showed that for these stars the distribution of H chromospheric emission is similar to the Hyades, at variance with the X-ray results. Finally, Barrado y Navascuès et al. also analyzed a few ROSAT PSPC pointings retrieved from the archive and covering a fraction of the raster scan; based on these X-ray observations, they confirmed that the discrepancy in the X-ray properties of the Hyades and Praesepe could not be explained by an inadequate sensitivity of the raster scan data. Similarly to RS95, they concluded that the difference was most likely real.
Various hypotheses were proposed to explain the discrepancy between the two clusters. Namely, 1. a difference in the rotation rate distributions, 2. a difference in metallicity, and 3. the possibility that Praesepe may consist of two merged clusters. As it is now well known, the main parameter determining the level of X-ray emission at a given mass (or spectral type) is rotation and the X-ray vs. age relationship is indeed an X-ray–rotation–age relation (e.g. Jeffries 1999). If the rotation rates of the bulk of Praesepe population were lower than the Hyades, this could explain the X-ray results. Rotational velocities and/or periods for late-type Praesepe single members have never been published in a tabular form; however, projected rotational velocities for Praesepe stars with are available and have been published by Mermilliod (1997) as a figure. The distributions of projected rotational velocities of the Hyades and Praesepe appear very similar; as stressed by Mermilliod, the comparison between the two distributions does not therefore support the idea that the discrepancy in the X-ray properties is due to a difference in the cluster rotation rate distributions.
For Praesepe an almost solar metallicity has been determined () by Friel & Boesgaard (1992), while the same authors derived for the Hyades. This difference in metallicity implies a difference in the depth of the outer convective zone and, in principle, in the dynamo efficiency. In a recent study, Pizzolato et al. (2001) theoretically investigated the dependence of X-ray emission on metallicity for late-F, G and K dwarfs, however their results for late-F and G stars remain inconclusive. In fact, they found that for late-F and G stars the convective turnover time, which is a key parameter in determining the level of X-ray emission, decreases with increasing metallicity; at the same time the coronal plasma is predicted to radiate more efficiently for higher metallicities and the two effects almost compensate. Since their relative contribution depends on the exact stellar color and plasma temperature, Pizzolato et al. (2001) could not draw any definitive conclusion on the metallicity dependence of X-ray emission of late-F and G-type stars. Thus, the possibility that the discrepancy in the X-ray properties of the two clusters may be due at least in part to the different [Fe/H] contents remains open.
Finally, in a recent work Holland et al. (2000) hypothesized the presence of a subcluster lying about 3 pc away from the center of Praesepe. They pointed out that the brightest X-ray sources were found almost exclusively in the main cluster, and suggested that there could be a difference in age between the main cluster and the subcluster.
Praesepe is not the only exception to the age–X-ray activity relation; other possible X-ray underluminous clusters challenging the age–rotation–activity relationship were found, such as NGC 3532 (Franciosini et al. 2000a), NGC 6633 (Totten et al. 2000; Franciosini et al. 2000b; Harmer et al. 2001) and Stock 2 (Sciortino et al. 2000). The results for these clusters however, contrary to the Praesepe case, may be biased due to the not deep enough X-ray surveys, and/or to the incompleteness of optical catalogs and contamination by non-members, or to uncertainties in the cluster distances; additional optical and X-ray observations are needed to confirm the reality of these possible exceptions.
In order to further investigate the anomalous X-ray properties of Praesepe and to better constrain the XLDF of its members by detecting a larger fraction of cluster members, we carried out a deep XMM-Newton pointing of the cluster, covering a field of in the central regions of the cluster. The nominal pointing direction is , (J2000).
2 The optical catalog
We have constructed a catalog of probable and possible members of the Praesepe cluster using as a basis the compilation by RS95 from the proper motion surveys by Klein-Wassink (1927) and Jones & Cudworth (1983), and from the photometric and proper motion study by Jones & Stauffer (1991) (see RS95 for details). We have updated this catalog using the deep proper motion and photometric survey by Hambly et al. (1995), who covered a field of deg2 down to and , providing data for 515 stars with membership probability greater than 40%, and the proper motion study by Wang et al. (1995), who provide data for 924 stars in a region. We also added stars from the radial velocity study by Mermilliod et al. (1990) and from the photometric surveys of low-mass stars and brown dwarf candidates by Williams et al. (1995) and Pinfield et al. (1997). Additional photometry and radial velocity data, as well as information on binarity, was retrieved from several studies. We selected as probable or possible members those stars with radial velocity within 5 km/s of the cluster mean (34.5 km/s), when available, or with membership probability from proper motions greater than 75%, and having photometry consistent with cluster membership, i.e. falling within 0.2 mag below and 0.75 mag above the cluster main sequence. Combining all the available membership information, we assigned to each star a total membership flag (Y for probable members and Y? for possible members). For stars with no proper motion and radial velocity data, the final membership is based on photometry only.
Recently, Adams et al. (2002) performed a new proper motion and spectroscopic study based on data from the 2MASS catalog covering a region of 100 deg2. We added to our catalog those stars that were not already included in the list. The membership probabilities derived by Adams et al. (2002) are lower than in previous studies due to a stronger contamination by field stars; following these authors, we accepted as candidate members stars with %.
The resulting catalog contains 150 stars falling in the XMM-Newton field of view, of which 61 are probable or possible members, including two of the five Praesepe giants, and two candidate members from Adams et al. (2002).
3 Observations and data analysis
The Praesepe cluster was observed as part of the Guaranteed Time programme using the EPIC cameras on board XMM-Newton. The observation (ID 0101440401) started at 21:33 UT on November 7, 2000 and ended at 10:11 UT on November 8, 2000, for a total exposure time of 45.5 ksec in the two MOS cameras and 43 ksec in the PN camera. All cameras were operated in Full Frame mode; the thick and the medium filters were used for MOS and PN, respectively.
Data analysis was carried out using the standard tasks in SAS v.5.3.3. Calibrated and cleaned event files were derived from the raw data using the standard pipeline tasks emchain and epchain and then applying the appropriate filters to eliminate noise and bad events. The PN data were affected by a short period of high background due to proton flares; we have therefore filtered the event file in order to eliminate the affected time segment. The resulting effective exposure time in the PN is 41 ksec. We have limited our analysis to the keV energy band, since data with energy below 0.3 keV is mostly unrelated to bona-fide X-rays, while above 7.8 keV only background is present. Images were accumulated from the event files using a binsize of .
3.1 Source detection
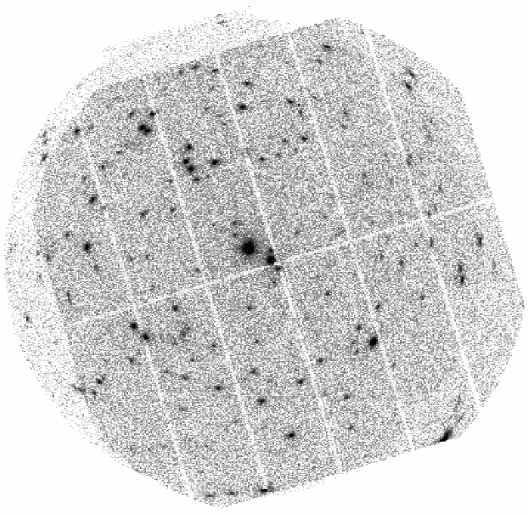
Source detection was first performed on the three individual images using the Maximum Likelihood (ML) algorithm. After checking the relative alignment of the three EPIC cameras by comparing the positions of common sources, we merged the three event files into a single dataset; since the median relative shifts between the three instruments are , i.e. less than one image pixel, we did not apply any correction to the data. The combined EPIC image is shown in Fig. 1.
A combined exposure map was obtained by summing the individual exposure maps of the single instruments with an appropriate scaling factor for PN, in order to take into account the different sensitivities of MOS and PN. The scaling factor was derived by measuring the ratio of PN to MOS count rates for the detected sources with a stellar counterpart: we found a median ratio PN/MOS in the 0.3-7.8 keV energy band. This implies for the merged dataset an equivalent MOS exposure time of ksec.
| Name | RAX | DECX | ML | set | count rate | Mem | Notes | ||||
| (J2000) | () | (cts/ksec) | () | * | () | ||||||
| KW 154 | 2.02 | 39.5 | S | 1.87 | 8.50 | 0.25 | Y | ||||
| KW 155 | 2.73 | 24.8 | S | 1.87 | 9.42 | 0.41 | Y | ||||
| KW 181 | 1.64 | 8056.9 | S | 46.28 | 10.47 | 0.59 | Y | SB, X | |||
| KW 184 | 1.56 | 280.2 | S | 4.45 | 11.56 | 0.90 | Y | SB2, X | |||
| KW 198 | 1.57 | 229.5 | S | 3.53 | 12.59 | 0.96 | Y | ||||
| KW 208 | 3.22 | 1139.7 | S | 21.38 | 10.66 | 0.58 | Y | ||||
| KW 212 | 0.68 | 15189.1 | S | 46.08 | 6.59 | 0.96 | Y | K0III, X | |||
| KW 213 | 1.10 | 212.0 | S | 3.18 | 11.81 | 0.80 | Y | X | |||
| KW 217 | 1.83 | 1399.0 | S | 24.22 | 10.23 | 0.51 | Y | X | |||
| KW 224 | 0.98 | 53890.7 | S | 119.73 | 7.32 | 0.19 | Y | SB1, X | |||
| KW 236 | 1.50 | 145.5 | S | 1.96 | 11.94 | 1.00 | Y | SB, X | |||
| KW 237 | 1.48 | 99.2 | S | 1.67 | 12.86 | 1.00 | Y | X | |||
| KW 246 | 4.42 | 17.9 | M | 9.25 | 12.01 | 0.84 | Y? | SB1 | |||
| KW 250 | 0.78 | 173.0 | S | 4.16 | 9.79 | 0.47 | Y | ||||
| KW 257 | 1.70 | 211.9 | S | 8.67 | 11.00 | 0.77 | Y | SB, PhB | |||
| KW 263 | 1.51 | 348.1 | S | 4.28 | 12.02 | 0.81 | Y | X | |||
| KW 268 | 0.90 | 1191.2 | S | 9.83 | 9.89 | 0.48 | Y | SB1 | |||
| KW 279 | 0.37 | 525.7 | S | 9.35 | 7.70 | 0.20 | Y | SB1 | |||
| KW 283 | 0.66 | 1335.6 | S | 13.74 | 6.44 | 1.02 | Y | K0.5IIIa | |||
| KW 287 | 1.18 | 2369.4 | S | 21.16 | 10.37 | 0.59 | Y | SB1 | |||
| KW 288 | 0.52 | 1863.4 | S | 20.35 | 10.71 | 0.58 | Y | X | |||
| KW 293 | 1.71 | 1609.4 | S | 12.47 | 9.89 | 0.48 | Y | X | |||
| KW 295 | 0.42 | 227.1 | S | 4.87 | 9.41 | 0.41 | Y | ||||
| KW 299 | 2.39 | 45.1 | S | 1.44 | 13.17 | 1.07 | Y | ||||
| KW 313 | 2.75 | 196.5 | S | 4.54 | 12.20 | 0.89 | Y | ||||
| KW 322 | 4.01 | 685.4 | S | 11.01 | 10.87 | 0.68 | Y | SB1, X | |||
| KW 326 | 2.86 | 133.1 | S | 3.20 | 11.34 | 0.72 | Y | ||||
| KW 334 | 1.32 | 125.5 | S | 8.99 | 11.02 | 0.72 | Y | PhB, X | |||
| KW 341 | 2.76 | 234.8 | S | 12.66 | 10.30 | 0.52 | Y | SB1 | |||
| JC 143 | 1.57 | 377.2 | S | 9.90 | 16.92 | 1.57 | Y | PhB, X | |||
| JS 267 | 3.02 | 26.9 | S | 1.81 | 13.75 | 1.21 | Y | ||||
| JS 298 | 1.17 | 229.8 | S | 4.47 | 17.71 | 1.59* | Y? | ||||
| JS 305 | 2.31 | 69.1 | S | 3.31 | 17.92 | Y? | |||||
| JS 329 | 0.86 | 173.9 | S | 5.38 | 14.43 | 1.38 | Y | ||||
| JS 349 | 3.11 | 49.7 | S | 1.56 | 13.91 | 1.33 | Y | ||||
| JS 706 | 0.42 | 420.6 | S | 14.36 | 16.96 | 1.48* | Y | ||||
| JS 718 | 1.16 | 330.5 | S | 4.78 | 18.02 | 1.73* | Y | ||||
| HSHJ 246 | 9.95 | 63.5 | S | 5.49 | 1.70* | Y | |||||
| HSHJ 258 | 5.63 | 10.4 | P | 1.33 | 2.01* | Y | PhB | ||||
| HSHJ 283 | 1.17 | 30.0 | S | 0.89 | 2.07* | Y | PhB | ||||
| HSHJ 289 | 1.09 | 132.5 | S | 2.32 | 1.68* | Y | |||||
| HSHJ 291 | 1.51 | 91.4 | S | 1.51 | 1.77* | Y | |||||
| HSHJ 293 | 2.90 | 48.3 | S | 1.53 | 1.45* | Y | |||||
| HSHJ 302 | 0.79 | 796.8 | S | 7.73 | 1.45* | Y | |||||
| HSHJ 328 | 4.79 | 32.5 | S | 1.62 | 2.07* | Y | PhB | ||||
| WRS 4 | 2.82 | 100.7 | S | 0.88 | 20.79 | Y | |||||
| J0839531+192403 | 0.41 | 766.5 | S | 8.77 | Y? | ||||||
| J0840394+194255 | 2.18 | 35.3 | M | 5.47 | Y | ||||||
| Luminosity in the ROSAT band ( keV) in units of erg s-1; An X indicates ROSAT detections | |||||||||||
| ; ; , ; , | |||||||||||
| The X-ray source is blended with GSC2 N231230081115: the total count rate is , WRS 4 contributes by (see text) | |||||||||||
| Star names are from Klein-Wassink (1927, KW), Jones & Cudworth (1983, JC), Jones & Stauffer (1991, JS), Hambly et al. (1995, HSHJ), | |||||||||||
| and Williams et al. (1995, WRS). For the last two stars from Adams et al. (2002) the 2MASS identification is given | |||||||||||
| Name | RAX | DECX | count rate | Mem | Notes | |||
| (J2000) | (cts/ksec) | () | * | () | ||||
| KW 150 | 0.54 | 1.44 | 7.45 | 0.26 | Y? | |||
| KW 229 | 0.19 | 0.51 | 7.54 | 0.25 | Y | SB2, X | ||
| KW 276 | 0.21 | 0.55 | 7.54 | 0.16 | Y | SB | ||
| KW 284 | 0.40 | 1.06 | 6.77 | 0.27 | Y | SB2 | ||
| KW 300 | 0.22 | 0.59 | 6.30 | 0.17 | Y? | SB2 | ||
| KW 348 | 1.29 | 3.43 | 6.78 | 0.17 | Y? | SB | ||
| KW 573 | 0.80 | 2.11 | 16.06 | 1.50 | Y | |||
| JC 212 | 0.41 | 1.10 | 15.20 | 1.47 | Y | |||
| JS 254 | 0.62 | 1.63 | 14.16 | 1.33 | Y | |||
| JS 301 | 0.25 | 0.66 | 15.12 | 1.48 | Y | |||
| JS 713 | 0.46 | 1.23 | 18.35 | Y? | ||||
| HSHJ 304 | 0.81 | 2.14 | 2.00* | Y | ||||
| RIZpr 11 | 0.22 | 0.59 | Y | , | ||||
| Luminosity in the ROSAT band ( keV) in units of erg s-1 | ||||||||
| An X indicates ROSAT detections. For the other notes see text | ||||||||
| RIZpr 11 is from Pinfield et al. (1997) | ||||||||
| RAX | DECX | ML | set | count rate | Optical ID | Notes | |
|---|---|---|---|---|---|---|---|
| (J2000) | (cts/ksec) | () | |||||
| 597.3 | S | GSC2 N23123008603 | 1.96 | ||||
| 17.8 | P | KW 144 | 5.56 | non-member | |||
| 5731.7 | S | 4C 19.31 | 2.92 | quasar | |||
| 225.8 | S | GSC2 N23123008580 | 2.17 | ||||
| 75.6 | S | GSC2 N23123009122 | 3.21 | ||||
| GSC2 N23123009123 | 4.86 | ||||||
| 33.7 | S | KW 163 | 2.69 | non-member | |||
| 561.4 | S | GSC2 N23122206641 | 1.06 | ||||
| 119.3 | S | GSC2 N23122205633 | 7.87 | ||||
| 32.0 | S | GSC2 N23122205462 | 4.34 | ||||
| 357.9 | S | GSC2 N23122207129 | 0.81 | ||||
| 429.1 | S | KW 206 | 0.69 | non-member, | |||
| 15.1 | S | KW 211 | 6.99 | non-member | |||
| 10.3 | P | GSC2 N23122205423 | 7.52 | ||||
| 301.7 | S | WJJP 95 | 2.84 | non-member, , Wang et al. | |||
| 1398.9 | S | AKS 83 | 2.72 | Andruk et al. (1995) | |||
| 62.3 | S | KW 262 | 2.55 | non-member | |||
| 39.3 | S | KW 266 | 3.27 | non-member, | |||
| 60.5 | S | GSC2 N23122203751 | 5.61 | ||||
| 155.9 | S | GSC2 N23122203733 | 1.01 | ||||
| GSC2 N23122203734 | 6.08 | ||||||
| 16.1 | S | 2MASS J0840219+192117 | 4.86 | ||||
| 165.9 | S | KW 317 | 1.09 | non-member, | |||
| 12.8 | S | 2MASS J0840379+193628 | 4.57 | ||||
| 279.3 | S | GSC2 N23122203337 | 8.42 | ||||
| 183.4 | S | KW 333 | 2.59 | non-member, | |||
Source detection was then performed on the combined dataset. The resulting count rates are MOS equivalent count rates. We detected 183 sources with (corresponding to ) on the combined image; 16 additional sources were detected above the same level only on the single instrument images, giving a total number of 199 sources (note that for sources detected only in the PN, the derived count rates are PN count rates).111 A problem was recently discovered in the ML detection code (XMM-Newton News no. 29), which overestimates the ML values by a factor of . Only two of the sources with are identified with cluster members (KW 246 and HSHJ 258): a visual inspection of the images shows that KW 246 is a real source, while HSHJ 258 could be dubious. In any case, excluding them from our analysis would not affect our results.
In order to find optical counterparts to our source list, we have determined the optimal search radius by constructing the cumulative distribution of the offsets between X-ray and optical position, following RS95. We have adopted a value of , which is expected to give less than 1 spurious identification; however, we chose to use a larger value of for sources at off-axis angles greater than 10 arcmin, in order to take into account possible errors in the X-ray positions due to the distorsion introduced by the XMM-Newton optics. We find that, of the 199 X-ray sources, 48 have a cluster member counterpart within the search radius, including the two giants. For the remaining members with no associated X-ray source we estimated 3 upper limits from the background count rates at the optical position. The X-ray and optical properties of detected and undetected cluster members are given in Tables 1 and 2, respectively.
Nine additional sources have been identified with cluster non-members from our input optical catalog; all of them have proper motion membership probabilities . We have found possible optical counterparts for other 15 sources by cross-correlating the X-ray source list with the SIMBAD database222operated at CDS, Strasbourg, the Guide Star Catalog II333The Guide Star Catalog II is a joint project of the Space Telescope Science Institute and INAF/Osservatorio Astronomico di Torino and the 2MASS catalog444The 2MASS is a joint project of the University of Massachusetts and the Infrared Processing and Analysis Center/California Institute of Technology: one of them is a known quasar, while for the others no membership information is available. All these sources are listed in Table 3. For the remaining 127 sources we did not find any known counterpart in any of the available astronomical catalogs.
4 Results and discussion
4.1 X-ray luminosities
In order to compare our results with previous observations, we have computed X-ray fluxes for both detections and upper limits in the ROSAT band, i.e. keV. A set of conversion factors (CFs) for MOS and PN were computed using PIMMS assuming single-temperature Raymond-Smith plasmas with temperatures in the range K and cm-2, derived assuming an interstellar hydrogen volume density cm-3 (Paresce 1984) and the Hipparcos distance of pc (Robichon et al. 1999). For each temperature we then compared the derived fluxes of common sources in the MOS and PN that are associated with stellar counterparts, and selected the temperature giving consistent values in the two cameras, i.e. such that the median ratio of the PN to MOS fluxes was . This constraint is verified for ; the corresponding adopted CF values are CF erg cm-2 cnt-1 for a single MOS camera and CF erg cm-2 cnt-1 for the PN camera. If we allow a 5% variation in the median PN/MOS ratio (i.e. ), which corresponds to , the derived CFs differ by less than 5%. Using a series of two-temperature models with in the same range yields similar results, with at most a 10% difference in the derived CF values. We note that the MOS CF is used for all sources detected on the summed dataset or on the single MOS datasets, while for sources detected only on the PN the PN CF is applied. X-ray luminosities are then computed using the above mentioned Hipparcos distance.
The sensitivity reached in the central 10 arcmin of the field is erg s-1, i.e. a factor higher than that of the highest sensitivity region of the previous ROSAT observation. The sensitivity is a factor of lower in the outer parts of the image, and drops to erg s-1 in the region covered only by the MOS instruments.

4.2 Detection rates of cluster members
As mentioned in the previous section, 48 sources were identified with cluster members. We detected all the 17 F- and G-type stars included in the XMM-Newton field of view, 10 of the 11 K-dwarfs (91%) and 16 of the 22 M-dwarfs (73%). These detection rates are considerably higher than those obtained by RS95 in their ROSAT raster scan observation (% for F-G stars and % for K and M stars), thanks to the higher sensitivity of our present XMM-Newton observation. Note however that the detection rates of RS95 are considerably higher when considering only Praesepe members included in our field of view; in particular, they detected 7 of the 11 solar-type, i.e late F and G, stars (64% – one star, KW 287, was not included in their optical catalog).
One of the M-type Praesepe candidates, 2MASS J0839531+192403, underwent two flares during our observation, with increases in the count rate by a factor of for the first one and for the second one (Fig. 2). The other sources show generally only low-level variability below the level.
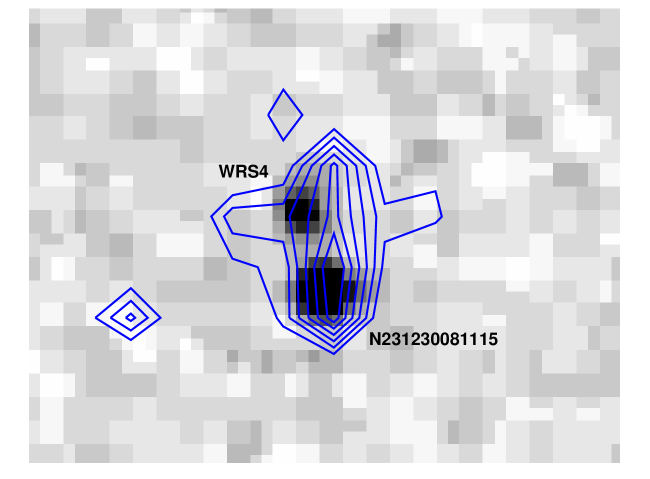
We finally mention the detection of the very low-mass star WRS 4 which is well below the fully convective boundary, having an estimated mass equal to (Williams et al. 1995). The X-ray source associated with WRS 4 is blended with the emission from the nearby (7) star GSC2 N231230081115; the detection algorithm is not able to separate them (see Fig. 3). We have estimated the contribution from WRS 4 using two approaches: (a) by measuring the counts in two circular regions centered on the positions of the two stars, and (b) by fitting the distribution of counts with two gaussian components; in both cases we find that WRS 4 contributes by a factor to the total source count rate of cts/ksec. We therefore derive for WRS 4 an X-ray luminosity erg s-1, and an X-ray over bolometric luminosity ratio . The field of view contains also RIZpr 11 which is one of the faintest known Praesepe members, with an estimated mass , i.e. very close to the substellar limit (Pinfield et al. 1997; Hodgkin et al. 1999); for this object we obtain an upper limit erg s-1 ().

We have detected both late-type giants (KW 212 and KW 283) falling in our field of view. KW 212 is the third brightest source, with erg s-1, while KW 283 is a factor of 3 weaker ( erg s-1).
Three A-type stars () have been detected in our observation. These stars do not possess strong massive winds and cannot generate magnetic fields via the dynamo process due to the lack of a convection zone, thus they should not be X-ray emitters. As discussed in several papers (e.g. Micela et al. 1996, and references therein), the most likely possibility is that their X-ray emission is due to an unseen late-type companion. Indeed, two of them (KW 224 and KW 279) are known SB1 binaries. In particular KW 224 is the brightest source in our sample, with an X-ray luminosity of erg s-1.
4.3 Comparison with previous ROSAT observations

RS95 provide X-ray data for 44 members in common with our observation (the other members missing from the ROSAT sample were not yet known or were considered nonmembers at that time). The XMM-Newton and ROSAT X-ray luminosities of the stars in common are compared in Fig. 4. The ROSAT luminosities have been rescaled in order to account for the new Hipparcos distance. We have checked that the CF used by RS95 is consistent with our choice of the spectral model (i.e. ), therefore no further correction is required in order to compare the results.
For most of the stars in common ROSAT luminosities are comparable with those derived by us, with differences by at most a factor of two. Moreover, for the stars detected only by XMM-Newton the upper limits inferred by RS95 are generally comparable to our estimate of the X-ray luminosities. There are however a few stars that show significant differences between the two observations. In particular, four stars (KW 213, KW 229, KW 236 and KW 237) have ROSAT luminosities more than an order of magnitude higher than those derived by us. However, these stars are close together and to KW 224 and KW 212, which are among the brightest sources in both XMM-Newton and ROSAT (see the two points in the upper right corner of Fig. 4). In the ROSAT image all these sources are blended in a single source. A careful check of the ROSAT image shows that the greatest contribution to the blended source comes indeed from KW 224 and KW 212, with the other stars lying in the wings of the two brightest ones; we therefore conclude that their flux had been largely overestimated by RS95 because of confusion.
Three stars were detected by us at higher luminosity levels than RS95 (KW 181, KW 208 and the giant KW 283); in particular, KW 208 and KW 283 were not detected by RS95 with inferred upper limits lower than the luminosity derived by us. The EPIC light curves of these stars show some low-level variability but no evidence of flares. The difference in their emission levels between ROSAT and XMM-Newton is therefore likely due to long-term variability, possibly linked to activity cycles. We mention that possible long-term variability was also detected among Hyades giants (Stern et al. 1995) based on the comparison between ROSAT and Einstein luminosities.
4.4 Comparison with the Hyades cluster
In order to compare in a consistent way our results with the Hyades, we have recomputed the CF for the ROSAT PSPC observations of the Hyades using the same model spectrum with . We find CF erg cm-2 cnt-1, which is higher than the value () adopted by Stern et al. (1995) and Pye et al. (1994); X-ray luminosities have been derived using the mean Hipparcos distance of pc (Perryman et al. 1998). Although the comparison between Praesepe and the Hyades might be affected by uncertainties in the distance, spectral assumptions, column density and the use of different instruments, a rough estimate of these effects shows that their cumulative effect is small (%) and does not significantly affect our results.
XLDFs for both clusters have been computed using the asurv (Astronomy SURvival Analysis) Ver. 1.2 software package (Feigelson & Nelson 1985; Isobe et al. 1986).
4.4.1 Solar-type stars
In Fig. 5a we compare the XLDF of the Praesepe solar-type (i.e. late F–G, ) members in our field of view with that of the Hyades. As clearly shown in the figure, our data do not evidence the discrepancy found by RS95, although the XLDF of Praesepe is still slightly below that of the Hyades; the median luminosity ( erg s-1) as well as the 25th and 75th percentiles ( and 28.58 erg s-1, respectively) are only slightly lower than those of the Hyades (, 29.33 and 28.74 erg s-1, respectively).
Our results for solar-type stars seem to contradict the previous results by RS95 based on the ROSAT raster scan survey of Praesepe. However if one considers only the subsample of Praesepe stars in the survey of RS95 in common with the present sample, the disagreement between the XMM-Newton and ROSAT results is considerably reduced (Fig. 5b). In fact, as shown in the previous section, the 11 solar-type stars in common have generally ROSAT luminosities or upper limits consistent with the X-ray luminosities derived by us. The difference in the detection rates between the two observations is therefore due to the different sensitivities of the two surveys. Moreover, the median luminosity that we derive based on ROSAT luminosities or upper limits for the 11 stars in common ( erg s-1) is comparable to the median luminosity derived from the present XMM-Newton observations.
In other words, the overall discrepancy between the X-ray properties of the Hyades and Praesepe pointed out by RS95 appears to be mostly due to X-ray faint Praesepe members outside our XMM-Newton field of view (see Fig. 5b). As a further check, we have compared the distribution of ROSAT luminosities of stars falling inside and outside the XMM-Newton field of view, performing a series of two-sample tests with asurv: the tests confirm that the two distributions are different, giving a probability % that they are drawn from the same population.

As mentioned in the introduction, Holland et al. (2000) made the hypothesis that Praesepe is formed by two merged clusters, and found that the X-ray brightest sources are almost exclusively located in the “main” cluster. Based on this fact, they suggested that an age spread may be present between the cluster core and the subcluster stars. Our XMM-Newton observation indeed covers a small area of the main cluster and thus presumably includes the X-ray brightest (and possibly youngest) cluster population.
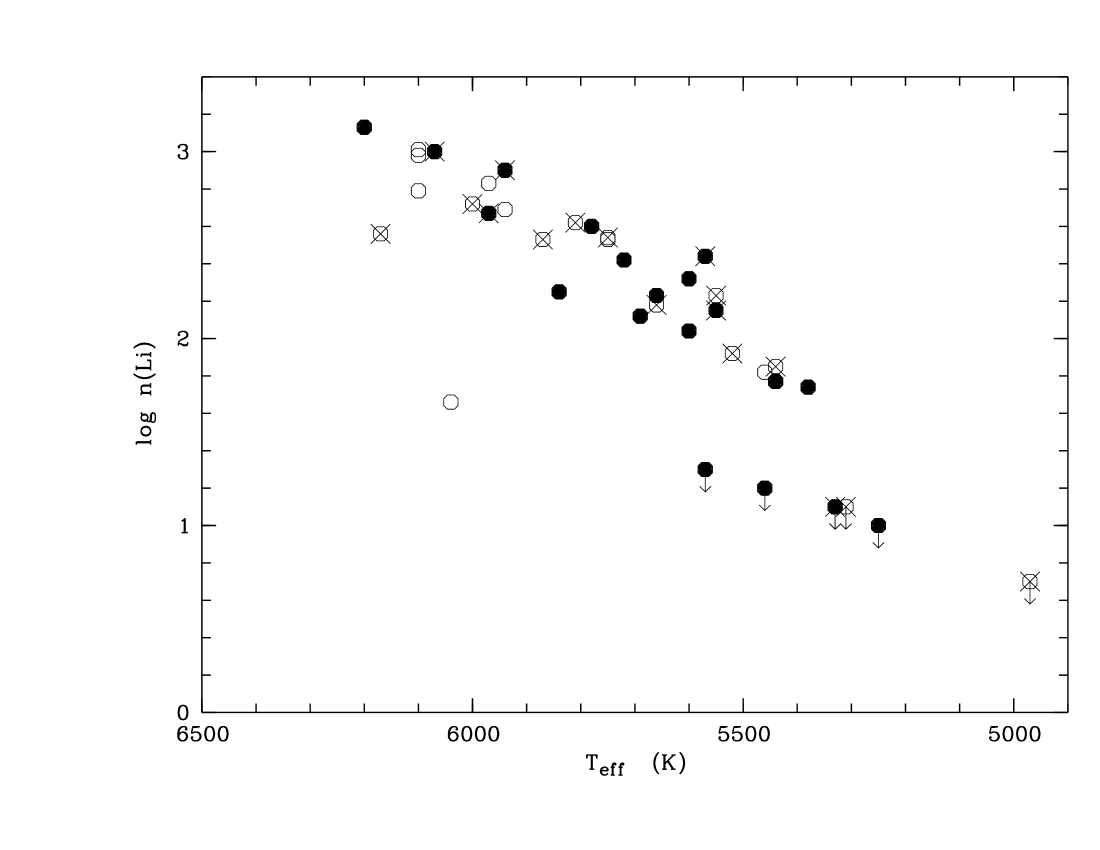
In order to investigate whether Praesepe could be characterized by an age dispersion, we compared the results on X–ray emission with Li abundances derived by Soderblom et al. (1993). These authors noted that Praesepe showed a larger scatter in Li abundances than the Hyades and that confirmed cluster members were present with a Li content well below the average trend. The direct comparison of the spectra of stars with the same color, but different Li abundances, allowed them to exclude that the scatter could be due to measurement uncertainties. They also excluded that the presence of binary stars in their sample could be the reason for the dispersion. 40 Praesepe members in the range have both Li and X-ray measurements available. In Fig. 6 we show lithium abundances ((Li)) as a function of effective temperature for Praesepe members with X-ray data available. Filled symbols denote stars with X-ray luminosity (or upper limit) below the 25th percentile, or erg s-1. Note that, for stars with both ROSAT and XMM data available, we used the latter. Crossed symbols indicate photometric and/or spectroscopic binaries; updated information on binarity was retrieved from Barrado y Navascuès et al. (1998). The figure first shows that, as mentioned by Soderblom et al. (1993), binarity is not the main reason for the dispersion in Li. Second, on one hand, not all the X-ray faint stars are lithium-poor; on the other hand, all but two of the lithium-poor stars (defined as those with a Li abundance more than a factor of 2 below the mean trend) have an X-ray luminosity (or upper limit) below the median value. Whereas these arguments are not conclusive, Li abundances could indeed support the hypothesis of Praesepe being composed by two different subclusters.
4.4.2 Late-type stars
Fig. 7 shows the comparison between the XLDF of Praesepe and the Hyades for K dwarfs () and M dwarfs (). The sample of K stars in Praesepe appears to be slightly less luminous than the Hyades: the median luminosity is erg s-1 compared to 28.35 erg s-1 for the Hyades. On the contrary, Praesepe M stars appear to be significantly more luminous, with a median erg s-1, while the median luminosity of the Hyades M-dwarfs is 27.90 erg s-1. The two-sample tests give a probability of % that the two distributions are drawn from the same population. This result is in agreement with the results of Barrado y Navascuès et al. (1998), who found that M dwarfs in Praesepe were characterized by a higher chromospheric activity than their Hyades counterparts. We have performed the same tests also for the K dwarf samples, but the results are inconclusive (%). We also note that the XLDFs of Praesepe K and M stars lack the high luminosity tail ( erg s-1) which is instead evident in the XLDFs of the Hyades. The high luminosity tail of the Hyades XLDFs is mostly due to binaries, which have been shown to be significantly more luminous than single stars of the same spectral type (Pye et al. 1994). Our sample contains only a small fraction of late-type binaries, all of which have been detected: however, their X-ray luminosity is comparable to that of single stars.
| KW 224 | KW 212 | KW 181 | |
| (keV) | |||
| (keV) | … | ||
| ( cm-3) | |||
| ( cm-3) | … | ||
| erg cm-2 s-1) | |||
| is the unabsorbed flux in the keV band | |||

4.5 Spectral analysis of the brightest sources
The three brightest Praesepe members in our sample (KW 224, KW 212 and KW 181) have more than 1000 counts in the PN, allowing us to perform a spectral analysis of their emission. Spectra have been extracted using an extraction region of radius for KW 224 and KW 181, and for KW 212 to avoid a nearby source. Background spectra were extracted from equal circular regions free from X-ray sources and close to each of the stars. Response matrices were generated for each source using the standard SAS tasks. Spectra have been rebinned in order to have at least 20 counts per bin, and were fitted in XSPEC v.11.2.0 in the energy range keV, using a two-temperature APEC model with varying global metal abundance . In the case of KW 212 we find that a single temperature model is sufficient to fit the spectrum. The column density was kept fixed to cm-2, since its value was not constrained by the fit.
The best-fit parameters are given in Table 4; the three spectra together with the best-fit models are shown in Fig. 8. We find that the coronae of KW 224 and KW 181 have similar 2-T components of and MK, although the emission measure ratio is different ( for KW 224 and for KW 181). The giant KW 212 is cooler, with a single temperature of MK. We find subsolar abundances for all sources () in spite of the almost solar photospheric metallicity of Praesepe stars. Subsolar coronal abundances are commonly found in most stellar coronae, and in some cases they are also significantly lower than the photospheric abundance, e.g. in the young star AB Dor (Maggio et al. 2000; Güdel et al. 2001). We mention that similar results (with Fe Fe☉) have been found also for two Hyades stars (the giant Tau and the solar-type star VB 50) observed with XMM-Newton (Franciosini et al. 2002).
The X-ray flux derived from the spectral fits is consistent with that derived from the spatial analysis, within the 10% uncertainty in the assumed values of the CFs.
5 Conclusions
In this paper we have presented the results of a new observation of the Praesepe cluster performed with XMM-Newton, which resulted in the detection of 100% of the solar-type stars, 91% of the K stars and 73% of the M dwarfs in the field of view. In particular, we have clearly detected the very low-mass star WRS 4, which is well below the fully convective boundary, with erg s-1.
Our XMM-Newton observation shows that the X-ray properties of our sample of Praesepe solar-type stars are in good agreement with the Hyades, apparently in contrast with the previous ROSAT results; however, we have shown that the discrepancy between Praesepe and the Hyades previously found by ROSAT apparently shows up only when considering a much larger area of the Praesepe cluster than the one covered by the XMM-Newton field of view. This finding seems to support the suggestion made by Holland et al. (2000) that Prasepe may be formed by two merged clusters of different ages: our XMM-Newton pointing covers in fact a part of the “main” cluster, where the brightest X-ray sources are located. We mention, however, that the large proper motion study by Adams et al. (2002) does not suggest a peculiar kinematic history for Praesepe. New XMM-Newton observations pointed in the outer regions of Praesepe are therefore required to verify whether this hypothesis is correct.
Spectral analysis of the three brightest sources has shown that the coronae of these stars have metallicities ranging from 0.2 to 0.5 times the solar value, i.e. significantly lower than the measured photospheric abundance, which is almost solar, in agreement with other observations of stellar coronae.
Most of the sources do not show evidence of variability greater than a factor of 2 over a timescale of years. Only three sources are significantly brighter during our XMM-Newton observation, likely as a consequence of activity cycles. On the other hand, the sources with much higher X-ray luminosity in ROSAT compared to the present observation had been overestimated due to confusion.
Thanks to the higher sensitivity of XMM-Newton with respect to previous satellites, we have detected a large number of new X-ray sources with no known cataloged optical counterpart. Optical follow-up photometric and spectroscopic observations will be required to ascertain their nature and determine whether part of them are unknown faint members of the cluster.
Acknowledgements.
We thank the anonymous referee for his useful comments and suggestions which helped us to improve the paper. This research has made use of the Open Cluster Database, provided by C.F. Prosser (deceased) and J.R. Stauffer, currently available at http://cfa-www.harvard.edu/~stauffer/opencl/ or by anonymous ftp at cfa-ftp.harvard.edu (cd /pub/stauffer/clusters), and of the WEBDA Database, provided by J.-C. Mermilliod, available at http://obswww.unige.ch/webda/. We acknowledge partial support by Ministero dell’Istruzione, Università e Ricerca (MIUR) and by the Italian Space Agency (ASI).References
- Adams et al. (2002) Adams, J. D., Stauffer, J. R., Skrutskie, M. F., et al. 2002, AJ, 124, 1570
- Andruk et al. (1995) Andruk, V., Kharchenko, N., Schilbach, E., & Scholz, R. D. 1995, AN, 316, 225
- Barrado y Navascuès et al. (1998) Barrado y Navascuès, D., Stauffer, J. R., & Randich, S. 1998, ApJ, 506, 347
- Feigelson & Nelson (1985) Feigelson, E. D. & Nelson, P. I. 1985, ApJ, 293, 192
- Franciosini et al. (2000a) Franciosini, E., Randich, S., & Pallavicini, R. 2000a, A&A, 357, 139
- Franciosini et al. (2000b) Franciosini, E., Randich, S., & Pallavicini, R. 2000b, in Stellar Clusters and Associations: Convection, Rotation, and Dynamos, ed. R. Pallavicini, G. Micela, & S. Sciortino, ASP Conf. Ser. No. 198 (San Francisco: ASP), 447
- Franciosini et al. (2002) Franciosini, E., Sanz-Forcada, J., Maggio, A., & Pallavicini, R. 2002, in MSSL Workshop on High resolution X-ray spectroscopy with XMM-Newton and Chandra, http://www.mssl.ucl.ac.uk/~gbr/rgs_workshop/papers/franci-osini_e.ps
- Friel & Boesgaard (1992) Friel, E. D. & Boesgaard, A. M. 1992, ApJ, 387, 170
- Güdel et al. (2001) Güdel, M., Audard, M., Briggs, K., et al. 2001, A&A, 365, L336
- Hambly et al. (1995) Hambly, N. C., Steele, I. A., Hawkins, M. R. S., & Jameson, R. F. 1995, A&AS, 109, 29
- Harmer et al. (2001) Harmer, S., Jeffries, R. D., Totten, E. J., & Pye, J. P. 2001, MNRAS, 324, 473
- Hodgkin et al. (1999) Hodgkin, S. T., Pinfield, D. J., Jameson, R. F., et al. 1999, MNRAS, 310, 87
- Holland et al. (2000) Holland, K., Jameson, R. F., Hodgkin, S., Davies, M. B., & Pinfield, D. 2000, MNRAS, 319, 956
- Isobe et al. (1986) Isobe, T., Feigelson, E. D., & Nelson, P. I. 1986, ApJ, 306, 490
- Jeffries (1999) Jeffries, R. D. 1999, in Solar and Stellar Activity: Similarities and Differences, ed. C. J. Butler & J. G. Doyle, ASP Conf. Ser. No. 158 (San Francisco: ASP), 75
- Jones & Cudworth (1983) Jones, B. F. & Cudworth, K. 1983, AJ, 88, 215
- Jones & Stauffer (1991) Jones, B. F. & Stauffer, J. R. 1991, AJ, 102, 1080
- Klein-Wassink (1927) Klein-Wassink, W. J. 1927, Publ. Kapteyn Astron. Lab. Groningen, 41, 1
- Maggio et al. (2000) Maggio, A., Pallavicini, R., Reale, F., & Tagliaferri, G. 2000, A&A, 356, 627
- Mermilliod (1997) Mermilliod, J.-C. 1997, Mem. Soc. Astr. It., 68, 853
- Mermilliod et al. (1990) Mermilliod, J.-C., Weis, E. W., Duquennoy, A., & Mayor, M. 1990, A&A, 235, 114
- Micela et al. (1996) Micela, G., Sciortino, S., Kashyap, V., Harnden, Jr., F. R., & Rosner, R. 1996, ApJS, 102, 75
- Paresce (1984) Paresce, F. 1984, AJ, 89, 1022
- Perryman et al. (1998) Perryman, M. A. C., Brown, A. G. A., Lebreton, Y., et al. 1998, A&A, 331, 81
- Pinfield et al. (1997) Pinfield, D. J., Hodgkin, S. T., Jameson, R. F., Cossburn, M. R., & von Hippel, T. 1997, MNRAS, 287, 180
- Pizzolato et al. (2001) Pizzolato, N., Ventura, P., D’Antona, F., et al. 2001, A&A, 373, 597
- Pye et al. (1994) Pye, J. P., Hodgkin, S. T., Stern, R. A., & Stauffer, J. R. 1994, MNRAS, 266, 798
- Randich (2000) Randich, S. 2000, in Stellar Clusters and Associations: Convection, Rotation, and Dynamos, ed. R. Pallavicini, G. Micela, & S. Sciortino, ASP Conf. Ser. No. 198 (San Francisco: ASP), 401
- Randich & Schmitt (1995) Randich, S. & Schmitt, J. H. M. M. 1995, A&A, 298, 115
- Robichon et al. (1999) Robichon, N., Arenou, F., Mermilliod, J.-C., & Turon, C. 1999, A&A, 345, 471
- Sciortino et al. (2000) Sciortino, S., Micela, G., Favata, F., Spagna, A., & Lattanzi, M. G. 2000, A&A, 357, 460
- Soderblom et al. (1993) Soderblom, D. R., Fedele, S. B., Jones, B. F., Stauffer, J. R., & Prosser, C. F. 1993, AJ, 106, 1080
- Stern et al. (1995) Stern, R. A., Schmitt, J. H. M. M., & Kahabka, P. T. 1995, ApJ, 448, 683
- Totten et al. (2000) Totten, E., Jeffries, R., Harmer, S., & Pye, J. 2000, in Stellar Clusters and Associations: Convection, Rotation, and Dynamos, ed. R. Pallavicini, G. Micela, & S. Sciortino, ASP Conf. Ser. No. 198 (San Francisco: ASP), 451
- Wang et al. (1995) Wang, J. J., Chen, L., Zhao, J. H., & Jiang, P. F. 1995, A&AS, 113, 419
- Williams et al. (1995) Williams, D. M., Rieke, G. H., & Stauffer, J. R. 1995, ApJ, 445, 359