Re-analysis of VLT Data for M83 with Image Subtraction — Nine-fold Increase in Number of Cepheids
Abstract
We apply the image subtraction method to re-analyze the ESO Very Large Telescope data on M83 (NGC 5236), obtained and analyzed by Thim et al. Whereas Thim et al. found 12 Cepheids with periods between 12-55 days, we find 112 Cepheids with periods ranging from 7-91 days, as well as other variables. These include 2 candidate eclipsing binaries, which, if confirmed, would be the first optically discovered outside the Local Group. We thus demonstrate that the image subtraction method is much more powerful for detecting variability, especially in crowded fields. However, HST observations are necessary to obtain a Cepheid period-luminosity distance not dominated by blending and crowding. We propose a “hybrid” approach, where numerous Cepheids are discovered and characterized using large ground-based telescopes and then followed-up with the HST to obtain precise distances.
1 Introduction
Cepheid variables are one of the most important primary distance indicators due to the period-luminosity (PL) relation they obey. Precise Cepheid distances require a large number of Cepheids with accurate photometry and periods. However, the more distant the galaxy, the more important become the effects of crowding and blending with nearby luminous stars (Mochejska et al. 2000; Stanek & Udalski 1999; Mochejska et al. 2001), which introduce systematic, one-sided errors in the distance measurements and skew the distance towards artificially lower values. These effects can only be disentangled satisfactorily with the Hubble Space Telescope, which has the required spatial resolution, especially now with the new instrumentation (ACS).
The spiral galaxy M83, the principal member of the nearby M83 group, is a good target to obtain a Cepheid distance to. Observations of M83 with the Very Large Telescope (VLT) were analyzed by Thim et al. (2003) with point-spread function (PSF) photometry, discovering 12 Cepheids, which were used to derive the Cepheid distance to the galaxy. However, the “traditional” method of doing PSF fitting photometry on all the stars on an image and looking for variations in the light from night to night is not very efficient or effective in finding Cepheids in crowded fields. In this paper we re-analyze the VLT data for M83 using image subtraction to demonstrate this fact.
Observations of M83, at a distance of Mpc (Thim et al., 2003), with the 8.2 meter VLT and median seeing are roughly equivalent to the DIRECT project observations of M31/M33 with the FLWO 1.2 meter telescope, at a distance of kpc (Stanek & Garnavich 1998) with seeing. This fact partly motivated this paper – we would consider such poor seeing data unacceptable to run PSF photometry on. The three most recent DIRECT papers (Mochejska et al., 2001a, b; Bonanos et al., 2003) have used Alard’s image subtraction package ISIS (Alard & Lupton, 1998; Alard, 2000) to discover variables, in particular detached eclipsing binaries and Cepheids, in M31 and M33. This method has become a method of choice for variability searches in crowded fields.
At the distance of M83, the issue of blending must be taken into account in deriving the Cepheid distance. The median seeing of the VLT data is , which corresponds to pc in M83. As first discussed by Mochejska et al. (2000), blending is the close association of a Cepheid with one or more intrinsically luminous stars, which is the result of the higher value of the star-star correlation function for massive stars, such as Cepheids, compared to random field stars. This effect cannot be detected within the observed PSF by usual analysis. Mochejska et al. (2000, 2001c) address the effect of blending on the Cepheid distances to M31 and M33. They compare high resolution HST images to the ground-based DIRECT data and find that blending can affect the flux of a Cepheid typically by , which leads to an underestimation of the true distance. This phenomenon is different from crowding, which is the random background luminosity fluctuation in each resolution element. In M83, a large fraction of the flux of a blended Cepheid could come from its companions, assuming the effect scales to that in M31 and M33. Based on a simulation by Stanek & Udalski (1999), this would result in a significant distance bias. Whereas the discovery of Cepheids in nearby galaxies can be done adequately from the ground given good signal-to-noise photometry, deriving the Cepheid PL distance requires high spatial resolution HST imaging.
In this paper, we apply the image subtraction method to the M83 dataset. In Section 2 we describe the observations, in Section 3 the image subtraction method and finally the results, which are discussed in Section 4.
2 Observations
We have retrieved the M83 data obtained by FORS1 on the ESO Very Large Telescope, from the ESO/ST-ECF Science Archive Facility. The field of view is arcminutes, with a pixel scale of per pixel. The Tektronix CCD has 24 m pixels. There are 34 epochs in -band spanning a period of 1.5 years, from January 2000 to July 2001. Each epoch consists of 3-4 subexposures of 400 or 500 sec. More details are given by Thim et al. (2003).
3 The Method of Image Subtraction and Results
The images were overscan corrected and flat fielded with standard IRAF111IRAF is distributed by the National Optical Astronomy Observatories, which are operated by the Association of Universities for Research in Astronomy, Inc., under cooperative agreement with the NSF. routines. The transformation from rectangular to equatorial coordinates was derived using 84 transformation stars from the USNO-B1.0 (Monet et al., 2003) catalog. The average difference between the catalog and the computed coordinates for the transformation stars was less than in RA and in Dec. Next, we ran the image subtraction package ISIS (Alard & Lupton, 1998; Alard, 2000) on the 104 -band images of M83.
The ISIS reduction procedure consists of several steps. Initially, all the frames are transformed to a common coordinate grid. The best seeing frame, FORS.2000-04-05T06:16:02.924 in our case, is chosen to be the reference image. Next, a composite reference image is created by stacking several best seeing frames. For each frame, the composite reference image is convolved with a kernel to match its PSF and then subtracted. On the subtracted images, the constant stars cancel out, and only the signal from variable stars remains. A median image is constructed of all the subtracted images, and the variable stars are identified visually as significant peaks. Finally, profile photometry is extracted from the subtracted images. Mochejska et al. (2001a) describes this procedure in more detail.
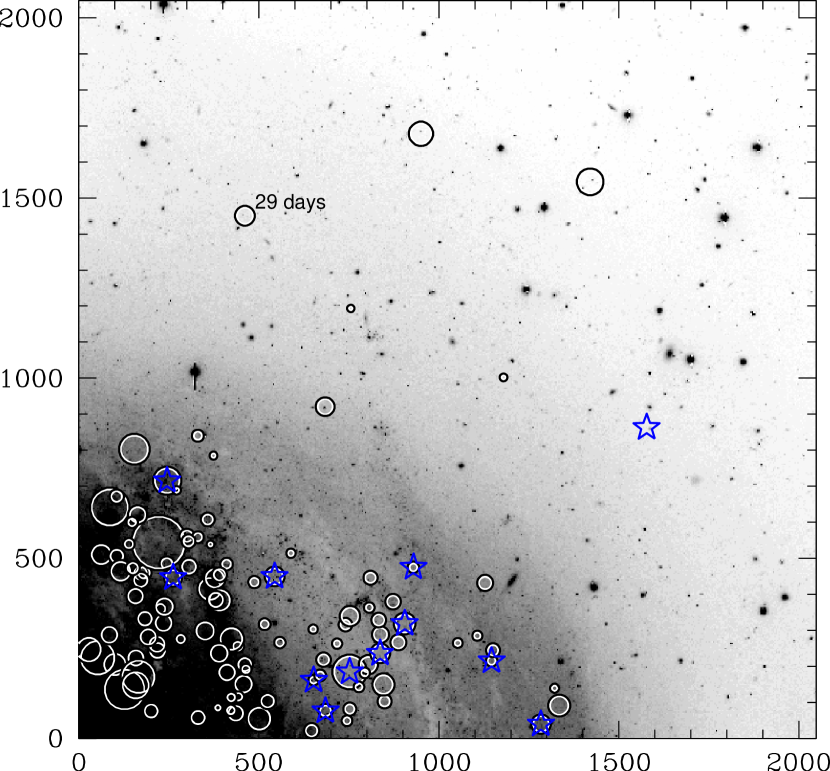
After locating the positions of the bright peaks, we obtained light curves for candidate variables. We ran them through the DIRECT pipeline (Kaluzny et al., 1998; Stanek et al., 1998) which fits model Cepheid light curves and eclipsing binary light curves and classifies the stars as Cepheids, eclipsing binaries (EBs) or other variables. After checking these light curves, we found 112 Cepheids, with periods ranging from 7 to 91 days, 2 candidate EBs and other variable stars. Figure 1 presents 10 sample Cepheid flux light curves. Table 1 lists the coordinates (RA, Dec) and (X, Y) on the reference image for each Cepheid and the periods. We recover all but one of the Cepheids found by Thim et al. (2003), the Cepheid C4. The periods we derive agree well with those of Thim et al. (2003), the median difference being 0.04 days and the largest difference being 0.22 days for Cepheid C6. Figure 2 plots the location of the Cepheids as circles on the reference image, their size being proportional to the period. A 29 day Cepheid is labeled for scale. On the same plot, the stars show the position of the 12 Cepheids from Thim et al. (2003). The image subtraction method detects many Cepheids in the more crowded part of the field, which is much harder to do with the “traditional” PSF photometry method.

We do not claim completeness in finding Cepheids, however we do show that Cepheids in the highly crowded and blended central regions of the galaxy can be detected from the ground with high quality data, such as these VLT observations. High resolution observations are necessary to disentangle blending for Cepheids both in the outer and inner parts of the galaxy.
4 Discussion
This paper re-analyzes the excellent VLT data of M83 obtained by Thim et al. (2003) using the image subtraction method. The resulting nine-fold increase in the number of Cepheids detected indicates that image subtraction should be used in crowded fields. We also present parameters and sample light curves for the 112 Cepheids we have found. These additional Cepheids are valuable for determining the PL distance to M83 accurately. However, HST observations are necessary to resolve blending effects. After we started working on this project, we became aware of the Cycle 12 program with the title “M83: Calibrating the Cepheid PL Relation” (PI: B. Madore). We note that some of these 112 Cepheids might be Population II variables, however, a PL diagram would be necessary to distinguish them.
In Figure 3, we plot the flux amplitude versus period relation for the 112 Cepheids. We have taken the full flux amplitude from the light curve and plotted the logarithm of this quantity versus logarithm of the period . There is a definite correlation, however, it is not very tight. Paczyński & Pindor (2000) demonstrate that the period-flux amplitude relation is not universal and needs to be calibrated before being used to measure distances accurately.
In addition to these Cepheids, we also find other variable stars, including 2 candidate eclipsing binaries (EBs). If these are confirmed from their position on a CMD to be located in M83, they would be the first optically discovered EBs outside the Local Group. Figure 4 presents some of the more interesting light curves of other periodic or non periodic variables that we find, including the candidate EBs. There are two long period variables, which are possibly Cepheids with periods of 132 and 195 days. Their positions on the PL diagram would verify this.


References
- Alard & Lupton (1998) Alard, C., & Lupton, R. 1998, ApJ, 503, 325
- Alard (2000) Alard, C. 2000, A&AS, 144, 363
- Bonanos et al. (2003) Bonanos, A. Z., Stanek, K. Z., Sasselov, D. D., Mochejska, B. J., Macri, L. M., & Kaluzny, J. 2003, AJ, in press (astro-ph/0303307)
- Kaluzny et al. (1998) Kaluzny, J., Stanek, K. Z., Krockenberger, M., Sasselov, D. D., Tonry, J. L., & Mateo, M. 1998, AJ, 115, 1016
- Mochejska et al. (2000) Mochejska, B. J., Macri, L. M., Sasselov, D. D., & Stanek, K. Z. 2000, AJ, 120, 810
- Mochejska et al. (2001a) Mochejska, B. J., Kaluzny, J., Stanek, K. Z., Sasselov, D. D., & Szentgyorgyi, A. H. 2001a, AJ, 121, 2032
- Mochejska et al. (2001b) Mochejska, B. J., Kaluzny, J., Stanek, K. Z., Sasselov, D. D., & Szentgyorgyi, A. H. 2001b, AJ, 121, 2032
- Mochejska et al. (2001c) Mochejska, B. J., Macri, L. M., Sasselov, D. D., & Stanek, K. Z. 2001c, AJ, submitted (astro-ph/0103440)
- Monet et al. (2003) Monet, D., et al. 2003, AJ, 125, 984
- Paczyński & Pindor (2000) Paczyński, B., & Pindor, B. 2000, ApJ, 533, L103
- Stanek & Garnavich (1998) Stanek, K. Z., & Garnavich, P. M. 1998, ApJ, 503, L131
- Stanek et al. (1998) Stanek, K. Z., Kaluzny, J., Krockenberger, M., Sasselov, D. D., Tonry, J. L., & Mateo, M. 1998, AJ, 115, 1894
- Stanek & Udalski (1999) Stanek, K. Z., & Udalski, A. 1999, preprint (astro-ph/9909346)
- Thim et al. (2003) Thim, F., Tammann, G. A., Saha, A., Dolphin, A., Sandage, A., Tolstoy, E., & Labhardt, L. 2003, AJ, in press (astro-ph/0303101)
| RA | Dec | X | Y | Commentsa | |
|---|---|---|---|---|---|
| 13:36:50.6 | 29:48:40.9 | 10.587 | 589.28 | 514.04 | |
| 13:36:43.4 | 29:49:31.0 | 11.313 | 1052.49 | 264.76 | |
| 13:36:42.6 | 29:49:27.0 | 11.745 | 1106.87 | 285.00 | |
| 13:36:48.6 | 29:49:31.1 | 11.997 | 717.45 | 263.21 | |
| 13:36:49.6 | 29:49:51.3 | 12.464 | 652.30 | 161.81 | C9, 12.47 days |
Note. — Table 1 is available in its entirety in the electronic version of the Journal. A portion is shown here for guidance regarding its form and content.