22institutetext: Instituto de Astronomia, Geofísica e Ciências Atmosféricas, Universidade de São Paulo, C.P. 3386, 01060-970 São Paulo - SP, Brazil
Formation scenarios for the young stellar associations between galactic longitudes ††thanks: Tables 1 to 4 are only available in electronic form at the CDS via anonymous ftp to cdsarc.u-strasbg.fr (130.79.128.5) or via http://cdsweb.u-strasbg.fr/Abstract.html
We investigate the spatial distribution, the space velocities and age distribution of the pre-main sequence (PMS) stars belonging to Ophiuchus, Lupus and Chamaeleon star-forming regions (SFRs), and of the young early-type star members of the Scorpius-Centaurus OB association. These young stellar associations extend over the galactic longitude range from to , and are at a distance interval of around 100 and 200 pc. This study is based on a compilation of distances, proper motions and radial velocities from the literature for the kinematic properties, and of basic stellar data for the construction of Hertzsprung-Russel diagrams. Although there was no well-known OB association in Chamaeleon, the distances and the proper motions of a group of 21 B- and A-type stars, taken from the Hipparcos Catalogue, lead us to propose that they form a young association. We show that the young early-type stars of the OB associations and the PMS stars of the SFRs follow a similar spatial distribution, i.e., there is no separation between the low and the high-mass young stars. We find no difference in the kinematics nor in the ages of these two populations studied. Considering not only the stars selected by kinematic criteria but the whole sample of young early-type stars, the scattering of their proper motions is similar to that of the PMS stars and all the young stars exhibit a common direction of motion. The space velocities of the Hipparcos PMS stars of each SFR are compatible with the mean values of the OB associations. The PMS stars in each SFR span a wide range of ages (from 1 to 20 Myr). The ages of the OB subgroups are 8–10 Myr for Upper Scorpius (US), and 16–20 Myr for Upper Centaurus Lupus (UCL) and for Lower Centaurus Crux (LCC). Thus, our results do not confirm that UCL is older than the LCC association. Based on these results and the uncertainties associated with the age determination, we cannot say that there is indeed a difference in the age of the two populations. We analyze the different scenarios for the triggering of large-scale star-formation that have been proposed up to now, and argue that most probably we are observing a spiral arm that passes close to the Sun. The alignment of young stars and molecular clouds and the average velocity of the stars in the opposite direction to the Galactic rotation agree with the expected behavior of star formation in nearby spiral arms.
Key Words.:
Stars: formation – stars: pre-main sequence – stars: early-type – stars: kinematics – Hertzsprung-Russell (HR) and C-M diagrams – open clusters and associations: general1 Introduction
The Ophiuchus, Lupus and Chamaeleon molecular cloud complexes are prominent low-mass star-forming regions (SFRs) close to the Sun (100–200 pc), situated between galactic longitudes and , and reaching relatively high galactic latitudes ( for Oph and for Chamaeleon). Their alignment, as can be seen in a projection on the Galactic plane (e.g., Dame et al. dame (1987)), suggest that they are part of an elongated structure that extends over more than 120 degrees in longitude, from the Aquila Rift to the Vela region. This structure also includes an association of massive stars, the Scorpius-Centaurus (Sco-Cen) OB association, with its subgroups Upper Scorpius (US), Upper Centaurus Lupus (UCL), and Lower Centaurus Crux (LCC). The prominent molecular cloud complexes (Ophiuchus, Lupus, Chamaeleon) are connected by filaments to the Galactic plane, and there seems to be an extended thin layer of gas and dust parallel to the aligned structure at distances of about 100–150 pc from the Sun. This was discovered through studies of reddening as a function of distance of stars, which established the physical association between the Southern Coalsack and the Chamaeleon and Musca clouds (Corradi et al. corradi (1997)), and from a mapping of NaI absorption lines (Genova et al. genova (1997)).
Our purpose is to investigate the dynamics of the star-formation process in this extended region of the sky where possibly a dominant mechanism triggered the formation of all the stars. Many different scenarios have been proposed for the formation of this complex of stars and clouds, for instance the sequential star-formation process proposed by Blaauw (blaauw64 (1964), blaauw91 (1991)), the Gould Belt model of Olano & Poppel (olano87 (1987)), which considers that a large disturbance originated in the Taurus region and is propagating in the Galactic plane, or the direct impact of high velocity clouds on the disk proposed by Lépine & Duvert (lepine94 (1994)).
Useful stars to study the dynamics of the star-formation process are those that are younger than about 20 Myr. In such a short time, stars cannot move far from their birthplace, and their trajectories can be traced back based on their present space velocities. Furthermore, the age of groups of stars can be estimated from Hertzsprung-Russel diagrams. Two main classes of stars fall in this range of ages. Most massive stars have already reached the main sequence, or evolved away from it, and form the bright OB associations. On the other hand, most stars with mass less than a few Solar masses, in the same range of age of the early-type stars of the OB associations, have not yet reached the main sequence, and are considered as pre-main sequence (PMS) stars, and include T Tauri (TT) stars and Herbig Ae/Be (HAeBe) stars. A detailed analysis of the motion of the PMS stars and of the early-type stars members of OB associations is essential to derive constraints to the star-formation models. Different behavior of space velocities, velocity gradients and gradients of age of the stellar associations can be predicted from the above scenarios and other possible ones.
Usually the star formation history of these close SFRs and of the Sco-Cen OB association has been studied separately for each sub-region, and also separately for massive and low-mass stars. In this work, we compare the spatial distribution and kinematics of the PMS stars with those of the young early-type stars. We know that the group of PMS associated with the Ophiuchus SFR and the young early-type stars of the US OB association are situated in the same region of the sky. Several works have studied the PMS population of the US association, e.g., Walter et al. (walter (1994)), Martín (martin (1998)), Sciortino et al. (sciortino (1998)), Preibisch et al. (preib98 (1998)), Preibisch & Zinnecker (preib99 (1999)), and recently, Preibisch et al. (preib02 (2002)). The PMS group of the Lupus SFR and the UCL OB association are also situated in the same region of the sky (Mamajek et al. mamaj02 (2002)). Other works, e.g., the PDS survey (Gregorio-Hetem et al. gregorio (1992); Torres et al. torr95 (1995); Torres torr99 (1999)), Feigelson & Lawson (feigel97 (1997)), and recently, Mamajek et al. (mamaj02 (2002)), have shown that the LCC OB association also contains PMS stars. However, there is no well-known OB association in Chamaeleon. Therefore, in this work we verify the hypothesis that there also is an OB association in Chamaeleon and we verify its relation to the PMS stars. We also re-examine the age determination of the different stellar associations. Finally, we discuss the consistency of these data with the main star-formation scenarios.
2 The samples of young stars
2.1 Pre-main sequence stars
Sartori (sart00 (2000)) collected a list as exhaustive as possible of known TT and HAeBe stars clearly associated to the SFRs of Ophiuchus, Lupus, Centaurus and Chamaeleon, and also those that are situated in an extended region around the SFRs. The list contains 610 stars, discovered through X-ray surveys, infrared surveys, H surveys, and other means, that had their nature confirmed by optical spectroscopy. Although most TT stars are not bright enough to have been observed by the Hipparcos mission, a few of them are found in the Hipparcos catalogue (Neuhäuser & Brandner neuhau (1998); Wichmann et al. wich98 (1998); Bertout et al. bertout (1999)). In the studied SFRs, 39 of the selected PMS stars are in the Hipparcos Catalogue (ESA esa (1997)). In Table 1 (only available in electronic form at the CDS) we present the 570 PMS stars that are not in the Hipparcos Catalogue and in Table 2 (only available at the CDS too) the 39 Hipparcos stars. In these tables, we present the names of the stars in Col. 1. In Table 2, we also present the Hipparcos numbers (Col. 2), the type of the stars (classical or weak-line TT, or HAeBe) in Col. 3 and the references of this classification in Col. 4.
2.2 Young early-type stars
The sample of young early-type stars is largely based on the work of de Zeeuw et al. (dezeeuw (1999), hereafter dZ99), who studied the young stars belonging to the subgroups of Sco-Cen OB association. In that work, the selection of stars members of the associations, based on Hipparcos parallaxes and proper motions, made use of a combination of the convergence point method and the “spaghetti” method of Hoogerwerf & Aguilar (hooger (1999)). In Table 3 (only available at the CDS), we list 521 stars selected by dZ99 as secure members. In this table, the Col. 1 lists the HD numbers and Col. 2 the Hipparcos numbers. The secure members selected by dZ99 are mostly B-, A-, and F-type stars (there are no O-type stars in this OB association), but they also selected some G-, K-, and even M-type stars. dZ99 point out that their kinematic selection method accepts some field stars as association members and they describe their method for estimating the expected number of these interlopers. Although few G- to M-type stars have been predicted as interlopers, they believe that the majority of the G- to M-type members probably do not belong to the associations. We discuss the membership of these late-type stars in Sect. 5.
In their work, dZ99 found a considerable overlap of the secure members with the stars they call as classical members (stars traditionally considered as members of the Sco-Cen OB association). However, they found also significant differences: the vector point diagram of the secure members is more concentrated than that of the classical members, and the parallax distribution is narrower. They attribute these results to a reduced contamination of field stars. Comparing the dZ99 selection with the list of early-type stars previously considered as belonging to the Sco-Cen OB association by de Geus et al. (degeus (1989), hereafter dG89), we verified that several of these classical members have been indeed excluded by the method of dZ99. We believe, based on the comparison with the PMS star proper motions and on the H-R diagrams later discussed (Sects. 4 and 5), that the selection of dZ99 is too restrictive, and that many of the stars excluded by these authors are actually members of the associations. We decided to also consider in this work these sample of classical members excluded by dZ99. We selected in the list of dG89 the stars having Hipparcos parallax measurements of good quality, for which the derived distances are closer than 250 pc. In this way, we added 35 stars in US, 41 in UCL, and 12 in LCC. The list of these stars is presented in Table 4 (only available at the CDS – Col. 1 lists the HD numbers and Col. 2 the Hipparcos numbers).
2.3 Chamaeleon OB association
In the Chamaeleon region there was no previously well-known OB association, although Eggen (eggen (1998)) mentioned the existence of an association that could be an extension of the Sco-Cen one. We searched in the Hipparcos Catalogue for B- and A-type stars situated in the whole region of the sky where Chamaeleon PMS stars are found. We selected 21 stars that have distance values in the range of distances of the PMS stars (between 120 and 220 pc). These stars are presented in Table 5, where Col. 1 lists their HD numbers and Col. 2 the Hipparcos numbers, Cols. 3–4 give their galactic coordinates and Col. 5 gives the distance of each selected star.
We also analyzed the space motions of these stars. Adopting the Hipparcos proper motions (Cols 9–10 of Table 5) and radial velocities of the literature (values in Col. 11 and references in Col. 12), we computed the U, V, W velocity components. These velocity components, corrected for the Solar motion (see Sect. 4) are presented in Cols. 13–14 of Table 5. The dispersion of the space velocity distribution of these stars (see values in Table 6) suggest that they probably belong to a single group. We propose that this group of B- and A-type stars form an association, not previously catalogued, in the Chamaeleon region. We can note (see the values given in Tables 2 and 5) that the space velocities of these stars are similar to those of the PMS stars, which reinforces the argument that the two populations are related (see discussions in Sect. 4).
The Cha open cluster investigated by Mamajek et al. (mamaj00 (2000)) is contained in a field of 40, which is small compared to the 15 size of the association that we are discussing here. The stars of the Cha cluster are situated at about 90 pc, closer than the average of the stars of our list, and the only B-type star of the cluster is Cha itself (spectral type B8). Probably this cluster is also part of the Sco-Cen OB association, since the space velocities are similar.
| Name | HIP | d | X | Y | Z | ref. | U | V | W | (-)o | Sp.T. | log | log | ||||||||
|---|---|---|---|---|---|---|---|---|---|---|---|---|---|---|---|---|---|---|---|---|---|
| HD | [pc] | [km s-1] | |||||||||||||||||||
| (1) | (2) | (3) | (4) | (5) | (6) | (7) | (8) | (9) | (10) | (11) | (12) | (13) | (14) | (15) | (16) | (17) | (18) | (19) | (20) | (21) | (22) |
| 75416 | 42637 | 292.4024 | 21.6511 | 97 | 34 | 83 | 36 | 38.9 | 10.4 | 14.0 | [2] | 2.2 | 12.0 | 2.4 | 5.46 | 0.08 | B9IV | 4.05 | 0.00 | 0.52 | 1.91 |
| 75591 | 42830 | 290.7389 | 20.5251 | 212 | 70 | 186 | 74 | 14.4 | 15.9 | 13.0 | [2] | 9.8 | 16.8 | 3.2 | 8.09 | 0.05 | B9.5V | 4.01 | 0.16 | 0.30 | 1.51 |
| 77981 | 44192 | 289.0698 | 18.1660 | 196 | 61 | 176 | 61 | 32.2 | 14.2 | 6.85 | 0.04 | B9V | 4.02 | 0.01 | 0.37 | 1.91 | |||||
| 82423 | 46148 | 293.8218 | 20.0690 | 192 | 73 | 165 | 66 | 30.9 | 3.4 | 7.85 | 0.07 | B9.5V | 4.01 | 0.20 | 0.30 | 1.53 | |||||
| 83979 | 46928 | 295.5743 | 21.0438 | 165 | 67 | 139 | 59 | 34.5 | 14.9 | 10.0 | [3] | 12.1 | 11.0 | 7.3 | 5.07 | 0.13 | B5V | 4.18 | 0.04 | 1.23 | 2.82 |
| 86320 | 48320 | 295.4593 | 19.9209 | 216 | 87 | 183 | 74 | 12.6 | 9.2 | 12.1 | [1] | 4.6 | 13.5 | 11.9 | 6.47 | 0.12 | B8IV | 4.09 | 0.42 | 0.70 | 2.44 |
| 93845 | 52633 | 297.7350 | 18.9624 | 111 | 49 | 93 | 36 | 35.5 | 12.9 | 22.6 | [2] | 2.4 | 20.4 | 6.6 | 4.45 | 0.19 | B2.5IV | 4.32 | 0.05 | 2.04 | 3.05 |
| 96675 | 54257 | 296.6163 | 14.5688 | 164 | 71 | 142 | 41 | 21.7 | 8.0 | 7.68 | 0.17 | B6V | 4.14 | 0.58 | 0.98 | 1.89 | |||||
| 97300 | 54557 | 297.0329 | 14.9195 | 188 | 83 | 162 | 48 | 19.6 | 9.5 | 8.97 | 0.45 | B9V | 4.02 | 0.96 | 0.37 | 1.40 | |||||
| 98672 | 55308 | 297.0324 | 13.3327 | 163 | 72 | 141 | 38 | 22.0 | 9.4 | 23.2 | [1] | 4.4 | 21.1 | 5.2 | 6.26 | 0.01 | A0V | 3.99 | 0.05 | 0.22 | 1.94 |
| 102065 | 57192 | 300.0261 | 17.9966 | 168 | 80 | 138 | 52 | 28.0 | 14.1 | 6.61 | 0.10 | B9IV | 4.05 | 0.33 | 0.52 | 2.06 | |||||
| 102293 | 57374 | 299.1258 | 14.4764 | 198 | 93 | 168 | 50 | 30.5 | 17.0 | 7.89 | 0.10 | B9.5IV | 4.04 | 0.31 | 0.45 | 1.65 | |||||
| 104174 | 58484 | 300.2089 | 15.6249 | 112 | 54 | 93 | 30 | 38.5 | 16.9 | 13.0 | [2] | 2.6 | 13.8 | 5.0 | 4.88 | 0.02 | B9Vn | 4.02 | 0.05 | 0.37 | 2.22 |
| 104237 | 58520 | 300.2265 | 15.5918 | 116 | 56 | 97 | 31 | 37.1 | 13.5 | ||||||||||||
| 106477 | 59758 | 300.2617 | 10.3773 | 201 | 100 | 171 | 36 | 20.0 | 7.9 | 8.44 | 0.32 | B9V | 4.02 | 0.71 | 0.37 | 1.57 | |||||
| 106911 | 60000 | 301.3369 | 16.5431 | 83 | 41 | 68 | 24 | 39.4 | 6.8 | 23.0 | [2] | 8.6 | 22.3 | 3.2 | 4.24 | 0.11 | B5Vn | 4.18 | 0.08 | 1.23 | 2.57 |
| 115088 | 64951 | 304.1755 | 17.1704 | 136 | 73 | 108 | 40 | 20.5 | 20.8 | 6.34 | 0.01 | A0V | 3.99 | 0.02 | 0.22 | 1.73 | |||||
| 116579 | 65628 | 305.3432 | 11.9882 | 152 | 86 | 121 | 32 | 37.1 | 8.3 | 3.0 | [2] | 14.2 | 6.8 | 1.9 | 6.62 | 0.03 | B9V | 4.02 | 0.03 | 0.37 | 1.79 |
| 123781 | 69576 | 307.8490 | 14.3855 | 218 | 130 | 167 | 54 | 15.9 | 1.5 | 7.83 | 0.02 | B9IV | 4.05 | 0.18 | 0.52 | 1.73 | |||||
| 124654 | 70001 | 308.5824 | 13.2816 | 192 | 117 | 146 | 44 | 31.9 | 4.1 | 7.72 | 0.07 | B9V | 4.02 | 0.23 | 0.37 | 1.63 | |||||
| 124771 | 70248 | 306.9338 | 17.9513 | 169 | 97 | 129 | 52 | 15.3 | 9.2 | 4.5 | [2] | 1.4 | 3.7 | 1.2 | 5.06 | 0.09 | B4V | 4.23 | 0.16 | 1.50 | 3.00 |
3 Spatial distribution
We present in Fig. 1 the distribution in galactic coordinates of both samples (PMS stars and young early-type stars). The galactic coordinates of all stars are listed in Cols. 2–3 of Table 1, Cols. 5–6 of Table 2, Cols. 3–4 of Tables 3, 4 and 5. In Table 1, Col. 4 also lists the references for the PMS stars coordinates. All coordinates for the other stars are from the Hipparcos Catalogue. It can be seen that the young stars, both PMS and young early-type, present a relatively continuous distribution. Some regions near molecular clouds, like Ophiuchi, Lupus or Chamaeleon, seem to have a larger fraction of low-mass stars, but nevertheless, some PMS stars can be found far from these regions that are usually considered as the main SFRs.
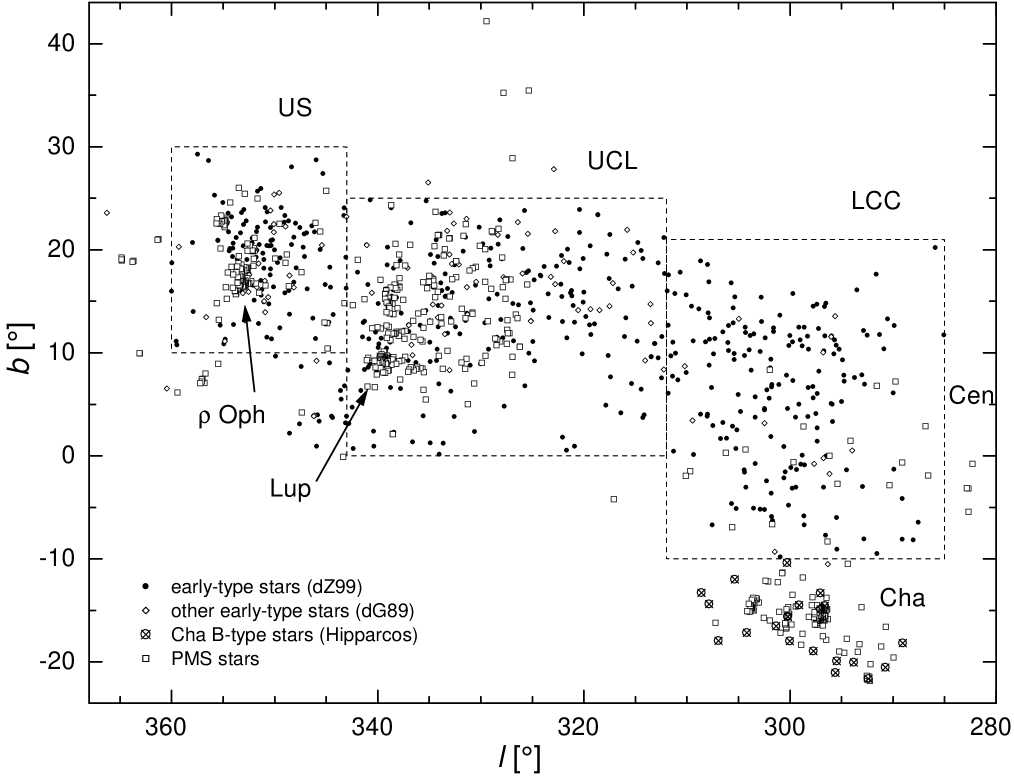
The range of distance of the objects of interest extends to about 250 pc, but most of the young stars and molecular clouds are situated at distances between 100 and 200 pc. If we compare the mean distances of the molecular clouds (see values in Sect. 5) with the mean distances of the subgroups of the Sco-Cen OB association (dZ99), we may think that the PMS stars do not occupy the same region of space of the young early-type stars. However, when we analyze the individual distances of these young stars we verify that that they are spread over a large range of distances. Sartori et al. (sart01 (2001)) noted that their distribution extends to distances as small as 60 pc, because there are at least 10 PMS stars and several young early-type stars that have distances less than 100 pc. The individual distance values and the errors derived from the parallax errors are listed in Cols. 9–11 of Table 2 and Cols. 5–7 of Tables 3 and 4. In Table 2 we also give the parallax values and respective errors (Cols. 7–8) in order to show that Hipparcos did not obtain reliable parallaxes to some PMS stars (9 stars in the studied SFRS) and therefore, their distances could not be estimated.
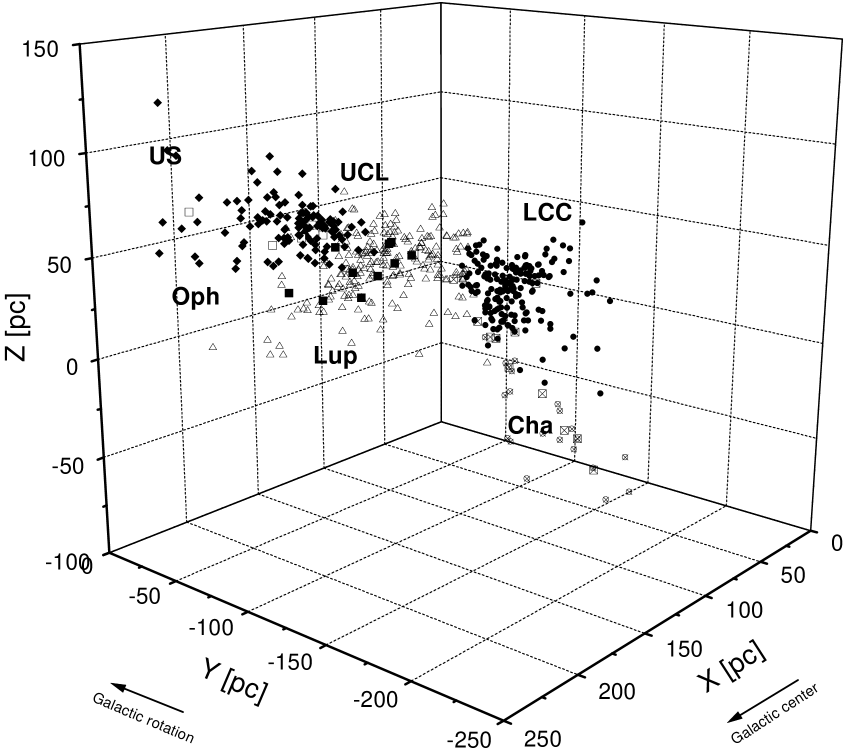
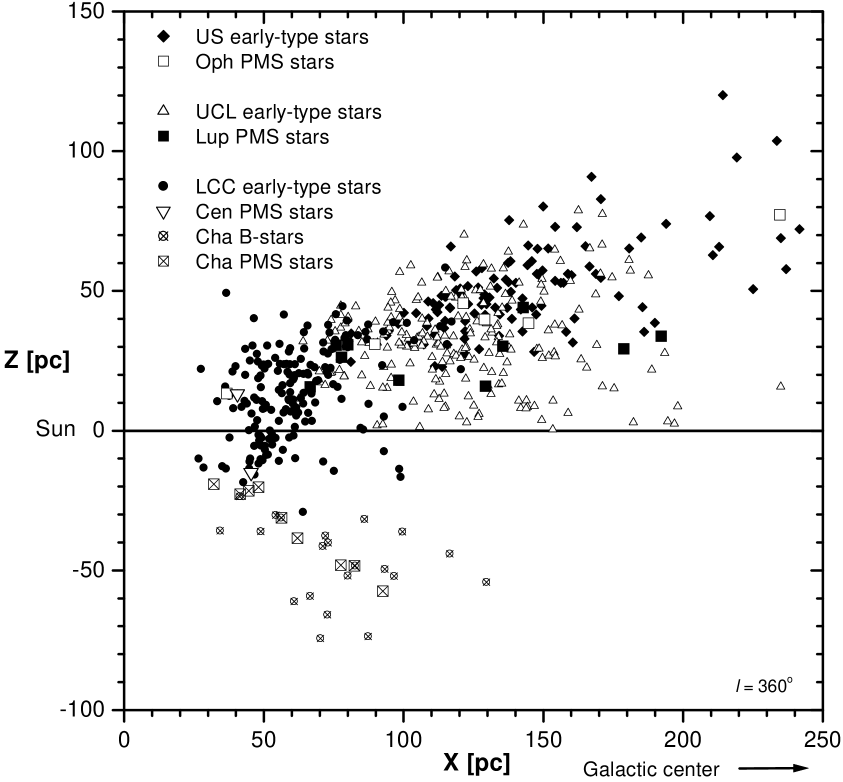
Then, we calculated the positions in the Galactic system (X, Y, Z) based on these distances derived from the Hipparcos parallaxes. The positions in the Galactic system are listed in Cols. 12–14 of Table 2, Cols. 8–10 of Tables 3 and 4, and Cols. 6–8 of Table 5. The distribution in 3 dimensions of these positions is shown in Fig. 2. In this diagram, as only the stars that have reliable Hipparcos parallax are represented, not more than 30 PMS stars are shown. However, it can be clearly seen that the young early-type stars and the PMS stars follow a similar spatial distribution. There is no separation between the PMS and the young early-type stars.
It is not usual in the literature to consider that the Chamaeleon SFR is related in some way to the Ophiuchus and Lupus SFRs. We consider that they are part of the same complex because there are in the region between Ophiuchus and Chamaeleon other young stars, like the PMS stars in Centaurus, and also molecular clouds, like the Musca clouds, the Coalsack, etc. (all at about the same distance).
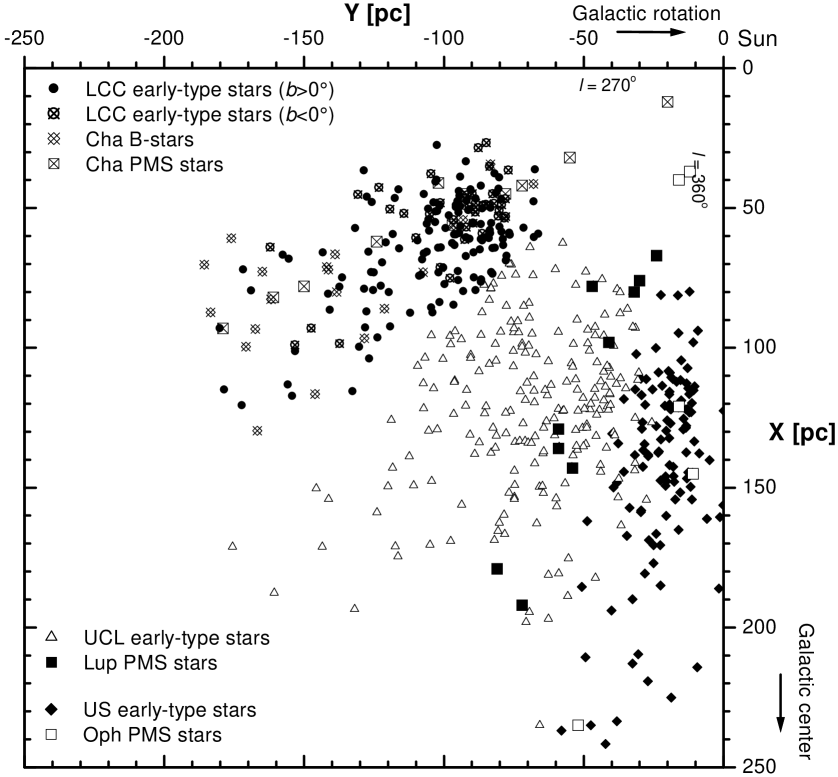
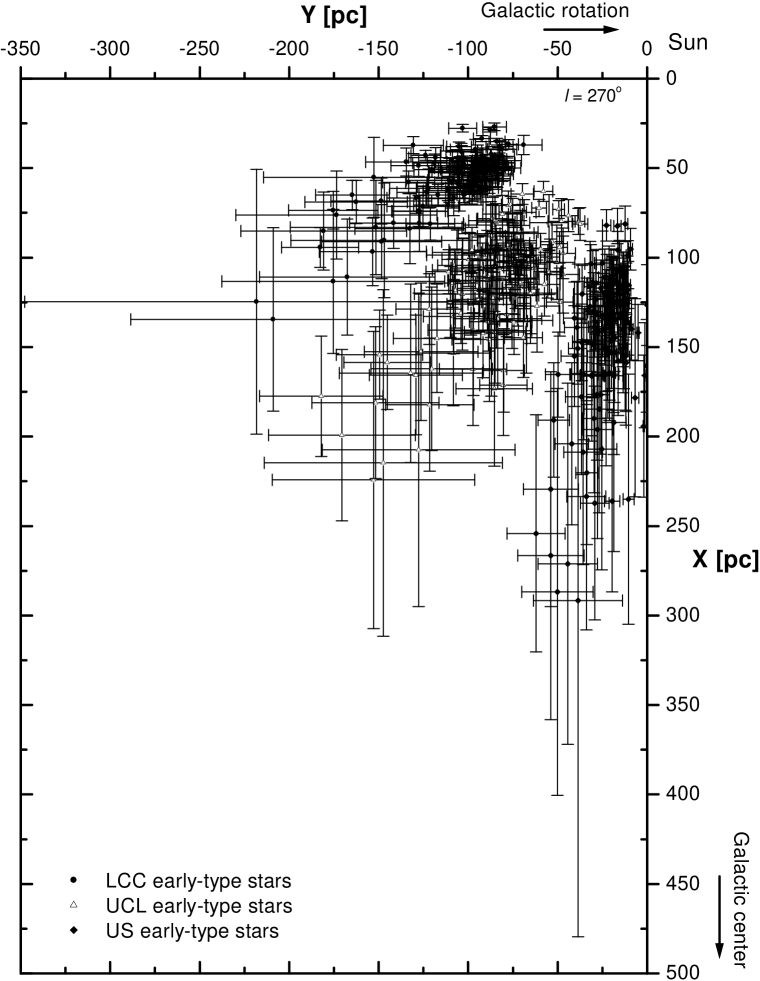
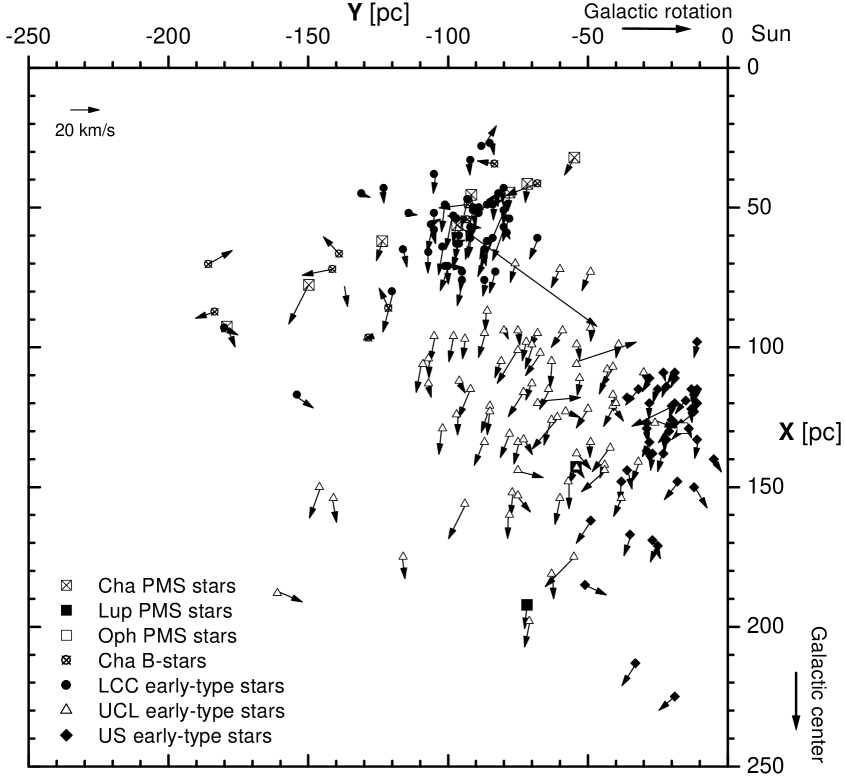
We show in Fig. 3 the projected positions of the young stars on the XY plane. Interestingly, in the XY distribution of stars we can distinguish three denser groups, separated by gaps of lower stellar density. These groups are the US, UCL and LCC associations. The elongated shapes of these groups in the direction opposite to the Sun is largely an effect of the errors of measurements on distances. In Fig. 4 we present the error bars in position in the X and Y directions, derived from the Hipparcos errors on parallaxes. Probably most of the stars that seem to be at distances larger than 200 pc are, in reality, closer than that, considering that the errors increase quickly with the distance to the Sun. The errors are expected to produce an excess density of star in the direction that connects the Sun to the main concentrations of stars, as observed. The separation between the three groups seems to be real, and not an effect of extinction due to molecular clouds, since the denser parts of the known clouds do not coincide with the gaps. The apparent geometry of the distribution of stars in the XZ plane (Fig. 5), in which the distance of the stars to the Galactic plane increases with their distance to the Sun, is probably due to the combined effect of the errors in distance (that tends to produce elongated structures) and of a larger extinction in the Galactic plane. The well-known fact that the Sun is about 20 pc above the Galactic plane can also be noticed in the diagram of Fig. 5.
4 Kinematics
4.1 Proper motions
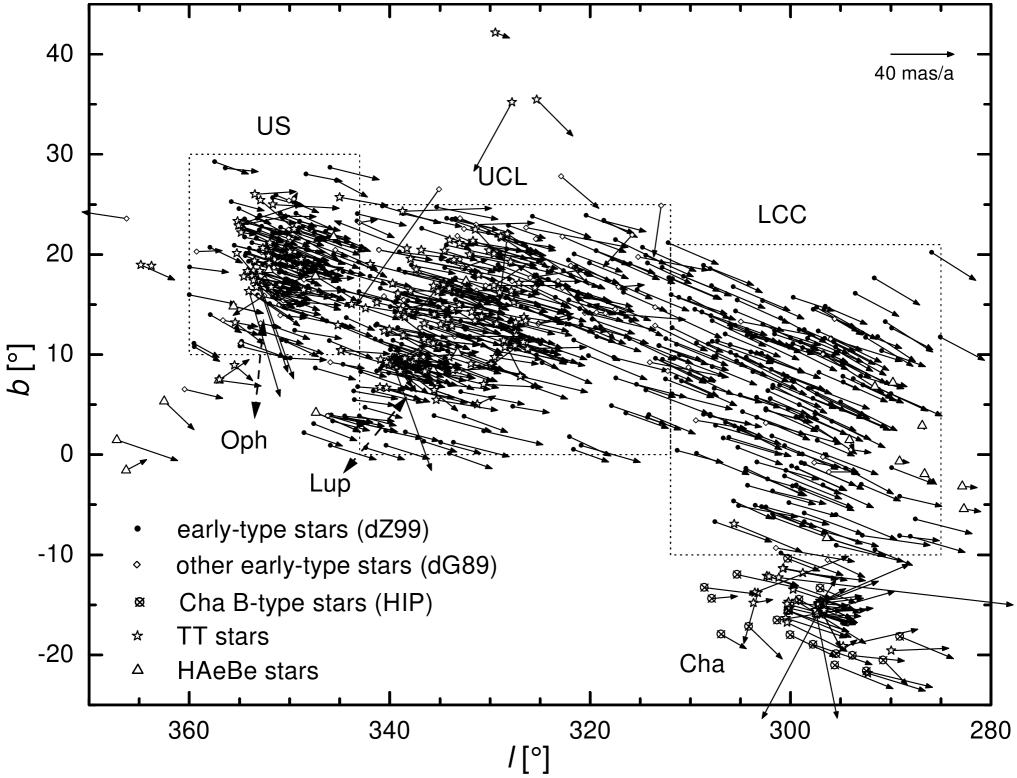
We collected in the literature all the available proper motions of the young stars in the studied region. The Hipparcos Catalogue (ESA esa (1997)) provides accurate measurements of proper motions for all the 521 young early-type stars of the Sco-Cen OB association (dZ99) and also for the 88 early-type stars from dG89 that we selected to analyze in this work. We adopted the Hipparcos proper motions for the 39 PMS that also are in the catalogue. For the other PMS stars, we mainly adopted the proper motions determined by Teixeira et al. (teixeira (2000); data for 160 stars). The work by Teixeira et al. and some others (Preibisch et al. preib98 (1998); Frink et al. frink (1998); Terranegra et al. terranegra (1999)) were done before the Tycho-2 Catalogue (Hog et al. hog (2000)) became available. However, as the determination of proper motions done by these works were specifically for PMS stars, there are proper motions for several stars exclusively determined by them. Our list of stars with known proper motions was completed with 9 stars from the Tycho-2 Catalogue and 6 from Terranegra et al. (terranegra (1999)). The proper motions in galactic coordinates are listed in Cols. 5–6 of Table 1 (references are in Col. 7), in Cols. 15–16 of Table 2, in Cols. 11–12 of Tables 3 and 4, and in Cols. 9–10 of Table 5. We present in Fig. 6 the vector proper motion diagrams (VPDs) in galactic coordinates of the early-type stars of the three OB associations, US, UCL and LCC, and of the Chamaeleon association (represented by circles), and of the PMS stars of Ophiuchus, Lupus and Chamaeleon SFRs.
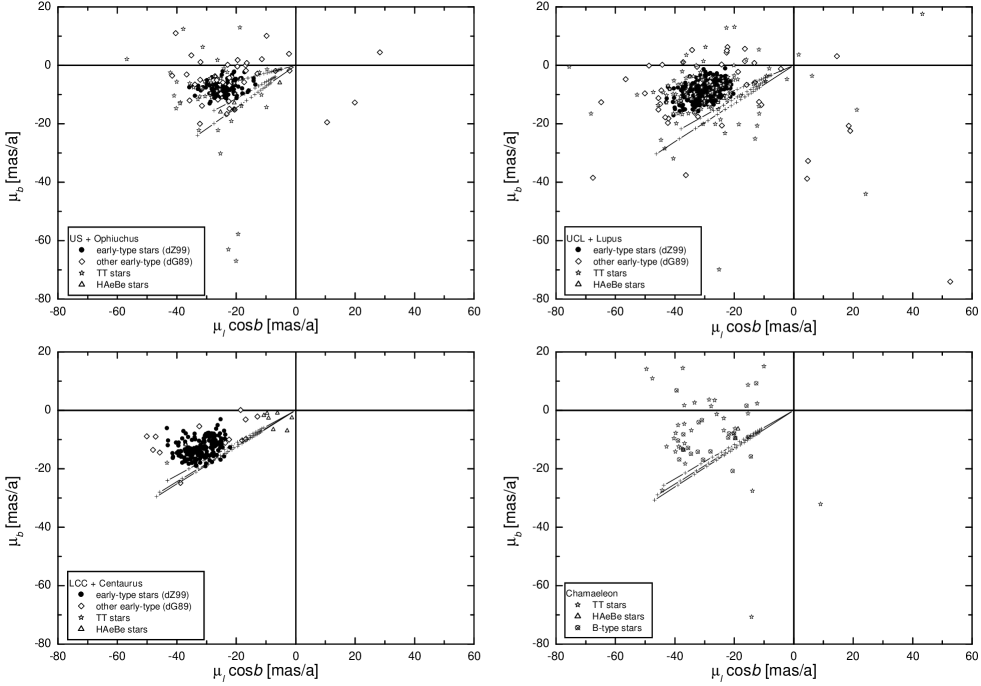
When comparing the proper motions of the young early-type and the PMS stars samples, it is important to discuss an interesting selection effect in the OB sample. The proper motions of the early-type stars selected by dZ99 are much more ordered (all similar) than those of the PMS stars. However, this is largely due to the fact that dZ99 only considered stars that were in a very narrow range of proper motion components, on both axes, as members of the Sco-Cen OB association. On the other hand, we have analyzed all the PMS stars with known proper motions, i.e., they were not selected by their kinematic properties. In Fig. 6, we show separately the proper motion of the dG89 stars that were selected for comparison. Obviously, these stars present a larger scatter of their proper motions than those selected by dZ99. However, they are at the same average distance and have the same ages (as later discussed in Sect. 5) of the stars considered as members by dZ99. If we consider the total sample of young early-type stars (the stars selected by dZ99 plus the re-inserted ones), then the scattering of proper motions of the young early-type stars are similar to that of the PMS stars. The VPD of the Chamaeleon region (Fig. 6.d) shows that the B-type and the PMS stars have also very similar proper motion distributions. The whole sample of young stars exhibit a common direction of motion, as can be seen in Fig. 7.
We note that some stars selected by dZ99 were previously classified as PMS stars in other studies: HD 145718 and HD 81624 in US (Gregorio-Hetem et al. gregorio (1992); Thé et al. the (1994)), HD 138009, HD 141277, and HD 143677 in UCL (Brandner et al. brandner (1996); Krautter et al. krautter (1997)), and HD 100546 in LCC (Torres torr99 (1999)). This means that the kinematics of at least a few PMS stars is exactly the same of the Sco-Cen OB associations members selected by dZ99. Considering that only a small number of PMS stars belongs to the source of data used by dZ99, the Hipparcos Catalogue, we believe that it is not a coincidence, i.e., those PMS stars are not interlopers. On the contrary, it reinforces the idea that the PMS and the early-type stars show a very similar kinematics.
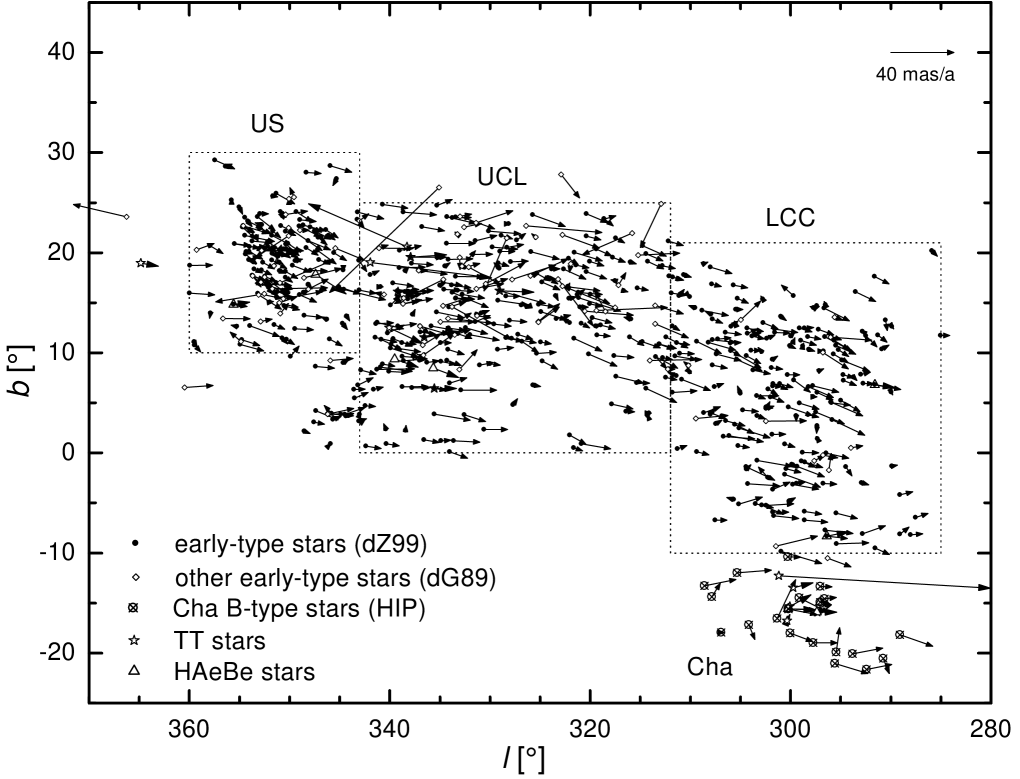
A valid question is whether the common proper motion can be simply the reflex motion due to Solar velocity with respect to the local standards of rest, as the stars are in a relatively narrow range of distances. Since the effect of Solar motion on the star proper motion depends on its distance, and we know the distance of few PMS stars, we show in the diagrams of Fig. 6 the values of the reflex Solar motion as a function of distance, from 50 to 200 pc. We assumed the basic Solar motion, with components: U⊙ = 10.0 km s-1 (radially towards the Galactic center), V⊙ = 5.25 km s-1 and W⊙ = 7.17 km s-1 (Dehnen & Binney dehnen (1998)). The reflex of Solar motion depends also on the direction of the stars, and since the regions studied here have sizes of several degrees, we present it for two extreme directions and for the mean direction of each field. It can be seen that the reflex Solar motion for distances less than 150 pc represents a significant fraction of the observed proper motions of these stars. The corrected proper motion vectors of the young stars with known distances are shown in Fig. 8. Note that, although the values of the corrected proper motions are much smaller than the observed ones, a common direction of motion persists.
4.2 Radial velocities
We performed a systematic search in the literature for radial velocities of the Hipparcos stars. The values and their references are listed in Cols. 17–18 of Table 2, Cols. 13–14 of Tables 3 and 4, and Cols. 11–12 of Table 5. In Fig. 9 we show the histograms of the of the early-type stars of each studied OB associations in comparison with the of the PMS stars of the related SFRs. It can be remarked that the average vary with longitude, as expected from the projection of the Solar motion, as discussed in more detail in next sub-section. Although the sample of PMS stars with measured is small, no difference can be noticed between the velocities of PMS and young early-type stars.

4.3 Space velocities
We combined the proper motions and radial velocities of the stars with the distances derived from Hipparcos parallaxes, to calculate the U, V, W components of the space velocities in the Galactic frame. We corrected the space velocities for the velocity of the Sun with respect to the local standard of rest (LSR). Note that the effect of the LSR correction is to produce a shift in the space velocities; it does not affect the aspect of the velocity distributions. The U, V and W components with respect to the LSR are listed in Cols. 19–21 of Table 2 for the Hipparcos PMS stars and in Cols. 15–17 of Tables 3 and 4, and in Cols. 13–15 of Table 5, for the early-type stars.
In Table 6 we present the mean values and the standard deviations (), resulting from a Gaussian model, for each OB association. It can be seen that the velocity differences between the 4 associations are not significant, being smaller than 1 of the individual distributions (of about 5 km s-1). For each SFR the space velocities of the Hipparcos PMS stars are compatible with the mean values of the OB associations.
| Association | U | V | W | ULSR | VLSR | WLSR | ||||||
|---|---|---|---|---|---|---|---|---|---|---|---|---|
| mean | mean | mean | mean | mean | mean | |||||||
| US | -6.7 | 5.9 | -16.0 | 3.5 | -8.0 | 2.7 | 2.4 | 5.0 | -10.0 | 3.3 | -0.9 | 2.8 |
| UCL | -6.8 | 4.6 | -19.3 | 4.7 | -5.7 | 2.5 | 3.2 | 4.2 | -14.4 | 4.6 | 1.4 | 2.4 |
| LCC | -8.2 | 5.1 | -18.6 | 7.3 | -6.4 | 2.6 | 1.1 | 5.8 | -13.6 | 5.6 | 1.1 | 2.4 |
| Chaa | -11.9 | 7.7 | -16.0 | 11.4 | -8.6 | 5.8 | -1.9 | 7.7 | -10.8 | 11.4 | -1.4 | 5.8 |
a For the Cha OB association the mean velocities and the presented are simple statistics, not derived from Gaussian fits.
The average V component in the LSR is about -12 km s-1, which is significant and contrary to the velocity expected from Galactic differential rotation. If the rotation curve is relatively flat, stars situated at a Galactic radius smaller than the Solar radius R⊙ must complete a rotation in a shorter time than the period associated with the LSR, and should appear to us with a positive velocity in the direction of rotation.
Figure 10 shows the resultant velocities in the LSR of individual stars in the XY plane. As expected from the combination of the V component already discussed and of the small U component on the average, the young stars are moving away from the Sun.
5 H-R diagrams and age determination
We estimated the values of effective temperature for the early-type and PMS stars from the spectral types and luminosity classes given in the literature, using the relationship between spectral type and effective temperature given by de Jager & Nieuwenhuijzen (dejager (1987)), who present a complete grid of spectral types and luminosity classes. In the cases where no luminosity class was given, we adopted the luminosity class V. The spectral types and luminosity classes and their references are listed in Cols. 11–12 of Table 1, 25–26 of Table 2 and 20 of Tables 3 and 4 (for the early-type stars, the spectral types were adopted exclusively from the Hipparcos Catalogue). The log values are listed in Cols. 13 of Table 1, 27 of Table 2, and 21 of Tables 3 and 4.
We calculated the visual extinction towards the individual stars using their observed (-) color index and the intrinsic color index from Bessel et al. (bessel (1998); their Tables 1, 2 and 3) and the relations of and E(-) of Schultz & Wiemer (schultz (1975)). Bessel et al. (bessel (1998)) give intrinsic colors as a function of and log . In order to get the intrinsic colors for each star, we adopted the log derived from its spectral type and luminosity class as given by Table VII of Straižys & Kuriliene (straizys (1981)) (the adopted log values are listed in Cols. 14 of Table 1, 28 of Table 2, and 22 of Tables 3 and 4). The observed and intrinsic (-) color index and the values are listed in Cols. 9, 15 and 16 of Table 1, 23 and 29 of Table 2 (we do not give the intrinsic colors for the Hipparcos PMS stars), and 19, 23 and 24 of Tables 3 and 4. The (-) references for the PMS stars are listed in Col. 10 of Table 1 and for the Hipparcos PMS stars, in Col. 24 of Table 2. For the early-type stars, the observed (-) were also extracted exclusively from the Hipparcos Catalogue.
Then, bolometric luminosities were calculated through the magnitude corrected for interstellar extinction, the visual bolometric correction BCV, also given by Bessel et al. (bessel (1998)), and the distances of each star, when available, or, otherwise, the mean distance of the SFR. We adopted the measured parallaxes to derive the distances of the PMS and early-type stars that are in the Hipparcos Catalogue. The SFR adopted mean distances, also derived from Hipparcos, were 168 pc for Cha I, 147 pc for Lupus, 128 pc for Ophiuchi (Bertout et al. bertout (1999)), 178 pc for Cha II (Whittet et al. whittet (1997)) and 140 pc for US (dZ99). The magnitudes, the BCV and the log(/) values are listed in Cols. 8, 19 and 20 of Table 1 for 240 PMS stars, in Cols. 22 and 30 of Table 2 for 28 Hipparcos PMS stars (we do not give the BCV values for the Hipparcos PMS stars), and in Cols. 18, 25 and 26 of Tables 3 (485 early-type stars) and 4 (87 other early-type stars). The references for the magnitudes are the same for the (-) color indexes.
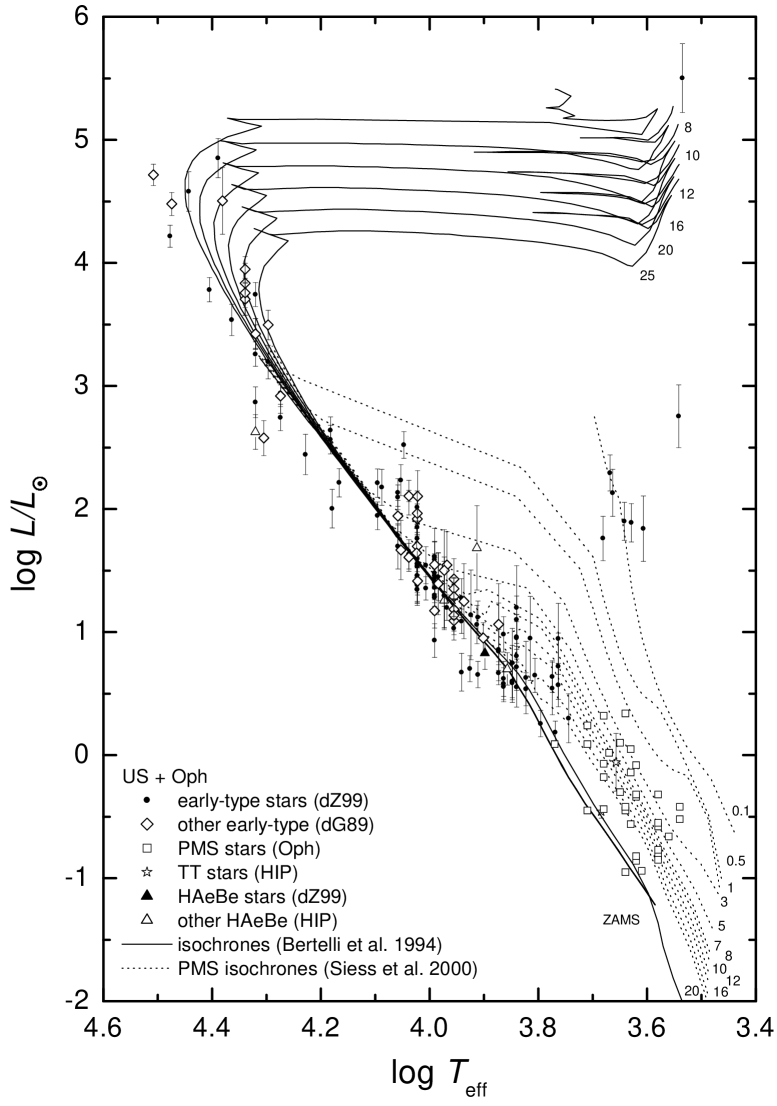
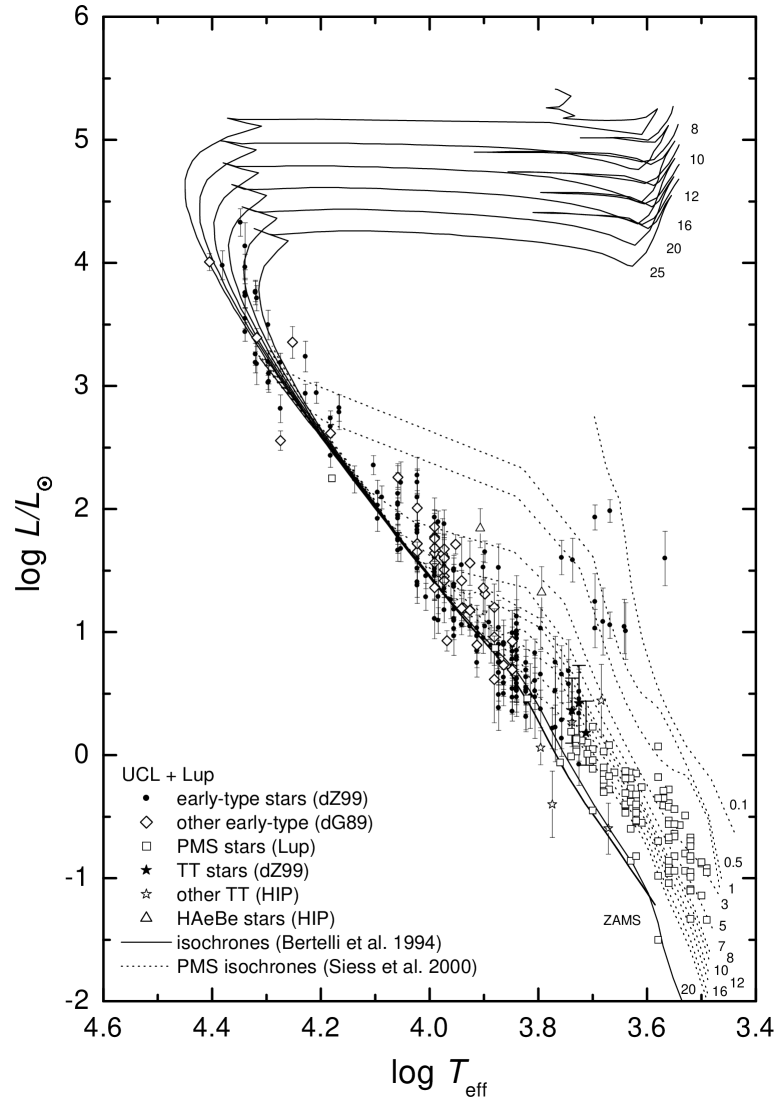
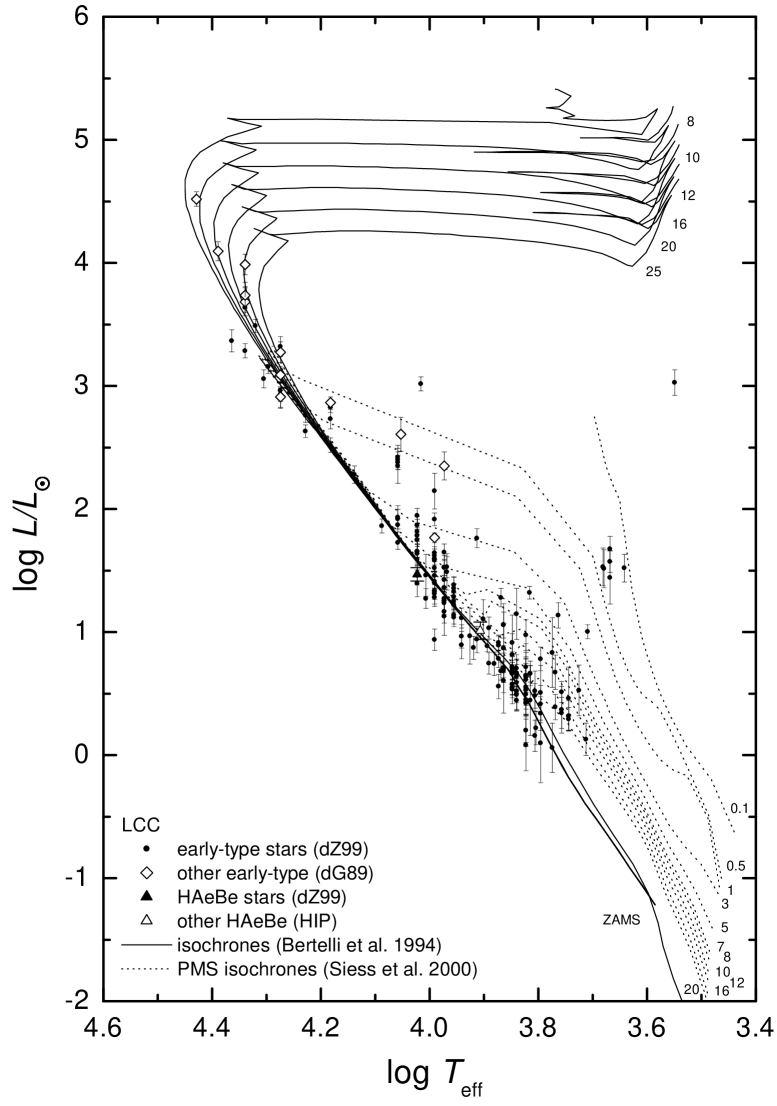
The H-R diagrams are presented in Figs. 11 to 14, separately for each of the main SFRs. The error bars in luminosity correspond to the errors in the Hipparcos parallaxes. The theoretical isochrones of Siess et al. (siess (2000)) for the PMS phase, and of Bertelli et al. (bertelli (1994)) for the evolution after the main sequence, are shown in these figures. We adopt the isochrones of Siess et al. (siess (2000)) because they are computed for stars in the mass range 0.1 to 7.0 , which is essential to represent not only the PMS phase of the TT stars but also of the HAeBe stars. Sartori (sart00 (2000)) compared this set of evolutionary tracks with others usually adopted in the literature (Palla & Stahler palla (1993); D’Antona & Mazzitelli dantona (1994); Baraffe et al. baraffe (1998)), and concluded that the grids of PMS tracks of Siess et al. (siess (2000)) are adequate for the purposes of this work. The ages of the PMS isochrones shown in Figs. 11 to 14 are between 0.1 and 20 Myr (the numbers at the bottom of the curves correspond to the ages, in units of Myr). The zero age main sequence (ZAMS) curve computed by Siess et al. (siess (2000)) is also shown. The isochrones of Bertelli et al. (bertelli (1994)) are derived from stellar models computed from the ZAMS to the central carbon ignition for massive stars or to the beginning of the thermally pulsing regime of the asymptotic giant branch phase for low and intermediate mass stars. In these figures, the ages of the isochrones of Bertelli et al. (bertelli (1994)) range from 8 to 25 Myr (the numbers at the end of the curves correspond to the ages, in units of Myr).
Both sets of theoretical isochrones adopted are computed for the Solar composition. Although there are very few measurements of the PMS stars abundances (e.g. Padgett padgett (1996)) that could confirm this assumption, the Solar composition is usually adopted for all close SFRs. Sartori (sart00 (2000)) investigated the abundance measurements for the Sco-Cen OB association members, and concluded that there is not enough data to assert that the metallicity of these young stars is different from the Solar metallicity.
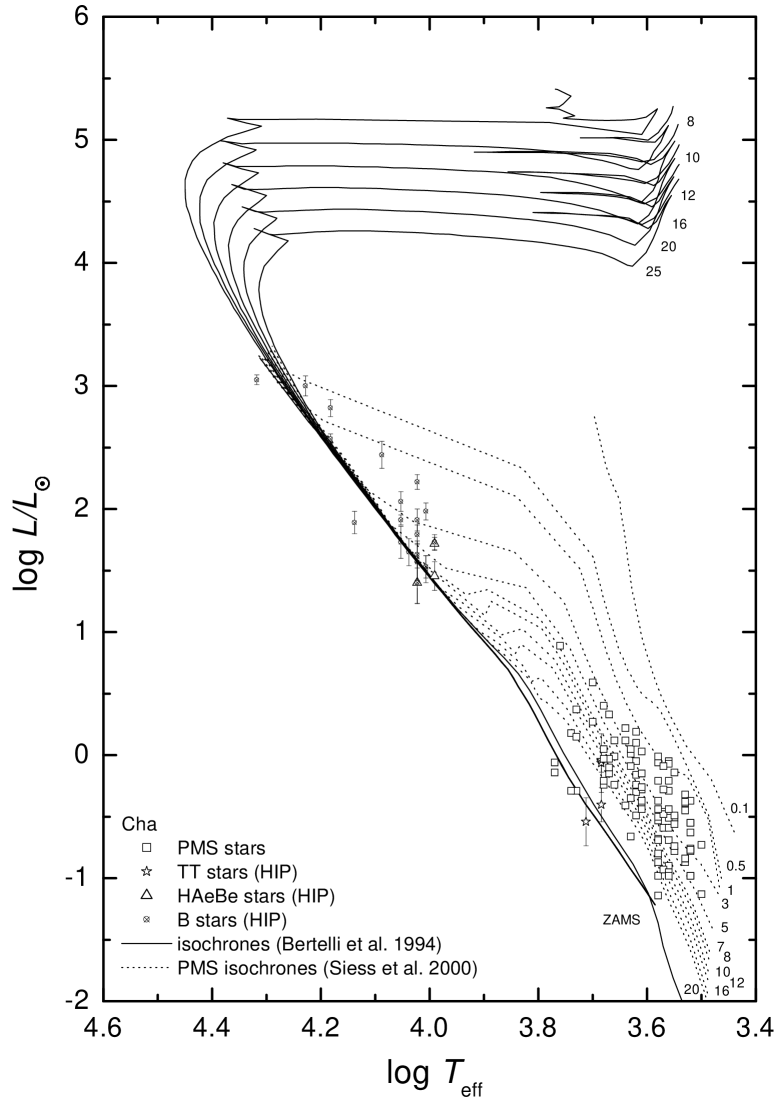
The main conclusions that we draw from the H-R diagrams are the following:
-
1.
In each SFR the PMS stars span a wide range of ages, from 1 to 20 Myr. Although Preibisch & Zinnecker (preib99 (1999)) and Preibisch et al. (preib02 (2002)), analyzing the PMS stars in the US region, concluded that they have an age of 5 Myr, without a significant spread, we can observe in their H-R diagram many objects above the 1 Myr isochrone, and many objects close to the 10 Myr isochrone. It seems that their conclusions are different from ours because they are based on a different interpretation of the H-R diagrams.
-
2.
For the OB associations, the ages that we obtain from a comparison of the positions of the early-type stars on the diagrams with the isochrones are 8–10 Myr for US, 16–20 Myr for UCL and for LCC. For the Chamaeleon B association, due to the absence of sufficiently massive stars, it is not possible to determine its age. These ages are different from those determined by dG89 (5–6 Myr for US, 14–15 Myr for UCL, 11–12 Myr for LCC). The discrepancies are explained by the fact that we use Hipparcos distances, more recent isochrones, and our effective temperatures are derived from the spectral type (in the work of dG89 the luminosity determination is based exclusively on photometric measurements). It is important to emphasize that in our method as well as in that of dG89, the age determination depends on a few stars situated in the upper part of the H-R diagram, so that the uncertainties are large. Our results do not confirm that UCL is older than the LCC association, as found by dG89.
-
3.
The stars considered as members of the associations by dG89, but excluded by dZ99, as discussed in Sect. 2.2, are indeed members, if we consider their position on the H-R diagrams (they are all in the main sequence – see Figs. 11 to 13).
-
4.
On the other hand, the G- to M-type stars selected as members are actually interlopers, since they are old stars already in the red giant branch. One exception is Sco, situated in the upper part of the H-R diagram of US, which is a member. Although in principle stars of spectral types G to M and classified as luminosity class III could be PMS stars, these stars of the dZ99 samples are not PMS because they are too bright to be unknown TT stars.
Although we estimated ages in the range 1–20 Myr for the PMS stars of US, and ages in the range of 8–10 Myr for the US OB association, we cannot say that there is indeed a difference in the age of the two populations. Note that Preibisch et al. (preib02 (2002)) estimated an age of 5 Myr for the early-type stars of US, similar to the age of the PMS stars. In our analyses, we could not see any clear evidence that in the process of star formation, massive stars form first.
Finally, in all the diagrams we observe a number of stars situated on the left of or below the ZAMS. Several types of errors could contribute to this; for instance the distance or spectral type could be incorrect, some stars could be binaries, others could be interlopers with low metallicity.
6 Discussion
The spatial distribution analysis of the studied young stellar associations has shown that they form an almost continuous structure. Sartori et al. (sart01 (2001)) noted that possibly other close groups of young stars could also be part of this large structure.
There is a clear kinship between the PMS and the young early-type stars in each subgroup of the Sco-Cen OB association and in the Chamaeleon region. It is remarkable that the two populations of young stars in this extended region do not show differences in terms of spatial distribution, space velocity distribution and age distribution. At least, in the US and UCL associations, for which we have more data, the young early-type stars and the PMS stars occupy approximately the same volume of space, have the same average space velocities and the same age, so that we must conclude that the two types of stars were born in the same event. The fact that the two types of stars are a single population has not always been recognized, probably for two reasons: 1) the TT stars are difficult to detect in distant associations, and the term “OB association” seems to exclude the presence of stars of later spectral types; 2) since low-mass stars take a longer time to reach the main-sequence than high-mass stars, they give the impression that they are a younger population.
It is interesting to note that a direct comparison of data in the literature could lead us to the incorrect conclusion that the dispersion of proper motions in the studied cluster is larger for the PMS stars than for the young early-type stars. This is the result of a selection effect, since the kinematic criterion used by dZ99 to decide if an early-type star belongs to an OB association is very restrictive.
The Sco-Cen OB associations have slightly distinct properties, in term of ages and kinematics, that justify the division in three associations. Despite their differences in age and kinematics, these stellar associations bear sufficiently similar characteristics to suggest that they belong to a same large ensemble. Even after removal of the effect of the Solar motion, the OB subgroups show very ordered velocities in the plane of the sky. The differences between the space velocities are well inside the internal dispersion values of each association (see Table 6).
We next discuss the gallery of models that have been put forward to explain at least some of the observed properties of the studied SFRs and the Sco-Cen OB association.
6.1 The sequential star-formation model
The sequential star-formation model was mainly formulated by Blaauw (blaauw64 (1964), blaauw91 (1991)), who considered that the US, UCL, and LCC associations were the prototype of such a mechanism. In this model, the star formation begins at one extremity of a giant molecular cloud, and propagates like a fire in a forest. The wind produced by the first group of stars compresses the gas of the cloud and induces the formation of a new group of stars, next to it. The star-formation history of the Sco-Cen OB association proposed by Preibisch & Zinnecker (preib99 (1999)) is a variation of the sequential star-formation idea.
Blaauw (blaauw64 (1964), blaauw91 (1991)) did not make any prediction concerning proper motions, however we might expect to see the stars diverging with respect to the successive centers of star formation. The very ordered proper motion observed in the studied region does not seem to confirm this model. In addition, the absence of an age gradient, as has been shown in Sect. 5, excludes the existence of bursts of star formation at successive positions. The large spread of ages at any given position along the extended structure conflicts with the idea that the star-formation process propagated along it. Note that if we are convinced that sequential star formation was not the dominant star-formation mechanism in the region that was considered as the best example of it, we can doubt its effectiveness in general.
6.2 The Gould Belt model
The expanding Gould Belt model was proposed by Lindblad et al. (lindblad (1973)), Frogel & Stothers (frogel (1977)), and Olano (olano (1982)), among others; a recent review was presented by Pöppel (poppel (2001)). The model supposes that a violent event took place about 30–60 Myr ago near the Cas-Tau group of young stars, giving rise to an expanding ring of gas. Olano (olano (1982)) predicts the orientation of the ring, the distance to the Sun and velocity of the gas associated with it as a function of time. The Sco-Cen OB association would be a segment of that ring. For the best model, the distance (166 pc) of the portion of the ring situated in the third Galactic quadrant is in agreement with that of the Sco-Cen OB association. The model does not attempt to fit the space velocities of the young stars, but only the radial velocity of the HI gas. Anyway, from the model, we would expect gas and stellar motions with a component towards increasing longitudes, and not the contrary, as we observe. The range of ages of the stars that we observe is a large fraction of the time elapsed since the starting event, according to Olano’s model. As the star-forming ring expanded, we would expect to see young stars filling a large fraction of the volume inside the ring. There are, indeed, young stars associated with the Taurus molecular cloud, but there is clearly a gap without young stars between the “center” and the “ring”. In fact, the distribution of young stars does not confirm the existence of a ring. As later discussed, we consider that a segment a spiral arm is a better explanation than a segment of ring.
6.3 Star formation by impact of high-velocity clouds
Lépine & Duvert (lepine94 (1994)) proposed star formation by impact of high velocity clouds (HVC) on the Galactic disk as a mechanism to explain the morphology of molecular clouds and age gradients of young stars; in particular, they presented a detailed model of the Oph cloud and Sco-Cen OB association. According to that model, the stars of the Sco-Cen OB association should have proper motions directed towards decreasing longitudes, reflecting the initial direction of the HVC, that can be inferred from the morphology of Oph and from the filaments of gas connecting the cloud to the Galactic plane. The model predicts a gradient of age in the same direction of space velocities. Although the model is able to explain the well-ordered proper motions, because the stars are expected to have similar initial velocities, a more detailed analysis, after correction of space velocities for the motion of the Sun, shows some difficulties. In particular, the model predicts a gradient of velocities (the first stars formed would have larger velocities and would be situated at a larger distance from the initial point of impact) and a gradient of age, that are not observed.
6.4 Transient Cloud Cores
Feigelson (feigel96 (1996)) analyzed the possibility of star formation in small transient cloud cores, that could be condensations in a turbulent giant molecular cloud. The author recognizes that there is an enormous flexibility in the range of parameters of the model. In general, the stars would be seen to diverge from local centers, and the younger TT stars would appear to be concentrated in clumps 1–2 in size. This model would not explain the ordered motion of the OB subgroups in Sco-Cen association. This model does not tell us what is the mechanism of molecular cloud formation or what drives the turbulence (in the two models previously discussed, the existence of molecular clouds is due to the compression of the interstellar medium by well-described shocks); the model could be complementary to a more global one, as described in the next section.
6.5 Purely random process
We analyzed in some detail the possibility of purely random star formation. Let us imagine that star-formation bursts occur at random places and random times in the Galactic disk; they could be triggered for instance by the infall of high velocity clouds or any other process. We performed simple numerical experiments in order to estimate the probability of obtaining by chance three stellar clusters close together in a short interval of time, so that they woeld seem to be the result of a non-random mechanism. The experiments consisted of drawing circles at random positions inside an area, with the correct scale to represent clusters in the Galactic plane. The typical diameter of recently formed clusters is of the order of 50 pc, as suggested for instance by Fig. 4. In a region of 1 kpc x 1 kpc around the Sun, in the Galactic disk, about 10 clusters are formed in 10 Myr. This time interval is such that if some of these clusters happen to be close together, they would not appear to present any strong age gradient. The amount of clusters that we consider to be born in this time interval is about what we observe around the Sun, and is not inconsistent with the star formation rate usually estimated for the Galactic disk (about 1 to 10 stars/year, e.g., Güsten & Mezger gusten (1982)). The probability of obtaining three clusters close enough so that they form an elongated structure of length about 150 pc, even without any restriction concerning the direction of the alignment, is smaller than 10%. This points towards the need for a non-random triggering mechanism like a spiral arm, as described in the next section, to produce an alignment of stellar clusters. Of course, if in addition, we considered the probability of obtaining aligned space velocities, the probability of obtaining such a structure would be much less.
6.6 The spiral arm interpretation
Finally, we must consider the possibility that what we are observing is a spiral arm that passes close to the Sun. Spiral arms are known to contain molecular clouds and OB stars, like the complex extending from Ophiuchus to Chamaeleon. The narrow alignment of molecular clouds in the Galactic plane revealed by CO (Dame et al. dame (1987)) has precisely the inclination with respect to the Solar circle (about 15) that we would expect from the global spiral structure (e.g., Lépine & Leroy lepine00 (2000)). Furthermore, the IRAS brightness profile of the Galaxy at 60 m and at 100 m as a function of longitude in the Galactic plane shows maxima in the directions and (Amores & Lépine amores (2003)); these can be interpreted as tangential directions to an arm that passes close to the Sun. These peaks are similar to the other peaks associated with well-known tangential directions of spiral arms, like the features at , , etc. Note that a spiral arm at a Galactic radius larger than the Solar radius R⊙ does not produce tangential directions; the directions of the observed peaks correspond to a spiral arm passing at a radius slightly less than R⊙. Finally, the global distribution of HII regions in the Galactic plane also indicates the presence of this very close spiral arm inside the Solar radius, that produces concentrations of HII regions in the directions and ; this is discussed in detail by Lépine et al. (lepine01 (2001)).
The question, then, is: what are the expected space velocities of young stars and molecular clouds recently formed in a spiral arm? Let us first comment briefly on motions in the direction perpendicular to the Galactic plane. A spiral arm is the site of gas shocks, and it would not be surprising if in such shocks, due to the increase in gas pressure, some gas were ejected to distances from the plane that are larger than the normal scale-height of the gas. This could explain the relatively high galactic latitudes of Oph and Chamaeleon clouds. Smoothed particle magnetohydrodynamic simulations of gas cloud collisions show this effect of expansion of the gas in directions perpendicular to that of the collision (Marinho & Lépine marinho (2000)).
Let us now consider the motion in the plane. The post-shock velocity of the gas, that is responsible for the initial velocity of the young stars, depends on the position of the arm relative to the corotation radius. We assume that the corotation radius lies beyond R⊙, or very close to R⊙ (Amaral & Lépine amaral (1997); Mishurov & Zenina mishurov (1999)). For radii smaller than the corotation radius, the stars and the gas rotate at velocities larger than that of the spiral pattern, so that the HI gas clouds orbiting in the Galactic plane reach the spiral arms on their concave side, and suffer a shock that strongly brakes and compresses the gas, leading to the formation of short-lived molecular clouds (seen as dust lanes in galaxies) and triggering star formation. The initial velocity of the formed stars is the same as their parent molecular clouds; since the clouds have just been braked, the young stars have a rotation velocity smaller than the normal circular velocity at that radius. As a consequence, the gravity force from the central parts of the Galaxy is no longer balanced by the centrifugal force; the young stars start an infall motion towards the Galactic center. The combination of this initial infall with the rotation velocity smaller than the normal rotation velocity is responsible for an initial trajectory that lies precisely along the spiral arm. This was already noticed by Bash (bash (1981)) who calculated the ballistic orbits of HII regions and measured their infall. Outside the corotation radius, the contrary is expected: the gas is expected to be accelerated in the direction of circular motion by the shock.
So, inside the corotation radius, the youngest stars produced in spiral arms should present velocities in the direction of the Galactic rotation, along the arms, but with a velocity modulus smaller than that of normal rotation. Since we are measuring the space velocities with respect to the LSR, a frame that rotates with the normal rotation velocity, we should see the young stars going in the direction contrary to Galactic rotation, that is, in the direction of decreasing longitudes, for objects in the third Galactic quadrant. This is precisely what we observe.
The spiral arm interpretation explains naturally why the velocity distribution is uniform over an extended region, as well as the absence of a gradient of age. It is not surprising to find stars covering a large range of ages, since the arms are long lived structures, and due to their trajectories, recently formed stars are maintained in the arms for a relatively long time.
7 Conclusions
-
•
In the Chamaeleon region, there is an OB association, not previously catalogued, formed by at least 21 B- and A-type stars.
-
•
The extended group of young stellar associations, which includes US, UCL, LCC and Chamaeleon, form an almost continuous structure with a total length of at least 150 pc, with more uniform properties than previously believed. The young early-type stars of the OB associations and the PMS stars of the SFRs follow a similar spatial distribution, i.e., there is no separation between the low and the high-mass young stars. There are no differences in the kinematics or in the ages of the PMS stars and of the young early-type stars.
-
•
The average space velocities of the studied young stars are uniform, directed contrary to Galactic rotation, towards decreasing galactic longitude.
-
•
There is no measurable age gradient, all the sub-regions containing stars in the range of 1–20 Myr. Our results do not confirm that the UCL association is older than the LCC association. The absence of an age gradient excludes a star-formation process that propagates along the structure, like the traditional sequential star-formation process.
-
•
We argue that the hypothesis that the Sco-Cen OB association is part of a spiral arm that passes close to the Sun explains most of the features of the space velocities and age distribution of the young stars.
Acknowledgements.
The authors wish to thank Dr. R. de la Reza and Dr. C. A. O. Torres for helpful comments, and Dr. F. Adams for suggesting include a brief discussion about random star formation. Special thanks are also extended to Dr. B. V. Castilho and Dr. J. I. B. Camargo. MJS acknowledges the CAPES PhD fellowship, and FAPESP (No. 00/06954-6) and CNPq (No. 300758/01-4) postdoc fellowships. WSD acknowledges the FAPESP PhD fellowship No. 99/11781-4. This work has been partially supported by PRONEX/Finep. This research has made use of the SIMBAD database, operated at CDS, Strasbourg, France.References
- (1) Amaral, L. H., & Lépine, J. R. D. 1997, MNRAS, 286, 885
- (2) Amores, E. B., & Lépine, J. R. D. 2003, submitted to A&A
- (3) Andersen, J., & Nordström, B. 1983, A&AS, 52, 471
- (4) Baraffe, I., Chabrier, G., Allard, F., & Hauschildt, P. H. 1998, A&A, 337, 403
- (5) Bash, F. N. 1981, ApJ, 250, 551
- (6) Bertelli, G., Bressan, A., Chiosi, C., Fagotto, F., & Nasi, E. 1994, A&AS 106, 275
- (7) Bertout, C., Robichon, N., & Arenou, F. 1999, A&A 532, 574
- (8) Bessel, M. S., Castelli, F., & Plez, B. 1998, A&A, 333, 231
- (9) Blaauw, A. 1964, ARA&A, 2, 213
- (10) Blaauw, A. 1991, in The Physics of Star Formation and Early Stellar Evolution, ed. C. J. Lada, & N. D. Kylafis (Kluwer, Dordrecht), 125
- (11) Brandner, W., Alcalá, J. M., Kunkel, M., Moneti, A., & Zinnecker, H. 1996, A&A, 307, 121
- (12) Corradi, W. J. B., Franco, G. A. P., & Knude, J. 1997, A&A, 326, 1215
- (13) Dame, T. M., Ungerechts, H., Cohen, R. S., et al. 1987, ApJ, 322, 706
- (14) D’Antona, F., & Mazzitelli, I. 1994, ApJS, 90, 467
- (15) de Geus, E. J., de Zeeuw, P. T., & Lub, J. 1989, A&A, 216, 44 (dG89)
- (16) Dehnen, W., & Binney, J. J. 1998, MNRAS, 298, 387
- (17) de Jager, C., & Nieuwenhuijzen, H. 1987, A&A, 177, 217
- (18) de Zeeuw, P. T., Hoogerwerf, R., de Bruijne, J. H. J., Brown, A. G. A., & Blaauw, A. 1999, AJ, 117, 354 (dZ99)
- (19) Duflot, M., Figon, P., & Meyssonnier, N. 1995, A&AS 114, 269
- (20) Eggen, O. L. 1998, AJ, 116, 1314
- (21) ESA, 1997, The Hipparcos and Tycho-1 Catalogues, ESA SP-1200
- (22) Feigelson, E. D. 1996, ApJ, 468, 306
- (23) Feigelson, E. D., & Lawson, W. A. 1997, AJ, 113, 2130
- (24) Frink, S., Röser, S., Alcalá, J. M., Covino, E., & Brandner, W. 1998, A&A, 338, 442
- (25) Frogel, J. A., & Stothers, R. 1977, AJ, 82, 890
- (26) Genova, R., Beckman, J., Bowyer, S., & Spicer, T. 1997, ApJ, 484, 761
- (27) Gregorio-Hetem, J., Lépine, J. R. D., Quast, G. R., Torres, C. A. O., & de la Reza, R. 1992, AJ, 103, 549
- (28) Güsten, R., & Mezger, P. G. 1982, Vistas in Astronomy, 26, 159
- (29) Hog, E., Fabricius, C., Makarov, V. V., et al. 2000, A&A, 355, 27
- (30) Hoogerwerf, R., & Aguilar, L. A. 1999, MNRAS, 306, 394
- (31) Krautter, J., Wichmann, R., Schmitt, J. H. M. M., et al. 1997, A&AS, 123, 329
- (32) Lépine, J. R. D., & Duvert, G. 1994, A&A, 286, 60
- (33) Lépine, J. R. D., & Leroy, P. 2000, MNRAS, 313, 263
- (34) Lépine, J. R. D., Mishurov, Yu. N., & Dedikov, S. Yu. 2001, ApJ, 546, 234
- (35) Lindblad, P. O., Grape, K., Sandqvist, Aa., & Schober, J. 1973, A&A, 24, 309
- (36) Mamajek, E. E., Lawson, W. A., & Feigelson, E. D. 2000, ApJ, 544, 356
- (37) Mamajek, E. E., Meyer, M. R., & Liebert, J. 2002, AJ, 124, 1670
- (38) Marinho, E. P., & Lépine, J. R. D., 2000, A&AS, 142, 165
- (39) Martín, E. L. 1998, AJ, 115, 351
- (40) Mishurov, Yu. N., & Zenina, I. A. 1999, A&A, 341, 81
- (41) Neuhäuser, R., & Brandner, W. 1998, A&A, 330, L29
- (42) Olano, C. A. 1982, A&A, 112, 195
- (43) Olano, C. A., & Pöppel, W. G. L. 1987, A&A, 179, 202
- (44) Padgett, D. L. 1996, ApJ, 471, 847
- (45) Palla, F., & Stahler, S. W. 1993, ApJ, 418, 414
- (46) Pöppel, W. G. L. 2001, in ASP Conf. Ser. 243, From Darkness to Light, ed. T. Montmerle & Ph. André, 667
- (47) Preibisch, T., Guenther, E., Zinnecker, H., et al. 1998, A&A, 333, 619
- (48) Preibisch, T., & Zinnecker, H. 1999, AJ, 117, 2381
- (49) Preibisch, T., Brown, A. G. A., Bridges, T., Guenther, E., & Zinnecker, H. 2002, AJ, 124, 404
- (50) Sartori, M. J. 2000, Ph.D. Thesis, IAG/Universidade de São Paulo, Brazil
- (51) Sartori, M. J., Lépine, J. R. D., & Dias, W. S. 2001, in ASP Conf. Ser. 244, Young Stars Near Earth: Progress and Prospects, ed. R. Jayawardhana & T. Greene, 98
- (52) Sciortino, S., Damiani, F., Favata, F., & Micela, G. 1998, A&A, 332, 825
- (53) Schultz, G. V., & Wiemer, W. 1975, A&A, 43, 133
- (54) Siess, L., Dufour, E., & Forestini, M. 2000, A&A, 358, 593
- (55) Straižys, V., & Kuriliene, G. 1981, Ap&SS, 80, 353
- (56) Teixeira, R., Ducourant, C., Sartori, M. J., et al. 2000, A&A, 361, 1143
- (57) Terranegra, L., Morale, F., Spagna, A., Massone, G., & Lattanzi, M. G. 1999, A&A, 341, L79
- (58) Thé, P.S., de Winter, D., & Pérez, M. R. 1994, A&AS, 104, 315
- (59) Torres, C. A. O. 1999, Publicação Especial 10, Observatório Nacional, Brazil
- (60) Torres, C. A. O., Quast, G., de la Reza, R., Gregorio-Hetem, J., & Lépine, J. R. D. 1995, AJ, 109, 2146
- (61) van Hoof, A. 1973, MKL, 23, 1
- (62) Walter, F. M., Vrba, F. J., Mathieu, R. D., Brown, A., & Myers, P. C. 1994, AJ, 107, 692
- (63) Whittet, D. C. B., Prusti, T., Franco, G. A. P., et al. 1997, A&A 327, 1194
- (64) Wichmann, R., Bastian, U., Krautter, J., Jankovics, I., & Rucinski, S. M. 1998, MNRAS, 301, L39