Lens or Binary? Chandra Observations of the Wide Separation Broad Absorption Line Quasar Pair UM 425
Abstract
We have obtained a 110 ksec Chandra ACIS-S exposure of UM425, a pair of QSOs at separated by 6.5″, which show remarkably similar emission and broad absorption line (BAL) profiles in the optical/UV. Our 5000 count X-ray spectrum of UM425A (the brighter component) is well-fit with a power law (photon spectral index ) partially covered by a hydrogen column of cm-2. The underlying power-law slope for this object and for other recent samples of BALQSOs is typical of radio-quiet quasars, lending credence to the hypothesis that BALs exist in every quasar. Assuming the same for the much fainter image of UM425B, we detect an obscuring column 5 times larger. We search for evidence of an appropriately large lensing mass in our Chandra image and find weak diffuse emission near the quasar pair, with an X-ray flux typical of a group of galaxies at redshift . From our analysis of archival HST WFPC2 and NICMOS images, we find no evidence for a luminous lensing galaxy, but note a 3- excess of galaxies in the UM425 field with plausible magnitudes for a galaxy group. However, the associated X-ray emission does not imply sufficient mass to produce the observed image splitting. The lens scenario thus requires a dark (high ratio) lens, or a fortuitous configuration of masses along the line of sight. UM425 may instead be a close binary pair of BALQSOs, which would boost arguments that interactions and mergers increase nuclear activity and outflows.
1 Introduction
An important question in current quasar research is whether powerful mass outflows persist in all quasars throughout their active lifetimes. Perhaps only some quasars host these outflows, which may be characteristic of an early phase of high activity and accretion rates, possibly triggered by galaxy interactions and mergers.
Mass outflows can be studied in detail through intrinsic quasar absorption lines that hold great promise for revealing the conditions near the supermassive black holes. The richest and most extreme absorption lines are found in quasars with broad absorption lines (BALs). About 10 - 15% of optically-selected QSOs have restframe ultraviolet spectra showing these BALs - deep absorption troughs displaced blueward from the corresponding emission lines in the high ionization transitions of C IV, Si IV, N V, and O VI (hiBALs hereafter). About 10% of BALQSOs also show broad absorption in lower ionization lines of Mg II or Fe II (loBALs). BALQSOs in general have higher optical/UV polarization than non-BAL QSOs, but the loBAL subsample tends to have particularly high polarization (Schmidt & Hines, 1999) along with signs of reddening by dust (Sprayberry et al., 1992; Egami et al., 1996). Large samples of BALQSOs from the Sloan Digital Sky Survey (SDSS) show BAL fractions of about 1/3 at the redshift of peak selection efficiency, and increasing reddening in the sequence non-BAL, hiBAL, loBAL has now been verified (Reichard et al., 2003). All the BALs are attributed to material along our line of sight flowing outward from the nucleus with velocities of up to km s. Emission line flux is not observed at comparable velocity widths, so if flux is scattered from the BAL material, its must cover of the BAL region (Hamann & Ferland, 1993). Together with the similar fraction of QSOs showing BALs, this suggests that most or possibly all QSOs contain BAL-type outflows, which are only seen along sightlines traversing the BAL clouds. In this orientation scenario, BALQSOs provide a unique probe of conditions near the nucleus of most QSOs. If so, we expect that their intrinsic X-ray emission should be consistent with those of normal QSOs. Recent studies with Chandra (Green et al., 2001; Gallagher et al., 2002a) support this orientation interpretation; once absorption columns of are accounted for, the underlying X-ray power-law continuua appear to have typical slopes and normalizations.
An important alternative interpretation is that BALQSOs are instead adolescent quasars in an outburst or transition phase, expelling a cocoon of circumnuclear gas and dust while evolving from active high (high Eddington fraction) QSOs toward normal QSOs (Hazard et al., 1984; Gregg et al., 2002). Links between low-ionization BALQSOs and IR-luminous mergers (Canalizo & Stockton, 2001; Fabian, 1999), and similarities between BALQSOs and and narrow line Seyfert 1 galaxies (Mathur, 2000; Brandt & Gallagher, 2000) support this scenario. Furthermore, since the outflows are thought to contain high metallicity gas (Hamann & Ferland, 1999; Arav et al., 2001), BALQSOs may be relevant to studies of the formation and early (high redshift) evolution of galactic nuclei. It is intriguing that approximately half of the QSOs found so far in the Sloan Digital Sky Survey show BALs (Zheng et al., 2000; Fan et al., 2003).
BALQSOs that occur in multiples hold particular interest. Those that are gravitationally lensed may be magnified, and possibly microlensed, providing an opportunity for study of the quasars’ intrinsic absorbers along slightly different sightlines (e.g. Lewis et al., 2002). Several lensed BALQSOs are known, but differential absorption studies are difficult, especially in X-rays, due to their close (typically ) spacing. Several multiple BALQSOs with wider separations () lack clear lens candidates. If they are lensed, they provide a wider binocular view of the intrinsic absorbers. If not, then as binary pairs their ( tens of kpc) linear separations allow practical study of the dynamical interactions proposed to spur high activity and mass outflow phases.
UM 425 is a pair of BALQSOs at redshift discovered by Meylan & Djorgovski (1989) in a search for lenses using selection of bright, high redshift (presumably magnified) quasars. Separated by 6.5″, the 2 brightest images have nearly identical optical/UV spectra and close velocities: km s from Meylan & Djorgovski (1989); and km s from Michalitsianos, Falco, Munoz, & Kazanas (1997). Deep imaging to reveals no deflector, arcs, or arclets (Courbin et al., 1995), whereas a massive lens should be present to cause the large separation. We observed UM 425 with Chandra on 2000-Apr-07 as part of an X-ray snapshot survey of BALQSOs. In that survey, we found that as a class BALQSOs are heavily obscured, but otherwise normal radio-quiet quasars (Green et al., 2001). Citing the relatively high count rate (0.04 cts/sec) for a BALQSO and the unique binary/lens nature of the of UM 425 system, we proposed for 120 ksec of followup imaging spectroscopy in Chandra cycle 3. In this paper we describe the results of this observation, including spectral, timing, and image analysis of the data. We also marshall evidence from previously unpublished archival HST data taken with STIS, WFPC2, and NICMOS.
2 Observation and data reduction
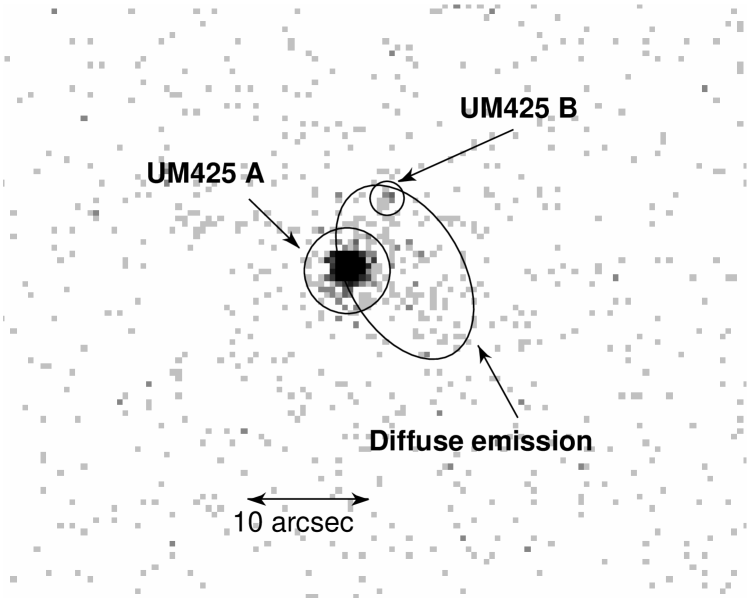
UM 425 was observed for 110 ksec on 2001-Dec-13 (ObsId 3013) at the nominal aimpoint of ACIS-S3 using 3.14 second full-frame readouts in timed very faint mode. A net of 4927 counts between 0.3 keV and 8.0 keV were detected for UM 425A, and 28.3 counts for UM 425B. The soft-band image (0.3-3.0 keV) of UM 425 is shown in Figure 1, with 0.5″ spatial binning corresponding to the ACIS CCD pixel size. The pixel intensities have been scaled logarithmically. The X-ray celestial coordinates match the optical counterpart coordinates to within , so there is no ambiguity about identification. Furthermore the relative separation of the X-ray A and B components matches the optical separation to within 0.3″. In addition to the two point sources associated with UM 425, we also see evidence for faint diffuse emission which could be associated with a foreground cluster or group of galaxies. This emission is significant at the 4.2- level, and is discussed in Section 5. Finally, there is a noticable extended linear feature approximately 25″ N-NW of UM 425A that coincides with a bright foreground galaxy in the field.
The Chandra X-ray observation data was produced by the CXCDS automatic processing pipeline, version 6.4.0. To take advantage of subsequent improvements in the ACIS response and gain calibration files, we used the CIAO tool acis_process_events to update the event file. At the same time, pixel randomization was turned off in order to allow spatial analysis at the finest level of detail. CIAO version 2.3 and CALDB version 2.10 were used in all data analysis and processing tasks.
The spectral data reduction followed the standard CIAO 2.3 thread to extract an ACIS spectrum for UM 425A: (1) Extract source events within a 4.0″ radius, using a background annulus spanning 8 to 30″; (2) Create the aspect histogram file; (3) Create the RMF and ARF files appropriate to the time-dependent source position on chip. The ARF was corrected for the ACIS time-dependent quantum efficiency degradation using the corrarf program111http://cxc.harvard.edu/cal/Acis/Cal_prods/qeDeg/index.html. In addition to the standard thread, the event data were filtered on energy to use the range 0.3-8.0 keV and they were grouped to an average of 30 counts per bin.
It should be be noted that the region used to extract the spectrum for component A includes some of the extended emission discussed in Section 5. However, this component contributes fewer than counts, and therefore does not noticably affect the spectral fitting.
3 Spectral Modeling
We carried out spectral modeling of sources in the UM 425 field using Sherpa, a generalized modeling and fitting environment within CIAO. We fit using data-variance statistics with Marquardt-Levenberg optimization. The energy range used for fitting was 0.5-8 keV, which avoids the region below 0.5 keV that is not well calibrated.
3.1 UM 425A
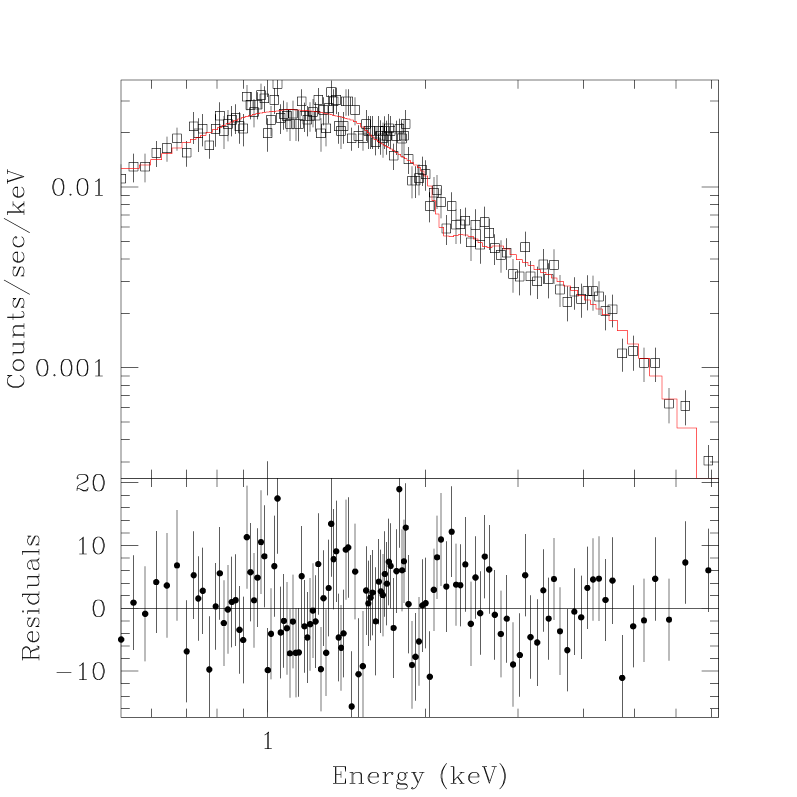
The results of spectral modeling of the UM 425A spectrum are given in Table 1. After taking account of the Galactic column of atoms cm-2, the X-ray spectrum of UM 425 is well-fit with either a partially-covered neutral absorber or a highly-ionized warm absorber. For neutral absorption, partial covering is required. The best fit neutral absorption model and residuals are shown in Figure 2. The underlying spectrum of UM 425 is consistent with the spectrum of a normal radio-quiet quasar at absorbed by an intrinsic column of cm-2. The power-law index for UM 425 agrees with the value of seen with ASCA for RQQs at redshifts (Reeves & Turner, 2000). Confidence contours for powerlaw slope and partial covering fraction are shown plotted against intrinsic absorbing column in Figure 3.
| Model | Amplitude | Other | Flux | (DOF) | ||
| (a) | (b) | (c) | (d) | (e) | ||
| Gal (fixed) | … | … | 430.5(122) | |||
| … | 145.3(121) | |||||
| Part. Cov. | 122.2(120) | |||||
| Warm absorber (CLOUDY) | 126.3(120) | |||||
| Notes: Uncertainties are 90% confidence limits. (a) Power law photon index. (b) Power law normalization in units of photons cm-2 s-1 keV-1 at 1 keV (c) Absorbing column in units cm-2 at quasar redshift. (d) is the partial covering fraction, is the of the dimensionless CLOUDY ionization parameter (e) Model flux (0.3-8 keV) in units ergs cm-2 s-1 | ||||||


Given the observed count rate of 0.045 cts s-1 and the frame
read time of 3.1 sec, we estimate (using
PIMMS222http://asc.harvard.edu/toolkit/pimms.jsp) a pileup
fraction of approximately 6%. Using the jdpileup model
(Davis, 2001), we verify that this level of pileup does not have a
statistically significant impact on our best-fit spectral model
parameters.
The unabsorbed 0.5-2 keV flux is erg cm-2 s-1. Using that de-absorbed X-ray flux, the optical to X-ray flux ratio333 is the slope of a hypothetical power-law from 2500 Å to 2 keV; is , which is consistent with values for normal (non-BAL) QSOs at this redshift (Green et al., 1995). A trend of increasing with luminosity has been noted by many authors (e.g., Avni & Tananbaum 1982; Green et al. 1995), but most recently by Vignali et al. (2003). With its apparently large optical luminosity (log erg s-1 Hz-1 or log erg s-1, see Figure 9), the de-absorbed for UM 425A falls well within the rather large dispersion in this relationship.
Distinguishing between neutral and ionized absorption is not possible at this time due to systematic uncertainties in the ACIS response calibration in the critical region between 0.2-0.5 keV. An additional obstacle is the unfortunate coincidence between the expected location of O vii absorption and the instrumental Carbon edge (284 eV).
3.2 Iron lines and edges in a BALQSO spectrum
Chartas et al. (2002) found strong relativistic broad absorption lines (at rest energies 8.1 and 9.9 keV) in the ACIS-S spectrum of the =3.91 BALQSO APM 08279+5255. With XMM data for this same source, Hasinger, Schartel, & Komossa (2002) found instead an edge at rest energy 7.7 keV. In both cases these features were attributed to highly ionized Fe associated with the BAL outflow. In UM 425A we find no evidence for such features, nor do we see any residuals that are inconsistent with the systematic uncertainties in the ACIS response calibration. If the same absorption troughs or edges were present UM 425A with a similar strength, we would have detected them at 3 to 5- confidence.
3.3 UM 425B
The observed ratio of broadband (0.3-8 keV) source counts for the A and B components of UM 425 is 175. If UM 425 is truly a lensed system, this ratio would be well above the naively expected value of based on the 4.5 mag difference in R magnitude (Courbin et al., 1995). However, this does not account for the possibility of differing absorbing columns and/or dust-to-gas ratios along the two sightlines, especially considering that the X-ray emission region is much smaller than the optical. In fact, if we consider only the hard band counts (2.5-8 keV), which are largely unaffected by absorption, the ratio is .
Even though UM 425B has only 29 counts, we can test for the presence of differing absorption by fixing its X-ray power-law slope to the best-fit value for UM 425A. Using the partial covering model in Table 1 and freezing all parameters except for and Amplitude, we find a best fit column of cm-2 (90% confidence). With the assumption of the same underlying continuum, we find that UM 425B has a factor of 5 larger intrinsic absorbing column than UM 425A, and that the two spectra are inconsistent at approximately 3- confidence. The implications of this difference are discussed further in Section 8.
If UM 425 is not lensed, then this analysis only applies to the extent that a power law spectrum with is typical of QSOs at . However, with just 29 counts, we cannot usefully constrain both and .
3.4 Hardness ratio
An independent, model-free measure of spectral similarity is afforded by comparing the hardness ratio
of the two X-ray images. We perform photometry in 3 energy bands: soft (; 0.3-2.5keV), hard (; 2.5-8keV), and broad (; 0.3-8keV). We extract 4927 band counts from UM 425A, and 28 from B. Given the low background count rate in the ( band) image of pixel-1sec-1, errors may be considered as strictly . UM 425A has 3929 and 998 counts, so . Since UM 425B has 14 counts in both and bands for , it is harder at the level.444The uncertainties were calculated using standard error propogation assuming gaussian errors. For the UM 425B values (14 counts in the and bands) the error distribution deviates slightly from gaussian. However, we have verified by direct Monte-Carlo simulation that the standard deviation of HRB is 0.2, and that the hardness ratios HRA and HRB are inconsistent at approximately 99.7% (3-) confidence. This is consistent with our results from fitting of a power law spectral model.
4 Variability
Temporal variability is a potentially key diagnostic for constraining the absorber geometry for BALQSOs. Gallagher et al. (2002b) discovered hard-band variability at the 45% level on a timescale of 20 ksec in the nearby loBAL QSO Mkn 231. From this they inferred an absorbing geometry in which only indirect, scattered X-rays from multiple lines of sight are observed, with a small Compton-thick absorber blocking the direct X-rays.

UM 425A shows no significant short-term variability in either the broad, soft, or hard bands. Figure 4 shows the count rate as a function of time. The upper panels show the soft and hard bands for 16 equally spaced time bins covering the 110 ksec observation, and the lower panels show the broadband count rates, where the left panel has 16 bins and the right panel has 32 bins. The error bars are simply the square root of the number of counts in each bin. In all cases if we fit the data with a constant value (no variability) we find . Furthermore, over the much longer timescale of 1.7 years spanning the two Chandra observations, the count rates in the energy band 1.5-8 keV are consistent to within 1-. Within this energy band there is negligible change in effective area due to the ACIS quantum efficiency degradation over 1.7 years, and we can simply compare count rates.
As another test for variability, we used the Bayesian block method555http://astrophysics.arc.nasa.gov/jeffrey,666S-lang implementation of the algorithm kindly provided by M. Nowak (CXC/MIT) (Scargle, 2003, 1998) to characterize the lightcurve of UM 425A. This algorithm searches the unbinned event data for statistically significant changes in the event rate. We set the detection threshold to 2- confidence and the code found no rate changes above that significance level (for broad, soft, and hard band events).
5 Diffuse emission
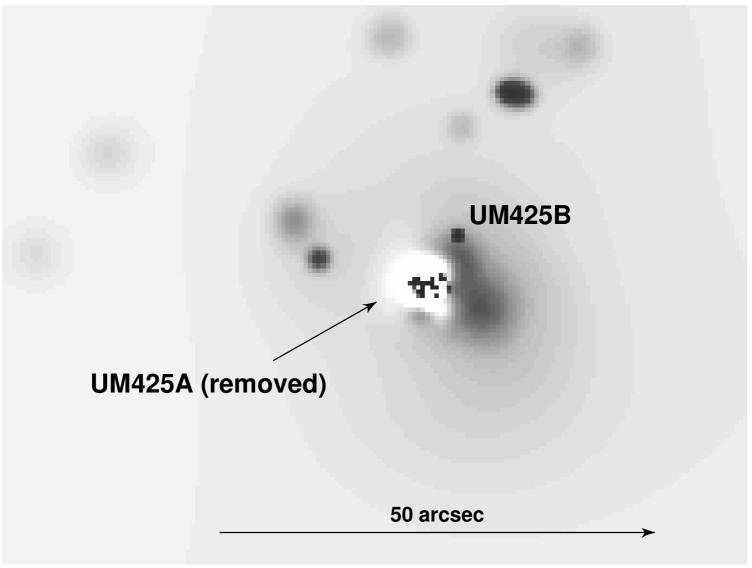
In Figure 5 we show an adapatively smoothed image of the soft photons in the UM425 field, where we have subtracted the central bright point source UM 425A. The image was created in the following manner: We first filtered the event list to include only photons in the 0.3-3.0 keV range, then used the CIAO tool csmooth to adaptively smooth with a minimum significance level of 3-. We calculated the exposure map, adaptively smoothed it with the same smoothing scale map, and divided so as to create a flattened exposure-corrected image. Next we used our best fit (partial covering) spectral model as input to ChaRT777http://asc.harvard.edu/chart/ and MARX888http://space.mit.edu/CXC/MARX/ to create a simulated PSF at the position of UM 425A. This PSF image was scaled to the same flux, smoothed with the original smoothing scale map, aligned with the centroid of UM 425A, and subtracted from the exposure-corrected UM 425A image. Due to the slight pileup (estimated at 6%) in our observation, the core flux may slightly underpredict the true incident flux. We estimate this could contribute a residual of no more than 11 photons outside of a 3″ radius in the smoothed image of Figure 5. Within about 3″ of the core of UM 425A the residuals are large compared to the faint diffuse flux (due to a combination of counting noise, pileup, and a slight mismatch in shape), but outside this radius the PSF subtraction effectively removes the contribution from UM 425A. Note that within the 3″ radius the residuals are no more than 3-, and the net subtracted counts are consistent with zero.
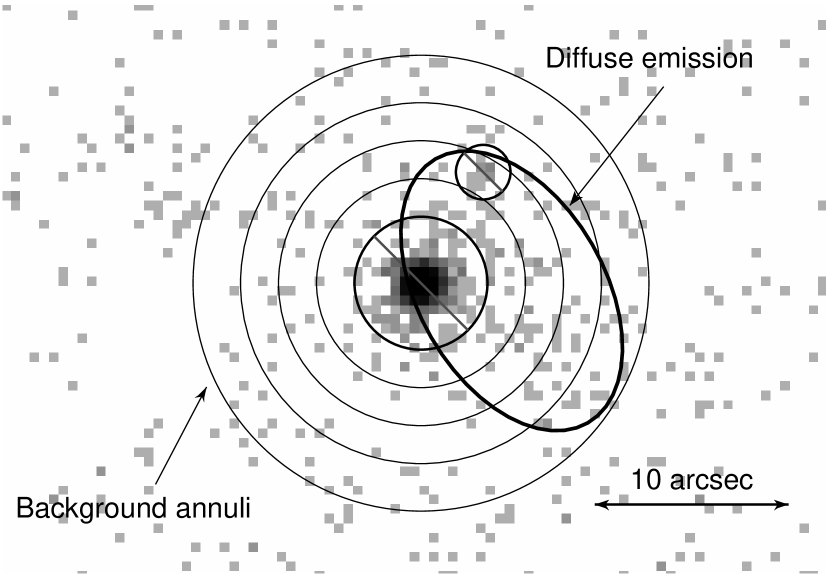
Faint diffuse emission is clearly evident in the smoothed images. This emission extends at least 20″ and is elliptical, centered about 5″ to the west of UM 425A. While the extended emission is highly significant, determining the net diffuse flux requires some care because of the very bright (4100 photons between 0.3-3 keV) point source. Due to small imperfections in the HRMA, we can expect about 30-60 photons from UM 425A to be scattered outside a 10″ radius.999http://cxc.harvard.edu/cal/Hrma/psf/PSF_wings_3c273/psf_wings.html Using the PSF-subtracted smoothed image may therefore give unreliable results when the diffuse component itself has only photons. Instead, we can estimate a lower limit on the net diffuse flux by considering only the elliptical core of emission and carefully subtracting the background from thin concentric annuli centered on UM 425A (see Figure 6). This analysis is done on the filtered event data, and allows us to determine the excess without relying on complex PSF models. Instead we make use of the axial symmetry of the on-axis PSF. We find that in the soft band between 0.3-3.0 keV, there is an excess of counts. In contrast, between 3.0-8 keV, the extended elliptical region has a net of counts, consistent with zero. Looking in more detail within the soft band, we find the counts are split roughly evenly between the energy bands 0.3-0.8 keV and 0.8-3 keV.
If these 51 photons originate in a Raymond-Smith plasma with a rest frame temperature keV, the observed flux erg s-1 cm-2 (in either a 0.3-3.0 keV or 0.1-2.4 keV band). This model is fully consistent with the broadband energy distribution of counts. At a redshift of 0.6 this model and flux correspond to an X-ray luminosity of (0.1-2.4 keV) erg s-1.101010We use a km s-1 Mpc-1, , and cosmology throughout. The luminosity and assumed plasma temperature we derive is consistent with values for groups of galaxies measured by Mulchaey & Zabludoff (1998) using ROSAT, but a factor of below the expected value for a cluster of galaxies massive enough to cause the observed image separation (discussed further in § 8).
The intriguing possibility remains111111Thanks to the anonymous referee for suggesting we add this discussion. that the diffuse emission originates from a cluster at the redshift of UM 425, as discussed by Mathur & Williams (2003). This would make this candidate cluster among the most distant known, second only to the vicinity of 3C 294 at (Fabian et al., 2001), where a small excess of emission is detected, associated with the southern radio hotspots. For the diffuse emission near UM 425, further observations and analysis are needed to determine the redshift of the candidate cluster, which if coincident with UM 425 has luminosity (0.1-2.4 keV) erg s-1. Similar diffuse emission around bright quasars is detected around serendipitous Chandra quasars in Green et al. (2003).
6 UV spectra
UM 425A and UM 425B were observed using HST/STIS (PI T. Gull) with the G230LB grating for a total of 11800 sec on 1998-Mar-10. The observations were done at a roll angle of 197.3∘ so that both objects would fall in the ″ slit. The results from this observation have not been previously published, so we retrieved the data from the HST archive and extracted spectra for the A and B components of UM 425. The first step in our data reduction was using the STSDAS ocrreject task to reject cosmic rays and combine the five CCD exposures into a single image. The final spectral extraction was then done with a custom IDL code which filtered out the bad pixels which remained after running ocrreject.

In Figure 7 we show an overlay of the STIS spectra for UM 425A (heavy line) and UM 425B (light line). The spectra have been normalized to have the same mean flux in the rest wavelength range 1070 - 1180 Å, which is devoid of strong absorption and emission features. In this range we find a flux ratio A/B of 102, consistent with the ratio of seen by Meylan & Djorgovski (1989) in the 1500 - 2400 Å rest wavelength range. In the plot the wavelength of the UM 425B spectrum has been shifted by 8.8 Å (observed frame) so that the difference in redshift (based on the peak of Ly-) is equal to the value of found by Michalitsianos, Falco, Munoz, & Kazanas (1997). This offset in the relative wavelength calibration for the B component is not excessive given the 2″ wide slit which was used. For this instrument configuration, an 8.8 Å wavelength offset would result if the B component were off-center in the slit by 0.325″.
The plot shows that both UM 425A and UM 425B have broad absorption lines due to O VI, H I Ly-, and N V. The absorption for O VI appears to extend to about 13000 km s-1 in both UM 425A and UM 425B, although with the limited S/N in UM 425B the presence of absorption beyond 5000 km s-1 is less certain. Near the Ly- emission line, however, both the emission line and absorption profiles are strikingly different. The sightline to UM 425B has a larger absorbing column density and/or a higher covering fraction in H I and N V. The Ly- emission line in UM 425B is at least a factor of two greater in equivalent width than in UM 425A.
Large spectral differences have been noted in accepted lensed systems, so do not rule out the lens hypothesis. SBS 1520+530 is a lensed BALQSO with a detected lens galaxy and time delay, and the two components show significantly different emission line equivalent widths (Burud et al., 2002b). This could be due to differential amplification of the continuum emitting region caused by microlensing. HE 2149-2745 (Burud et al., 2002a) is another lensed BALQSO system with a detected time-delay; it also shows large equivalent width differences in the emission lines, but none in the BALs. The continuum slopes are different, due either to microlensing or reddening by the (as-yet unidentified) lens galaxy.
Within the lens hypothesis, spectral differences could also be caused by pathlength time-delays combined with spectral variability. In this case we are effectively viewing one quasar at two epochs, so this difference could plausibly be explained by a combination of intrinsic emission line variability (see e.g. O’Brien & Gondhalekar, 1991; Small, Sargent, & Steidel, 1997) coupled with different, possibly variable, absorption profiles (Michalitsianos, Oliversen, & Maran, 1996).
Under the binary hypothesis, the different Ly- equivalent widths should be consistent with the global Baldwin effect (an anti-correlation of line equivalent width with luminosity observed in quasar samples; Baldwin, 1977). From the slope of (where (Ly) ) derived by Dietrich et al. (2002), the factor of 100 difference in brightness corresponds to an expected equivalent width that is about twice as large in UM 425B. Within the uncertainties caused by the strong absorption bands and the large scatter in the Baldwin relationship, this ratio is consistent with the observed STIS spectra.
7 HST imaging
The UM 425 field was imaged with HST/WFPC2 (PI J. Westphal) on 1995-May-01 for 600 sec with the F555W filter and for 1400 sec with the F814W filter. On 1998-May-28, the field was imaged in the infrared for 2560 sec using HST/NICMOS (imaged as part of the CASTLES project; Muñoz et al., 1998) with the F160W filter. We retrieved the data from the HST archive and used the standard IRAF tasks mscimage and imcombine to align and combine the individual exposures into a single final image. For the NICMOS data we removed a pedestal bias variation using the STSDAS tool pedsky. The reduced WFPC2 and NICMOS images are shown in Figure 8. The left panel shows the WFPC2 image overlayed with contours from our PSF-subtracted ACIS image (Figure 5), while in the right panel we show the NICMOS image.
In both panels the object labels A to E correspond to those defined in Meylan & Djorgovski (1989) and Courbin et al. (1995). The faint objects F and G are also seen in the the WFPC2 image, but were not previously identified in ground-based imaging. The contours show the X-ray emission, including the diffuse component centered about 5″ west of UM 425A, the point-like emission from UM 425B, emission to the north from a bright foreground galaxy () at (Meylan & Djorgovski, 1989), and possible optical blank-field sources about 10″ to the east.
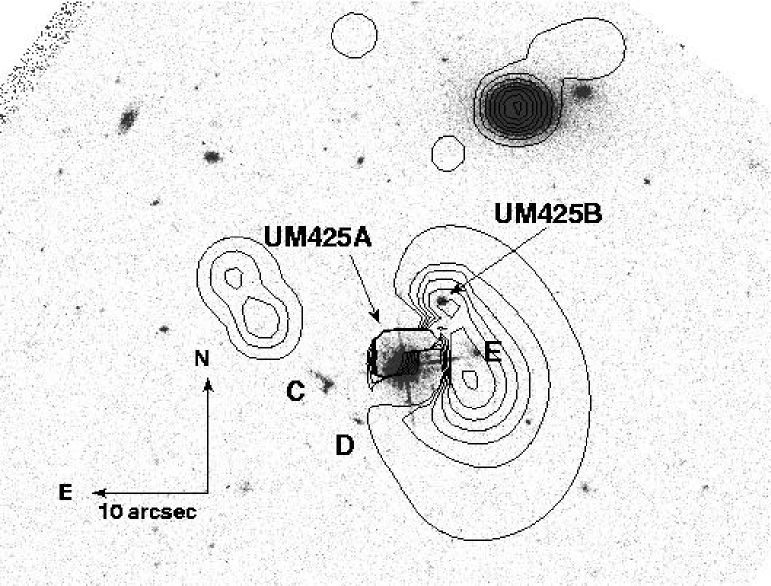
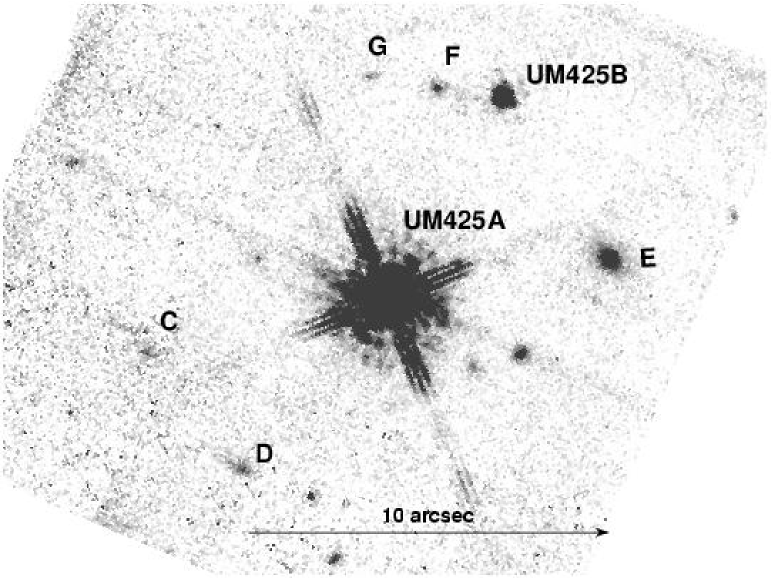
The NICMOS and WFPC images immediately confirm that the objects C, D, and E are extended. Object C has a notably disturbed morphology and is likely in the process of a merger. Meylan & Djorgovski (1989) noted the large number of faint galaxies in the field, which taken together with the slight spectroscopic difference of UM 425A and UM 425B, led them to postulate the existence of cluster at . Within a radius of 10″ of UM 425A we see no fewer than 10 confirmed sources which appear in both the NICMOS and WFPC images. This stands in stark contrast to another well-studied wide separation quasar pair Q1634+267A,B in which NICMOS imaging (2560 sec with the F160W filter) revealed no non-stellar sources within 8″ of the pair (Peng et al., 1999).
To estimate the significance of the apparent overdensity of sources in the NICMOS image, we have calculated band magnitudes for all sources within a 16″16″ box centered on UM 425A. This was done using aperture photometry to calculate the net counts (DN s-1) for all sources which were detected in both the WFPC and NICMOS images. We converted the net count rate to a flux at 1.6m using the inverse sensitivity factor ergs cm-2 Å-1 DN-1 supplied in the calibrated NICMOS image FITS file header. Finally, the flux was converted to an magnitude using the NICMOS Units Conversion Form121212http://www.stsci.edu/hst/nicmos/tools/conversion_form.html. For the two quasars UM 425A and UM 425B we find magnitudes of 14.1 and 18.6 mag, respectively. The magnitude difference of 4.5 mag is consistent with the average R-band difference of 4.4 mag seen by Courbin et al. (1995).
A total of 11 objects were processed in this way, with magnitudes as faint as 22.7 mag. Excluding UM 425A and UM 425B (since they are known background objects and the field was selected for their presence), there are 6 objects brighter than . At levels fainter than this our source detection becomes incomplete. We calculate the expected number of sources by using the NICMOS H-band number count versus magnitude given by Yan, McCarthy, Storrie-Lombardi, & Weymann (1998). Integrating the number count relation up to a faint limit of 22.0 mag gives a value of 20.3 sources per square arcmin. In our 16″16″ box, with a 2″ radius around UM 425A excluded, we therefore expect 1.38 sources. The probability of seeing 6 or more sources is 0.0030, implying that there is an overdensity of galaxies in the UM 425 field at approximately 3- confidence. For UM 425 the combination of diffuse X-ray emission and a rich field of galaxies strongly suggests the presence of a galaxy group or cluster in this direction. We discuss this possibility further in § 8.
If UM 425 were lensed, a lensing galaxy would be expected nearer the faint component. We see no evidence for a possible lensing galaxy near UM 425B. Taking the image of UM 425A to define the instrument PSF, we used the CIAO Sherpa fitting program to subtract the PSF from the image of UM 425B. Outside a core radius of 0.15″ we saw no significant residuals. We then created simulated images by adding the source counts from one of the faint ( mag) galaxies in the field to the UM 425B image. This was done for several positions on the line between UM 425B and UM 425A, and we found we would clearly detect such a galaxy at a distance greater than 0.3″ from UM 425B. A bright galaxy such as the galaxy in the field would be detected even if it were exactly coincident with UM 425B.
8 Discussion
8.1 A Galaxy Group or Cluster as a Lens Candidate
If a wide-separation quasar pair (WSQP) is produced by a lens mass modeled as a simple, singular isothermal sphere (SIS, see Schneider, Ehlers, & Falco, 1992), the most conservative flux limits are derived by assuming the lens lies at the “minimum flux redshift,” the redshift that would minimize the observed X-ray flux. If we neglect K-corrections, the flux from the lens is
| (1) |
where is the Hubble radius . For our assumed cosmology, the flux is minimized at a lens redshift of .
The image separation depends only on the velocity dispersion of the potential and the ratio of the comoving distances131313We calculate angular size distances in our cosmological model using the ANGSIZ code of Kayser, Helbig, & Schramm (1997). between the lens and the source, , and the observer and the source, . In the SIS model for the lensing mass, and using the minimum flux redshift for , the observed image separation of 6.5 implies a cluster velocity dispersion of . This corresponds to a minimum enclosed cluster mass of to induce the observed pair separation. Combining the relation from, e.g., Mulchaey & Zabludoff (1998) and the relation from, e.g., Markevitch (1998), and neglecting any possible cosmological evolution of these relations for a qualitative estimate, we obtain erg s-1 and keV for such a cluster. At , this corresponds to erg cm-2 s-1. The flux we observe is about 6 times fainter than this, so we detect no normal cluster or group that could be solely responsible for the observed image splitting in a lens scenario.
Do the galaxies detected in the WFPC2 and NICMOS images suggest the existence of a group at the minimum flux redshift? We use the public HyperZ photometric redshift code of Bolzonella, Miralles, & Pello (2000), where an E/S0 spectral energy distribution yields . Together with a characteristic magnitude of (Gardner et al., 1997; Glazebrook et al., 1995) we take . The brightest galaxy in the near field (marked E in Figure 8) has , which if at corresponds to 0.3, a fairly bright galaxy. Most of the objects detected near the NICMOS flux limit correspond to about 0.04, and would be small galaxies at this redshift. Therefore, these objects are plausible members of a group or small cluster at . If these objects are galaxies in a lensing group at a higher redshift, then its X-ray flux is more than a factor lower for its mass than seen in nearby groups, which could imply a baryon fraction at most half normal.
In lenses clearly due to a combination of a cluster and a galaxy (particularly Q0957+561; Keeton et al., 2000), a massive, luminous lens galaxy dominates the image splitting. Here we see no such candidate galaxy, even in the infrared, to a limit of approximately . Such a galaxy, unless completely different from all other known lens galaxies (e.g., Rusin et al., 2003; Kochanek et al., 2000; Xanthopoulos et al., 1998), must make a negligible contribution to the overall image separation.
8.2 Optical Brightness Argues for a Lens
UM 425A is about an order of magnitude brighter (in the optical) than quasars at comparable redshifts. Figure 9 compares its luminosity to 27,000 quasars and AGN from Veron-Cetty & Veron (2001). This observation would suggest that UM 425A might be magnified by a lens; anomalous brightness was exactly the criterion that (Meylan & Djorgovski, 1989) used originally to select the object as a lens candidate (Meylan & Djorgovski, 1989). UM 425A is especially bright for a BALQSO. Based on polarization studies (Goodrich, 1997), BALQSO fluxes may be attenuated by a factor of about 5, which contributes to their diminished representation in flux-limited optical surveys (Hewett & Foltz, 2003). Figure 9 shows BALQSOs from the Large Bright Quasar (Hewett, Foltz, & Chaffee, 1995), the SDSS (Reichard et al., 2003), and FIRST Bright Quasar (Becker et al., 2000) surveys.
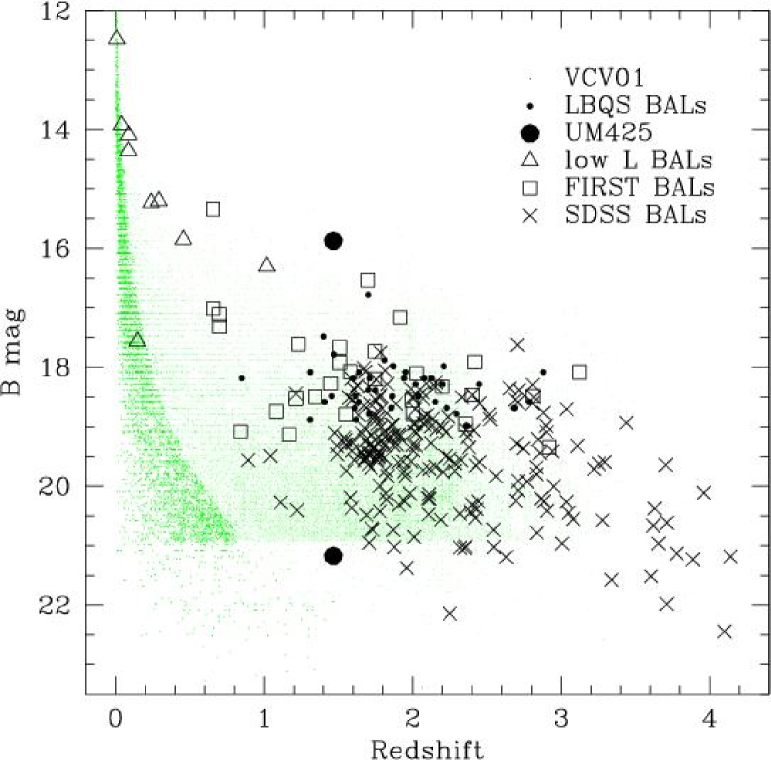
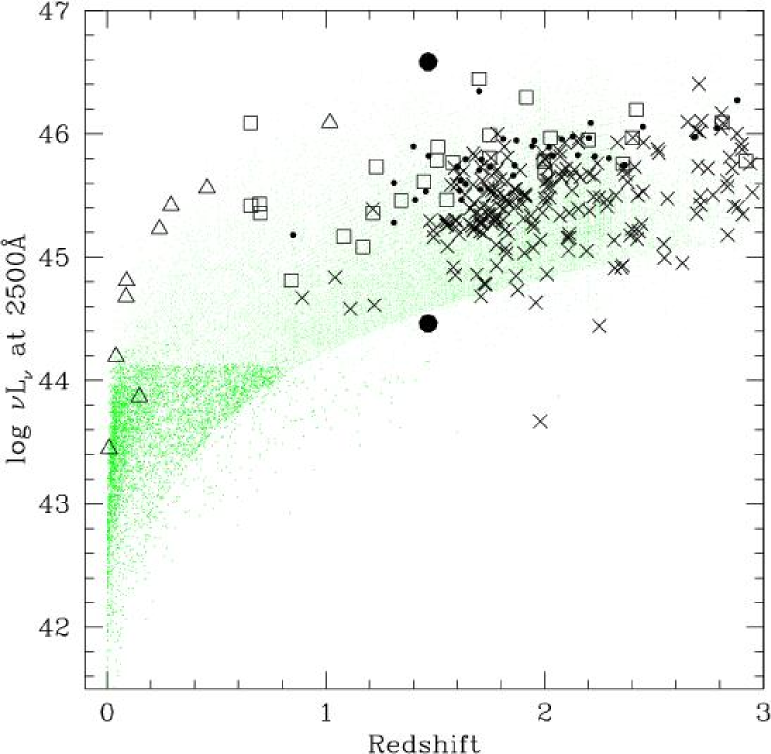
Figure 9 also shows that UM 425B is underluminous for a BALQSO. This further supports a lensing interpretation because to date, because strong BALs like these are found only in luminous QSOs. This is partly a selection effect, because CIV BALs do not enter the observed-frame optical bandpass until and a CIV BALQSO as faint as UM 425B would only have been detected in a ground-based optical survey if it extended to . To find CIV BALs in nearby low-luminosity AGN, a large dedicated UV spectroscopic survey is required (e.g., GALEX; Martin et al. 1997). However, among the hundreds of existing UV spectra of lower luminosity () AGN, not a single example of a strong BAL is known.
The lowest luminosity BAL analogs have been found from space-based UV spectra of known AGN, or from the less common low-ionization Mg II BALs which enter the optical band for . A thorough search of the literature reveals just a handful of objects with broad absorption lines. The low redshift BAL AGN are shown as open triangles in Figure 9. We could find only 3 BALQSOs less luminous than UM 425B, all at . All these indeed fall into two classes. (1) The loBAL QSOs. These loBALs constitute a much higher fraction (27%) of IR-selected than optically-selected QSOs (1.4%; Boroson & Meyers 1992), and are thought to provide evidence for a link between interaction/merger processes and accretion (Canalizo & Stockton, 2001). The FeloBALs like IRAS07598+6508 (Hines & Wills, 1995) or SDSS 173049.10585059.5 (Hall et al., 2002) are particularly highly reddened and polarized and show absorption from excited fine-structure levels or excited atomic terms of Fe II or Fe III (Becker et al., 1997). However, UM 425B shows neither spectroscopic (see Figure 7) nor photometric evidence for being a loBAL since the colors of UM 425A and UM 425B are identical within the errors (Meylan & Djorgovski, 1989). (2) The so-called ’mini-BALs’ such as PG 1115+080, PG 1411+442, RX J0911.4+0551, or NGC3516 (e.g., Kraemer et al. 2002). These may be the low luminosity analogs of BALQSOs, but have weaker BALs. From the accepted CIV ‘balnicity’ test of Weymann, Morris, Foltz, & Hewett (1991) might also classify UM 425, as a miniBAL, but the low S/N blueward of CIV in the spectrum of Michalitsianos, Falco, Munoz, & Kazanas (1997), makes it difficult to tell. The balnicity test is not well-defined for lines other than CIV, but the Ly and NV absorbers in Figure 7 are impressive enough (we measure equivalent widths of and Å, respectively).
True BALs are virtually unknown in low-luminosity quasars. Correlations in absorbed (soft X-ray weak) quasars between luminosity and CIV absorption (both equivalent width and maximum outflow velocity) suggest that this trend may hold up in future samples as well (Laor & Brandt, 2002).
UM 425A is quite bright for a QSO, and especially for a BALQSO, so may be magnified by a lens. UM 425B is quite dim for a BALQSO, so may be demagnified by a lens. In summary, the anomalous brightnesses of both UM 425A and UM 425B argue for the lens interpretation.
8.3 Implications of Lensing for BAL structure
Standard lensing models may not be easily applicable in the case of BALQSOs, if there is structure to the outflowing clouds on angular scales similar to the image separation. For instance, direct application of the observed optical flux ratios may be misleading, since our Chandra observation already demonstrates the likelihood of significantly different absorbing columns along the line of sight, and the relative fractions of transmitted, obscured, and reflected light are unknown.
If UM 425 is lensed, then the two components image slightly different sightlines from the lens to the QSO central continuum source, probing potentially different absorbing material. If the lens is roughly half the proper distance to the quasar, the sightlines will be be separated by ″.5. At a radius of 5 pc, the sightlines would have a transverse separation of cm. Probing the structure of the BAL medium at this size scale is quite interesting in the context of quasar structure, and particularly for recent multiphase models for the BAL outflow, such as the model proposed by Everett, Königl, & Arav (2002). These authors are able to fit high-resolution optical spectroscopic data for the BALQSO FIRST J1044+3656 with a dense cloud ( cm-3) at a distance of pc, embedded in a warm outflowing medium. If a similar physical situation applies for UM 425, and the differential X-ray absorbing column cm-2 were due to a single cloud, then that cloud would have a linear dimension a roughly cm. This nicely matches the transverse separation of the two sightlines.
A complication to this reasoning is that the gravitational time delay of at least 1.7 years (e.g. Michalitsianos, Falco, Munoz, & Kazanas, 1997) means that we are viewing the two sightlines at different epochs. In that time (observed frame) an absorbing cloud would travel cm along the line of sight, assuming an outflowing velocity of 10000 km sec-1. Unless the absorbing cloud velocities are directed very nearly toward our line of sight, the geometric distance between the two lines of sight is overwhelmed by the effective temporal distance due to the outflow velocity and the lens time delay. Nevertheless, it should be noted that BAL models which assume a wind that is radiatively-driven from the central source will naturally produce velocities that are primarily radial. The magnitude of the residual transverse component (e.g. if the wind is launched from the disk) is model dependent. It could be the case that the geometric and temporal distances are of comparable size.
8.4 Interaction/Merger Hypothesis
The a priori odds of finding a BALQSO pair such as this seems low even using more recent estimates of the true fraction of BALQSOs of 20-33% (Hewett & Foltz, 2003; Reichard et al., 2003). However, the close interaction or ongoing merger of such a close pair may enhance the probability if outflow (BAL) activity is triggered in both nuclei. If not lensed, UM 425 would represent evidence for merger-induced BALQSO activity, giving strength to arguments that the BAL phenomenon may be an evolutionary phase of QSO activity. A large sample of WSQPs could serve to constrain the lifetimes of triggered activity. As an example, the projected linear separation of the pair is kpc. Assuming they have relative velocities of about 600 km s (Michalitsianos, Falco, Munoz, & Kazanas, 1997), the induced activity has already lasted of order 70 Myr.
9 Summary
In summary, the arguments for a lens interpretation are:
-
•
similar redshift, colors, and spectral type of UM 425A and UM 425B
-
•
anomalous brightness of UM 425A for a quasar at
-
•
anomalous faintness of UM 425B for a BALQSO
-
•
some X-ray and -band evidence for an intervening galaxy group
The arguments for the binary hypothesis are:
-
•
significantly different X-ray absorption
-
•
any putative intervening galaxy group is X-ray underluminous for the required lensing mass
-
•
significantly different UV emission line profiles
-
•
emission line equivalent widths consistent with the Baldwin Effect for the apparent luminosity differences
Unfortunately, while the evidence weighs toward the binary hypothesis, resolution of the debate is not final. The UV spectroscopic differences are similar to those seen in some definitively lensed quasars, and larger absorption column differences in X-rays than UV are quite plausible given that the size, placement and ionization state of quasar X-ray and UV absorbing regions probably differ (e.g., Krolik & Kriss 2001; Hamann, Netzer, & Shields 2001). As often noted, the most definitive test is detection of a time delayed variability between the image components. For a given image separation in the lens scenario, the time delay depends strongly on the asymmetry of the images with respect to the lens, with the time delay smallest for a symmetric system. Here the lens position is unknown. For large flux ratios, the asymmetry is assumed to be large so that the asymmetry factor goes to unity, and the time delay is maximized (its value depending mostly on the image separation ). If the maximal delay of years holds (Courbin et al., 1995), photometric variability studies are prohibitively difficult. A more efficient method for proving the existence of lensing is near infrared imaging detection of the quasar host galaxy morphology with sufficient resolution and signal to see shear (e.g., FSC10214+4724; Evans et al. 1999, B0712+472; Jackson, Xanthopoulos, & Browne 2000).
We wish to thank Aneta Siemiginowska for helpful discussions on lensing and the extended emission, and Smita Mathur for comments on and contributions to the original Chandra proposal. Thanks to Chris Kochanek and Josh Winn for guidance and comments. This work was supported by CXO grant GO2-3132X and NASA grant NAS8-39073. PJG and TLA gratefully acknowledge support through NASA Contract NASA contract NAS8-39073 (CXC).
References
- Arav et al. (2001) Arav, N. et al. 2001, ApJ, 561, 118
- Avni & Tananbaum (1982) Avni, Y., & Tananbaum, H. 1982, ApJ, 262, L17
- Baldwin (1977) Baldwin, J.A. 1977, ApJ, 214, 679
- Becker et al. (1997) Becker, R. H., Gregg, M. D., Hook, I. M., McMahon, R. G., White, R. L., & Helfand, D. J. 1997, ApJ, 479, L93
- Becker et al. (2000) Becker, R. H., White, R. L., Gregg, M. D., Brotherton, M. S., Laurent-Muehleisen, S. a., & Arav, N. 2000, ApJ, 538, 72
- Bolzonella, Miralles, & Pello (2000) Bolzonella, M., Miralles, J.-M., & Pello, R. 2000, A&A 363, 476
- Boroson & Meyers (1992) Boroson, T. A. & Meyers, K. A. 1992, ApJ, 397, 442
- Brandt & Gallagher (2000) Brandt, W. N. & Gallagher, S. C. 2000, NewAR, 44, 461
- Burud et al. (2002a) Burud, I. et al. 2002, A&A, 383, 71
- Burud et al. (2002b) Burud, I. et al. 2002, A&A, 391, 481
- Canalizo & Stockton (2001) Canalizo, G. & Stockton, A. 2001, ApJ, 555, 719
- Chartas et al. (2002) Chartas, G. et al. 2002, ApJ, 579. 169
- Courbin et al. (1995) Courbin, F. et al. 1995, A&A, 303, 1
- Davis (2001) Davis, J. E. 2001, ApJ, 562, 575
- Dietrich et al. (2002) Dietrich, M., Hamann, F., Shields, J. C., Constantin, A., Vestergaard, M., Chaffee, F., Foltz, C. B., & Junkkarinen, V. T. 2002, ApJ, 581, 912
- Egami et al. (1996) Egami, E., Iwamuro, F., Maihara, T., Oya, S., & Cowie, L. L., 1996, AJ 112, 73
- Elvis (2000) Elvis, M. 2000, ApJ, 545, 63
- Evans et al. (1999) Evans, A. S., Scoville, N. Z., Dinshaw, N., Armus, L., Soifer, B. T., Neugebauer, G., & Rieke, M. 1999, ApJ, 518, 145
- Everett, Königl, & Arav (2002) Everett, J., Königl, A., & Arav, N. 2002, ApJ, 569, 671
- Fabian (1999) Fabian A. 1999, MNRAS, 308, L39
- Fabian et al. (2001) Fabian A. C, Crawford, C. S., Ettori, S., & Sanders, J. S. 2001, MNRAS, 322, L11
- Fan et al. (2003) Fan, X. et al. AJ, 2003, in press
- Gallagher et al. (2002a) Gallagher, S. C., Brandt, W. N., Chartas, G., Garmire, G. P 2002, ApJ, 567, 37
- Gallagher et al. (2002b) Gallagher, S. C., Brandt, W. N., Chartas, G., Garmire, G. P., & Sambruna, R. M. 2002, ApJ, 569, 655
- Gardner et al. (1997) Gardner, J. P., Sharples, R. M., Frenk, C. S., Baugh, C. M., & Carrasco, B. E. 1997, ApJ, 480, L99
- Glazebrook et al. (1995) Glazebrook, K., Peacock, J. A., Miller, L., & Collins, C. A. 1995, MNRAS, 275, 169
- Goodrich (1997) Goodrich, R. W. 1997, ApJ, 474, 606
- Green et al. (1995) Green, P. J. et al. 1995, ApJ, 450, 51
- Green et al. (2001) Green, P. J. et al 2001, ApJ, 558, 109
- Green et al. (2003) Green, P. J. et al 2003, ApJ, submitted
- Gregg et al. (2002) Gregg, M. D., Becker, R. H., White, R. L., Richards, G. T., Chaffee, F. H., & Fan, X. 2002, ApJ, 573, 85
- Hall et al. (2002) Hall, P. B. et al. 2002, ApJS, 141, 267
- Hamann & Ferland (1993) Hamann, F. W., & Ferland, G.J. 1993, ApJ, 418, 11
- Hamann & Ferland (1999) Hamann, F. W., & Ferland, G. 1999, ARA&A, 37, 487
- Hamann, Netzer, & Shields (2001) Hamann, F. W. Netzer, H., & Shields, J. C. 2001, ApJ, 436, 101
- Hasinger, Schartel, & Komossa (2002) Hasinger, G., Schartel, N., & Komossa, S. 2002, ApJ, 573, L77
- Hazard et al. (1984) Hazard, C., Morton, D. C., Terlevich, R., & McMahon, R. 1984, ApJ, 282, 33
- Hewett, Foltz, & Chaffee (1995) Hewett, P. C., Foltz, C. B., & Chaffee, F. H. 1995, AJ, 109, 1498
- Hewett & Foltz (2003) Hewett, P. C. & Foltz, C. B. AJ, 2003, in press (astro-ph/0301191)
- Hines & Wills (1995) Hines, D. C. & Wills, B. J. 1995, ApJ, 448, L69
- Jackson, Xanthopoulos, & Browne (2000) Jackson, N., Xanthopoulos, E., & Browne, I. W. A. 2000, MNRAS, 311, 389
- Kayser, Helbig, & Schramm (1997) Kayser, R., Helbig, P., & Schramm, T., 1997, A&A, 318, 680
- Keeton et al. (2000) Keeton, C. R. et al. 2000, ApJ, 542, 74
- Kochanek et al. (2000) Kochanek, C. S. et al. 2000, ApJ, 543, 131
- Korista et al. (1996) Korista, K. T. et al. 1996, ApJ, 461, 641
- Kraemer et al. (2002) Kraemer, S. B., Crenshaw, D. M., George, I. M., Netzer, H., Turner, T. J., & Gabel, J. R. 2002, ApJ, 577, 98
- Krolik & Kriss (2001) Krolik, J. H., & Kriss, G. A. 2001, ApJ, 561, 684
- Laor & Brandt (2002) Laor, A., & Brandt, W. N. 2002, ApJ, 569, L641
- Lewis et al. (2002) Lewis, G. F., Ibata, R. A.; Ellison, S. L., Aracil, B., Petitjean, P., Pettini, M., & Srianand, R. 2002, MNRAS, 334, L7
- Markevitch (1998) Markevitch, M. 1998, ApJ, 504, 27
- Martin et al. (1997) Martin, C. et al. 1997, Bulletin of the American Astronomical Society, 29, 1309
- Mathur (2000) Mathur, S. 2000, MNRAS, 314, L17
- Mathur & Williams (2003) Mathur, S., & Williams, R. J. 2003, ApJL, submitted
- Meylan & Djorgovski (1989) Meylan, G. & Djorgovski, S. 1989, ApJ, 338, L1
- Michalitsianos, Oliversen, & Maran (1996) Michalitsianos, A. G., Oliversen, R. J. & Maran, S. P. 1996, ApJ, 458, 67
- Michalitsianos, Falco, Munoz, & Kazanas (1997) Michalitsianos, A. G., Falco, E. E., Muñoz, J. A., & Kazanas, D. 1997, ApJ, 487, L117
- Mulchaey & Zabludoff (1998) Mulchaey, J. S. & Zabludoff, A. I. 1998, ApJ, 496, 73
- Muñoz et al. (1998) Muñoz, J. A., Falco, E. E., Kochanek, C. S., Lehár, J., McLeod, B. A., Impey, C. D., Rix, H.-W., & Peng, C. Y. 1998, Ap&SS, 263, 51
- O’Brien & Gondhalekar (1991) O’Brien, P. T. & Gondhalekar, P. M. 1991, MNRAS, 250, 377
- Peng et al. (1999) Peng, C. Y. et al. 1999, ApJ, 524, 572
- Reeves & Turner (2000) Reeves, J. N. & Turner, M. J. L. 2000, MNRAS, 316, 234
- Reichard et al. (2003) Reichard, T. A. et al. 2003, AJ, in press (astro-ph/0301019)
- Rusin et al. (2003) Rusin, D. et al. 2003, ApJ, in press (astro-ph/0211229)
- Scargle (2003) Scargle, J. D. 2003, in prep
- Scargle (1998) Scargle, J. D. 1998, ApJ, 504, 405
- Schmidt & Hines (1999) Schmidt, G. & Hines, D. 1999, ApJ, 512, 125
- Schneider, Ehlers, & Falco (1992) Schneider, P., Ehlers, J., & Falco, E. E. 1992, Gravitational Lenses, Springer-Verlag Berlin Heidelberg New York
- Small, Sargent, & Steidel (1997) Small, T. A., Sargent, W. L. W., & Steidel, C. C. 1997, AJ, 114, 2254
- Sprayberry et al. (1992) Sprayberry, D. & Foltz, C. B. 1992, ApJ, 390, 39
- Tolea, Krolik, & Tsvetanov (2002) Tolea, A., Krolik, J. H., & Tsvetanov, Z. 2002, ApJ, 578, L31
- Veron-Cetty & Veron (2001) Veron-Cetty M.P., & Veron P. 2001, A&A, 374, 92
- Vignali et al. (2003) Vignali, C., Brandt, W. N., & Schneider, D. P. 2003, AJ, 125, 433
- Weymann, Morris, Foltz, & Hewett (1991) Weymann, R. J., Morris, S. L., Foltz, C. B., & Hewett, P. C. 1991, ApJ, 373, 23
- Xanthopoulos et al. (1998) Xanthopoulos, E. et al. 1998, MNRAS, 300, 649
- Yan, McCarthy, Storrie-Lombardi, & Weymann (1998) Yan, L., McCarthy, P. J., Storrie-Lombardi, L. J., & Weymann, R. J. 1998, ApJ, 503, L19
- Zheng et al. (2000) Zheng, W. et al. 2000, AJ, 120, 1607