X-ray Emission from the Hot ISM and SW Radio Lobe of the Nearby Radio Galaxy Centaurus A
Abstract
We present results from two Chandra/ACIS-I observations and one XMM-Newton observation of X-ray emission from the ISM and the inner radio lobes of the nearby radio galaxy Centaurus A. The ISM has an average radial surface brightness profile that is well described by a -model profile with index =0.400.04 and a temperature of 0.29 keV beyond 2 kpc from the nucleus. We find that diffuse X-ray emission is coincident with the outer half of the southwest radio lobe, and a bright X-ray enhancement is detected along the edge of the lobe. On the basis of energetic and lifetime arguments, we reject a nonthermal explanation for this emission. We model this emission as a thin, hot shell or cap of X-ray emitting plasma surrounding the radio lobe that was created by the supersonic inflation of the lobe. This plasma shell is both hotter than (2.9 keV) and greatly overpressurized relative to the ambient ISM indicating supersonic expansion. We estimate that the lobe is expanding into the ISM at approximately Mach 8.5 or 2400 km s-1. We are not directly observing the bow shock, but rather the cooler, denser material that is accumulating ahead of the contact discontinuity. The thermal energy in the shell is a significant fraction of the thermal energy of the hot ISM, demonstrating the possibility that the hot ISM of early galaxies can be re-energized by outflows from nuclear activity. Interestingly, no similarly bright X-ray emission is detected in or along the edge of the NE lobe, implying that there are differences in the dynamics and evolution of the kpc-scale radio components.
1 Introduction
Centaurus A (NGC 5128, Cen A) is the nearest (d3.4 Mpc, 1 kpc) active galaxy to the Milky Way, and because of its proximity has been well studied across the electromagnetic spectrum (Israel, 1998). Optically, Cen A is an elliptical galaxy crossed by a dust lane, thought to be the result of a merger with a small spiral galaxy (Schiminovich et al., 1994). Radio observations of Cen A show a bright nucleus, a milliarcsecond-scale jet and counter jet, a one-sided kiloparsec scale jet NE of the nucleus, two radio lobes (the inner radio lobes) NE and SW of the nucleus, and extended, diffuse emission spanning an 84∘ region on the sky (Burns, Feigelson, & Schreier, 1983; Clarke, Burns, & Norman, 1992; Tingay et al., 1998; Israel, 1998). Earlier X-ray observations of Cen A found a complex morphology with emission from several distinct components including the active nucleus, the jet, the hot ISM, and a population of X-ray binaries (Feigelson et al., 1981; Döbereiner et al., 1996). ROSAT HRI and EXOSAT LE observations detected X-ray emission from the vicinity of the southwest radio lobe (Döbereiner et al., 1996; Morini, Anselmo, & Molteni, 1989), but the limited spectral resolution of these observations and possible confusion with a bright foreground star made interpretation uncertain.
The Einstein Observatory first detected extended X-ray emission from elliptical and S0 galaxies, and since then the spectra and morphology of these objects has been extensively studied with ROSAT and ASCA (Forman, Jones, & Tucker, 1985; Trinchieri & Fabbiano, 1985, 1991; Matsumoto et al., 1997; Finoguenov & Jones, 2000). For the most massive, luminous, early-type galaxies, this emission originates in a hot, low-density corona that is bound by the gravitating dark-matter potential. The X-ray spectra of these halos are generally well described by a single-temperature optically thin plasma model with depleted abundance values with respect to solar of Z0.5. Typical temperatures and central densities of this gas are 1 keV and 0.1 cm-3, respectively (Matsumoto et al., 1997). The cooling time of the gas in the central regions of these galaxies is 108 yrs, implying that in the absence of any energy input, the gas will cool and condense onto the central black hole. For less massive early-type galaxies, such as Cen A, the situation is somewhat more complex as the contribution of a population of LMXBs becomes increasingly more important to the overall X-ray emission (Fabbiano, Gioia, & Trinchieri, 1989; Brown & Bregman, 2001; Sarazin, Irwin, & Bregman, 2001). Chandra and XMM-Newton have greatly increased our understanding of these objects through spatially resolved measurements of the temperatures and elemental abundances from which the characteristics of dark matter halos can be deduced (Loewenstein & Mushotzky, 2002), and by resolving out the LMXB population in nearby objects (Blanton et al., 2001; Sarazin, Irwin, & Bregman, 2001).
Recent Chandra observations of the environments of several radio galaxies, notably NGC 4636 (Jones et al., 2002), M84 (Finoguenov & Jones, 2001), Hydra A (McNamara et al., 2000; David et al., 2001), Perseus A (Fabian et al., 2000), 3C 317 (Blanton et al., 2001), and M87 (Churazov et al., 2001), have demonstrated a complex interaction between the relativistic plasma of the radio lobes and the thermal, X-ray emitting gas of the interstellar or intracluster medium. There has also been considerable theoretical interest in this subject (Heinz, Reynolds, & Begelman, 1998; Brüggen et al., 2002; Brüggen & Kaiser, 2002; Reynolds, Heinz, & Begelman, 2001). In several cases, the thermal gas appears to have been displaced by the expansion of the radio lobes, creating a cavity or hole in the X-ray emission from the interstellar or intracluster medium. In some cases, X-ray emitting shells have been observed surrounding this cavity. In most cases where such shells have been detected, they are cooler than the surrounding medium and are thought to the result of entrainment of cool material from the central regions of the galaxy or cluster by the inflation of the lobe. In a few cases (NGC 4636 and Cyg A), there is some evidence that the shells are hotter than the ambient medium and have been shock heated by the supersonic inflation of the radio lobe.
One important consequence of this interaction, particularly if the expansion is supersonic, is that the kinetic energy of the particles in the radio lobes could be transferred to the thermal medium thereby heating it. The energy in shock-heated gas would be transferred to the ISM via conduction, perhaps even in the presence of magnetic fields (Narayan & Medvedev, 2001). This process could be particularly important in understanding the dynamics of the central regions of cooling-flow clusters, as the thermal lifetime of the centrally condensed material present in these objects is less than the Hubble time and heat conduction is less effective in the cores. The gas must therefore be occasionally reenergized during its lifetime. Radio galaxies are one possible source for this reheating. Unfortunately, there has been little direct evidence for heating of the interstellar or intracluster medium by the radio plasma for any of the sources listed above, and the relationship between nuclear outflows, nuclear activity, and cooling flows is uncertain. It has been suggested that there is a cyclical relationship between the cooling of the X-ray emitting corona and galaxy activity (Tucker & David, 1997; Ciotti & Ostriker, 1997, 2001). Clearly the relationship between the hot ISM, radiation from the central black hole, and outflows of relativistic plasma generated by nuclear activity is very complex.
In this paper, we present the results from two Chandra/ACIS-I observations and an XMM-Newton observation of X-ray emission from the ISM and from the radio lobes of Cen A. The primary goals of this work are to determine the thermodynamic state of the hot ISM in Cen A and to better understand the energetics and dynamics of the interaction between the relativistic plasma of the radio lobes and the X-ray emitting corona. In this paper, we present the temperature and surface brightness profile of the ISM, and discuss the nature of the X-ray enhancement associated with the southwest radio lobe. We demonstrate that it is unlikely that this enhancement is non-thermal in nature, but most likely originates from compression and shock-heating of the hot ISM via the supersonic expansion/inflation of the radio lobe. This is the fifth paper in our series on Chandra and XMM-Newton observations of Cen A. In four previous papers on Cen A, we presented results of a Chandra/HRC observation (Kraft et al., 2000), and results of the two deeper Chandra/ACIS-I observations on the X-ray point source population (Kraft et al., 2001), the X-ray jet (Kraft et al., 2002a), and complex morphology of the ISM (Karovska et al., 2002). Future publications will present an analysis and discussion of the spectrum of the active nucleus (Kraft et al., in preparation), a detailed comparison of high-resolution X-ray and radio observations of the jet (Hardcastle et al., in preparation), and a more detailed analysis of the morphology and dynamics of the hot ISM (Karovska et al., in preparation). This paper is organized as follows. Section 2 contains a brief summary of the observations and the instrumentation. Spectra and images of the ISM and the radio lobes are presented and discussed in sections 3 and 4, respectively. We end with a summary and conclusions in section 5. We use J2000 coordinates throughout the paper.
2 Instrumentation and Observations
Cen A was observed twice with the Chandra/ACIS-I instrument, on December 5, 1999 and May 17, 2000, and once with XMM-Newton on February 2, 2001. The observation times were 35856 and 36510 for the two Chandra, and 23060 with XMM-Newton with the medium optical blocking filter inserted. A summary of the observational parameters is contained in Table 1. Descriptions of the instrumental capabilities of the two observatories are presented elsewhere (Weisskopf et al., 2000; Chandra Proposers’ Guide, 2001; Jansen et al., 2001). The absolute position on the sky of the Chandra observations was determined by comparison of the X-ray point sources at the edge of the FOV with stars in the USNO catalog (see Kraft et al. (2001) for details). Then the absolute position of the XMM-Newton observation was determined by comparing the positions of X-ray point sources with Chandra positions. A considerable () correction was applied to the XMM-Newton set as a result. After correction, both data sets are aligned on the sky and with respect to each other to better than . We have generally relied on the XMM-Newton data for spectral analysis of extended low surface brightness features, but we have used the Chandra/ACIS-I data to determine the positions of point sources.
The Chandra raw event table was filtered to include only grades 0,2,3,4, and 6. All events below 0.4 keV and above 5 keV were removed. The response of the ACIS-I drops rapidly below 0.4 keV, so that most of the events below this are background. Above 5 keV, most of the events are either particle background events or events in the PSF wings from the bright nucleus. All events at node boundaries were removed because of uncertainties in grade reconstruction. All events with pulse-height invariant channel (PI) equal to 0, 1, or 1024 were removed as they represent unphysical signals; hot CCD columns and pixels were removed. Short-term transients due to cosmic rays which produced events in three or more consecutive frames that could mimic a point source (van Speybroeck 2000, private communication) also were removed. Data from the two observations were co-added to create images, but not for spectral analysis for two reasons. First, the focal-plane temperatures differed (-110∘C during the first observation, and -120∘C during the second). Second, differences in roll angles of the satellite and pointing directions between the observations resulted in the southwest lobe being placed along the edge of the I3 chip for the first observation and on the I0 chip close to the best focus of the telescope for the second. All images presented below were exposure corrected.
Data from all three CCD imaging spectroscopy instruments (EPIC/MOS1, MOS2, and the PN camera) from the XMM-Newton observation were used in this analysis. The EPIC/MOS events tables were filtered to include only events with patterns 0 through 12, and with the FLAG parameter less than or equal to 1. The EPIC/PN events tables were filtered to include only events with pattern 0, and with the FLAG parameter less than or equal to 1. All events with PI value greater than 12000 (i.e. energy greater than 12 keV) were also removed as the telescope has no response to X-rays above this energy. The data from MOS1 and MOS2, but not from the PN camera, were combined to create images as shown below. All spectral fits were done on the three data sets independently. Response matrices and ancillary response files were generated using the arfgen and rmfgen tools in the SAS software (). All spectral fitting (both Chandra and XMM-Newton) was performed using the XSPEC (V 10.0) software package. All exposure corrections made to the XMM-Newton were done using the exposure maps provided with the pipeline processed data.
Co-added, exposure corrected, adaptively smoothed X-ray images of Cen A from the Chandra and from the PN camera/XMM-Newton observations are shown in Figures 1 and 2, respectively. Radio contours (13 cm - Gaussian width of beam (RA) (DEC) taken with the Australia Telescope Compact Array (ATCA)) have been overlaid onto Figure 2. The nucleus, the jet NE of the nucleus and the two inner lobes of Cen A are clearly visible in the radio contours. The bright active nucleus, the jet, the diffuse emission from the ISM, and many point sources (mostly XRBs within Cen A) are clearly visible in the X-ray images. There is also an X-ray enhancement along the edge of the southwest radio lobe, and an excess of diffuse emission (above that of the ISM) in the interior of the lobe. The close alignment of the X-ray enhancement just at the edge of the lobe with the lowest radio contours strongly argues that they are related. No significant excess or deficit of emission (i.e. above or below that expected from the hot ISM) is detected in the vicinity of the NE radio lobe.
3 The Interstellar Medium
3.1 Data Analysis
To determine the temperature and radial surface-brightness profile of the coronal X-ray emission as a function of distance from the nucleus, it is necessary to exclude all of the emission from the point sources and to carefully estimate the background. The bulk of the emission from the ISM of Cen A is below 1 keV where XMM-Newton has considerably more effective area than Chandra/ACIS-I. For this and another reason described below, we rely primarily on the XMM-Newton data for determination of the parameters of the ISM. We used the Chandra data to determine the positions of the point sources, and then excluded a region of radius around these positions in the XMM-Newton data. The jet and southwest radio lobe also were excluded from all analysis of the ISM.
Careful background subtraction is critical to the accurate determination of spectral parameters and to the radial surface-brightness profile. In the central regions of the galaxy, the emission of the ISM is seen clearly above the background (see Figures 1 and 2). In our initial analysis, we attempted to use the standard background files that are available online for both Chandra and XMM-Newton. These turned out to be entirely inappropriate for two reasons. First, they are generated from several high galactic latitude observations and Cen A is located in the North Polar Spur (NPS) (l=309.52, b=+19.42). The intensity and spectrum of the XRB of the NPS region is considerably different than that at high galactic latitude (Garmire et al., 1992; Snowden et al., 1997). Second, the standard background files for XMM-Newton were created from observations using the thin optical blocking filter, and our observation was made with the medium optical blocking filter to avoid contamination from Cen A.
It is therefore necessary to use a locally determined background at the edge of the FOV. Unfortunately Cen A is so close to us that diffuse X-ray emission fills the entire FOV of both observatories. At the edge of the FOV, the surface brightness of the ISM is still a significant fraction (%) of the total (background+source) surface brightness. Fortunately, the background of both observatories below 1 keV is dominated by emission from the diffuse X-ray background (XRB), not charged particles, so that we could model the spatial variation of the background by the telescope vignetting function. The measured spatial variation of the background at low energies is somewhat flatter than what one would expect based on the vignetting. We have used the results of analysis of the low energy background in the PN camera to model this effect 111For further details on the XMM-Newton background, see .
Any region along the edge of the FOV contains both source and background, so it is therefore necessary to iteratively estimate the contributions from source and background at the edge of the FOV. We selected regions in the PN and MOS data 14′ NW of the nucleus and fit a four component model with two MEKAL plasmas plus a power-law with Galactic absorption (NH=71020 cm-2) and a neutral Al Kα line at 1.49 keV (an instrumental artifact), to model the background. The best-fit temperatures for the thermal components are consistent with previous measurements of the NPS (Snowden et al., 1997; Cawley, 1998). This model is an overestimate of the true background because it contains some flux from Cen A as well. Using this background, we then determined the temperature of the corona as a function of distance in five annular bins each wide centered on the nucleus. The parameterized background model, appropriately scaled for solid angle, was included in the spectral fitting as a fixed component. For the coronal emission from Cen A, we assumed a MEKAL model with depleted (Z=0.4) abundances and Galactic absorption. We performed the fits with the abundance as a free parameter as well, but at the temperature of the ISM ( 0.3 keV), the emission is line dominated and the continuum level poorly constrained. The abundance can be traded against the normalization and is thus poorly constrained. Except in the central bin where variable absorption from the dust lane hardens the spectrum, all fits indicate a temperature between 0.27 and 0.32 keV, with a small decrease as a function of distance from the nucleus. We note that the temperature probably does rise toward the center, but this is difficult to quantify because of the complex morphology due to the variable absorption of the dust lane.
We then computed the radial surface brightness profile of the coronal emission in the 0.4 to 1.0 keV band excluding all point sources, the jet, the southwest radio lobe, and subtracted the (overestimated) background described above. We fit a -model of the form
| (1) |
to the profile where is the surface brightness at the center of the galaxy, is the distance from the center of the galaxy, and and are parameters determined by fitting. The electron density is then given by
| (2) |
where is the central density. The central density can be computed from the surface brightness profile and the integrated luminosity. The luminosity within a radius is then given by (David et al., 1990)
| (3) |
where is the radiative cooling coefficient (ergs cm3 s-1), and are the central electron and proton densities, respectively, and is the distance along the line of sight in units of . The parameter is determined by a least squares fit to the radial surface brightness profile, and the normalization of the density profile, , is determined by converting the observed X-ray flux to luminosity using XSPEC and solving the integral in Equation 3. Throughout this paper, we have assumed that , which is appropriate for the sub-solar abundance plasma.
Because of the complex structure and variable absorption by the dust lane in the central of the galaxy, the parameter , the core radius from Equation 1, is not constrained. There is evidence that the temperature of the gas in the central of the galaxy is somewhat hotter than the outer regions, so the isothermal approximation is not appropriate. Even detailed deprojection analysis might not fully account for the complex three dimensional structure of the X-ray emission. We therefore decided to fix at 0.5 kpc () and fit the profile for between and from the nucleus. The parameters and are generally strongly coupled (David et al., 2001), but we are fitting the surface brightness profile in the region where it is well modeled by a power-law (i.e. ), so that is well constrained, and so is far from the nucleus. This last point is of particular importance in the discussion of the southwest radio lobe below.
The best-fit model was extrapolated to the position of the background region to determine the contribution of emission from Cen A in the background estimate. Approximately 30% of the flux in this region originates from the galaxy and is not true background. Using an appropriately reduced background, the radial surface brightness profile was recomputed. The radial surface brightness profile and the temperature profile using the iteratively determined background are shown in Figures 3 (PN camera only) and 4 (PN and MOS cameras, respectively. Implicit in the interpretation of the radial profile is that the temperature of the ISM in the background region is not significantly different than that closer to the galaxy. Beyond the central region of the galaxy, the temperature of the ISM is slowly decreasing with increasing radius, but we will assume a constant temperature of 0.29 keV in the analysis below.
The best-fit values of are 0.390.04 and 0.400.04 for the PN and MOS images, respectively. The fit was made between and from the nucleus to avoid complications due to variable absorption by the dust lane and the possible temperature rise in the central regions of the galaxy. The uncertainty in is dominated by uncertainty in the estimate of the background. The reduced of the fit is 2.1 and 1.8 for the PN and MOS cameras, respectively, indicating a marginal fit. This is due to the azimuthal structure in both the surface brightness (see Figure 2) and temperature (see discussion below). For the purposes of understanding the dynamics of the radio lobe discussed below, these variations are fairly large (up to a factor of 2 in surface brightness or 40% in particle density) but we will use the azimuthally averaged -model for estimates of the density and pressure of the ISM. The central density of the ISM for the assumed value of =0.5 kpc is =(3.710-2 cm -3.
We have performed a similar analysis on the Chandra data, but derive a higher temperature of about 0.4-0.45 keV. We determined the background in a similar manner to that described above using data from the S2 chip, and other than normalization, we derive similar spectral parameters from this background data set as we did from the XMM-Newton data. We believe that this temperature difference is caused by a combination of instrumental effects including: the low sensitivity of the ACIS-I instrument below 0.6 keV relative to the XMM-Newton cameras, the complex temperature structure in the ISM, systematic uncertainties in the low-energy quantum efficiency due to the build up of contamination (A. Vikhlinin, private communication) 222For further details, see the website for detailed discussion of the ACIS contamination, and to the complexities in the spatial non-uniformity of the gain of the ACIS-I instrument at low energies, and systematic uncertainties in the spectrum and normalization of the background.. We have adjusted the ARFs of the Chandra spectra of the ISM using the apply_acisbs script provided by the CXC and we still find temperatures which are systematically higher than XMM-Newton. We conclude that the ACIS-I instrument is not particularly sensitive to temperature determination for plasmas with temperature below about 0.5 keV. We rely on the results of the analysis of the Cen A ISM from the XMM-Newton data exclusively in the remainder of this paper. A 50% higher temperature for the Cen A ISM would change some of our final estimates of pressures, Mach numbers, etc., for the dynamics of the radio lobe, but none of our basic conclusions.
Motivated partly by the complex X-ray morphology apparent in Figure 2 and partly by the desire to confirm independently the results of the spectral fitting of the XMM-Newton data, we have created a temperature map of the MOS data using the technique described in Churazov et al. (1997). In this technique, images in five energy bands are created, and the bin size of each cell is adaptively chosen so that the signal to noise ratio is constant. Simulated spectra are created using XSPEC, and the temperature of each cell is determined via least squares fitting of the data to these spectra. The temperature map is shown in Figure 5. As can be seen from the figure, there is clearly azimuthal temperature structure in the ISM, but the average temperature of the ISM is about 0.3 keV. This independent analysis is consistent with the temperature derived on the basis of spectral fitting of the XMM-Newton data. Much of the complex structure of the ISM, particularly in the central of the galaxy and to the NW and SE of the nucleus (i.e. perpendicular to the axis of the radio components), is probably related to a recent galaxy merger and not due to interaction with the relativistic plasma of the jet and lobes. A preliminary discussion of this phenomenon has been presented elsewhere (Karovska et al., 2002). For our analysis below, we will use the azimuthally averaged radial surface-brightness and temperature profiles.
3.2 Gravitating Mass Distribution
The best-fit index to the surface brightness profile (see Table 2), =0.400.04 (the average of the MOS and PN values), is rather flat, but not inconsistent with recent Chandra observations of the hot ISM of NGC 4697 (Sarazin, Irwin, & Bregman, 2001), an isolated elliptical about twice as massive as Cen A, and other early-type galaxies observed with Einstein (Forman, Jones, & Tucker, 1985; Trinchieri, Fabbiano, & Canizares, 1986). There is clearly some azimuthal structure in the surface brightness profile, particularly to the NW of the nucleus, which is most likely related to a merger event with a small spiral galaxy (Karovska et al., 2002; Schiminovich et al., 1994).
Ignoring the surface brightness variations and assuming the gas is in hydrostatic equilibrium with the dark matter potential of the galaxy, the total gravitating mass within a radius of the nucleus is given by
| (4) |
where and are the radial distributions of the particle density and temperature, respectively (Bahcall & Sarazin, 1977; Fabricant, Lecar, & Gorenstein, 1980). Assuming that =const=0.29 keV, and the particle density is given by the model profile described in the previous section, the total gravitating mass as a function of distance from the nucleus is shown in Figure 6. For comparison, two measurements of the gravitating matter using planetary nebulae are shown as well (Hui et al., 1995; Mathieu et al., 1996). These two different measurements were made from the same data with different dynamical models. We find that within 15 kpc of the nucleus, the total mass of Cen A is 21011 M⊙.
3.3 Comparison of the X-ray Luminosities of the ISM and Point Sources
The unabsorbed X-ray luminosity of the ISM within 10 kpc of the nucleus in Cen A is 7.711039 ergs s-1 (0.4-1.0 keV band). This corresponds to an unabsorbed luminosity of 1.261040 ergs s-1 (0.1-10 keV band). As with the -model fit above, the uncertainty in these numbers is dominated by the uncertainty in the background subtraction. These numbers include an estimate of the effect of the variable absorption of the dust lane, and the slightly higher temperature of the central . The effect of the variable dust absorption was made by estimating an average absorption of the dust lane using the extinction map of Schreier et al. (1996). This was converted to an equivalent column density using the / ratio determined from dust scattering haloes by ROSAT (Predehl and Schmitt, 1995). A scale factor was then computed using this value of in PIMMS, the measured temperature of the central region, and the observed fraction of this inner region that is obscured by the dust lane. This X-ray luminosity is at the low end of the range of X-ray luminosities for galaxies with the optical luminosity of Cen A (=-20.4) (see Figure 2 of O’Sullivan, Forbes, & Ponman (2001)). If the radial-surface brightness profile does not steepen for a large distance beyond 10 kpc from the nucleus, this X-ray luminosity would only represent a lower limit as the total X-ray flux would be dominated by the outer regions of the galaxy.
The integrated X-ray luminosity of all XRBs within of the nucleus of Cen A with 1037 ergs s-1 (0.4 - 10.0 keV band) is 4.61039 ergs s-1 (Kraft et al., 2001). Assuming a 5 keV thermal bremsstrahlung spectrum for the XRB population with galactic absorption, this corresponds to an (absorbed) X-ray luminosity of 6.41038 ergs s-1 in the 0.4 - 1.0 keV band. The shape of the X-ray point-source luminosity function (LF) below 1037 ergs s-1 is somewhat uncertain because this is the approximate flux below which the observations are complete and unbiased, but unless the LF again steepens below 1036 ergs s-1, the integrated X-ray luminosity of sources with 1037 ergs s-1 contributes at most an additional few tens of percent to the total X-ray luminosity of the point sources. Below 1 keV, the XRBs contribute only 10% of the integrated X-ray flux. At higher energies, the XRBs contribute a significant fraction of the total X-ray emission.
4 The Radio Lobes
4.1 Imaging and Spectral Analysis
One of the remarkable features shown in Figures 1 and 2 is the X-ray enhancement coincident with the southwest radio lobe. The relationship between the X-ray and radio emission of the SW lobe is more clearly shown in Figure 7, which contains a raw Chandra image in the 0.5-2.0 keV band with 13 cm contours overlaid. The boundary of the X-ray shell is highlighted by arrows. The bright X-ray enhancement is clearly visible along the edge of the radio lobe and appears to be contained within the lobe, although the X-ray emission clearly lies beyond the NW and SE radio contours. We argue that most or all of the X-ray enhancement actually lies beyond the boundaries of the radio emission for two reasons. First, the lobe is not in the plane of the sky (see below) and we are seeing the features in projection. Second, the radio map has been considerably broadened by the restoring beam, and the bulk of the radio emission is therefore interior to the X-ray emission.
The diffuse structures of the X-ray shell are more clearly shown in Figure 8, which contains an adaptively smoothed, exposure corrected Chandra image of the southwest radio lobe in the 0.5-2 keV band with the 13 cm radio contours overlaid. There are significant differences between the X-ray and radio morphologies for the emission that is clearly interior to the lobe (Figure 8). The surface brightness of the X-ray emission in this region varies by a factor of four. The radio contours decrease monotonically from the center to the edge of the lobe, whereas the X-ray emission shows several significant peaks and valleys not seen in the radio.
We have divided the southwest lobe into two regions for spectral analysis to determine if there is any spectral difference between the emission along the southwest edge of the radio lobe and the emission that lies within the boundaries of the lobe. The first region, which we refer to as the enhancement, is a rectangular region along the southwest edge of the radio lobe. The second region, which we refer to as the diffuse region, is a rectangular region in the interior of the lobe. The details of these regions are summarized in Table 3. Region 1 is the region along/beyond the southwest radio lobe and referred to as the enhancement region in the text. Region 2 is a region covering lobe emission but excluding the bright foreground object, and referred to as the diffuse region in the text. The RA and DEC are the coordinates of the center of the box, the Roll is the rotation angle anti-clockwise from north, and the dimensions of the box are given by the width and length. The regions are shown graphically on the temperature map in Figure 5.
Unfortunately, the XMM-Newton observations were aligned such that the MOS chip gaps were placed directly along the enhancement, and one of the PN chip gaps was placed along the western edge of the lobe. The diffuse region does not intersect any of the gaps and provides a consistency test among all the data sets, which avoids uncertainties due to event filtering of events near chip boundaries or in the computation of the appropriate response matrices. The shapes and positions of these regions were chosen to avoid contamination from the bright source CXOU J132507.5-430401, which is believed to be a foreground star (Kraft et al., 2001). A second point source, CXOU J132509.6-430530, located within the enhancement region, was also excluded. Two background regions for each data region were chosen to the W and the NW of the nucleus at similar distances from the core as the source regions. These background regions were selected because they are devoid of point sources in the Chandra images.
For both regions in the lobe, all five data sets (two Chandra and three XMM-Newton) were fit with an absorbed power-law, and one- and two-temperature MEKAL thermal plasma models in the 0.3 to 5.0 keV band. The lower limit was fixed at 0.3 keV because below this energy the XMM-Newton response is somewhat uncertain, and the ACIS-I instrument has little response. Above 5.0 keV, the source flux falls, and the instrumental background and contamination from the bright, heavily absorbed nucleus become increasingly important. We intially performed the fits with the column density, , and the elemental abundance (for thermal models) as free parameters. It was found that best-fit column density was always consistent with the galactic value (71020 cm-2 (Stark et al., 1992)). The elemental abundance was poorly constrained because of the relatively high temperature. We therefore decided to fix the column at the galactic value and the elemental abundance at 0.4 times solar.
The results of the spectral fits are summarized in Table 4. All fits were done independently, and all data were binned to a minimum of 30 counts per bin. All errors are 90% confidence for one free parameter. The rate is the background subtracted count rate in units of 10-2 cts s-1. The indication in the error column signifies that that parameter is not meaningfully constrained. The parameter in the two temperature MEKAL model fits is the ratio of the best-fit emission measures. This parameter demonstrates that even in the cases where a second temperature component improves the fit, the emission measure of the lower-temperature component is small and that this second component contributes negligibly to the pressure. No parameters of the Chandra spectral fits of region 2 are included as the parameters are not constrained in a useful way due to the low surface brightness. The XMM-Newton spectra have several times the number of counts that the Chandra spectra have, and the XMM-Newton fits are generally better (lower ) and have smaller error bars. We therefore use the XMM-Newton fits to determine the spectral parameters (i.e. the temperature or power-law index), and use the Chandra result as an independent confirmation. As can be seen from Table 4, the thermal and the power law models both provide an adequate description of the data. There is no reason to favor one model over the other on the basis of spectral fitting alone.
For reasons we outline below, however, the thermal model is more physically plausible. The addition of a second thermal component to the MEKAL fits generally improves the quality. We attribute this to a complex temperature distribution within this feature. It could indicate some spatial non-uniformities in the distribution of the hot ISM around Cen A, but we consider this less likely. The temperature of this second component is generally poorly constrained. Although the addition of a second temperature component improves the fits, this component is roughly an order of magnitude lower in temperature and a factor of a few lower in emission measure than the hotter component. This second component contributes little to the pressure of this feature.
Given the spectral similarity between the ‘enhancement’ region and the ‘diffuse’ region, we will treat the entire lobe as a single feature and make no distinction between the emission interior to the lobe and the enhancement along the edge. There is some marginal evidence (see Table 4) that the temperature of the material that appears to be interior to the lobe is somewhat cooler ( 10%) than that along the edge enhancement. This is what one would expect for the supersonic lobe expansion model, our preferred model, but for simplicity we will ignore this small difference in the discussion below. We will use the results of the single-temperature fits of the enhancement region for all estimates of density and pressure when discussing the thermal model. Because of complications in the point-source removal and the unfortunate alignment of the chip gaps in the XMM-Newton data described above, the conversion of X-ray flux to particle density was determined by using the spectral parameters of the XMM-Newton data, but the count rate from the second (OBSID 00962) Chandra/ACIS-I observation for the entire lobe. We determined the count rate in the Chandra data set in a radius circle centered on the X-ray lobe in the 0.5 to 2.0 keV band with all point sources removed. Background was estimated from an identical region approximately the same distance from the nucleus with all point sources removed as well. Assuming a temperature of 2.88 keV (the average of the eight single-temperature MEKAL fits in Table 4), the observed Chandra/ACIS-I count rate (7.5410-2 cts s-1 in the 0.5 to 2.0 keV band) corresponds to a flux of 9.610-13 ergs cm-2 s-1 (unabsorbed) in the 0.1 to 10.0 keV band, and an X-ray luminosity of 1.411039 ergs s-1 at the distance of Cen A.
4.2 Interpretation
X-ray emission from the jets, hotspots, and radio lobes of radio galaxies has been detected from several dozen sources with Chandra (Worrall, Birkinshaw, & Hardcastle, 2001; Hardcastle, Birkinshaw, & Worrall, 2001; Harris et al., 2000; Brunetti et al., 2002). In most of these cases, the X-ray emission has been attributed to non-thermal process (i.e. inverse-Compton scattering of a variety of seed photons or synchrotron radiation) from a population of relativistic electrons (Harris & Krawczynski, 2002). Although we cannot formally reject a non-thermal hypothesis for Cen A on the basis of the spectral analysis alone, physical arguments outlined below lead us to the conclusion that the X-ray emission from the southwest radio lobe of Cen A is most likely thermal in origin. The interaction between the southwest radio lobe and the X-ray enhancement of Cen A is most likely to be more closely analogous to the radio plasma/ICM interactions recently observed by Chandra in early-type galaxies (Finoguenov & Jones, 2001; Jones et al., 2002) and clusters of galaxies (McNamara et al., 2000; David et al., 2001; Fabian et al., 2000; Blanton et al., 2001) than to non-thermal sources of X-ray emission. Cavities and X-ray shells created by the inflation/expansion of ‘bubbles’ of radio plasma in the ICM of galaxy clusters have been investigated theoretically by several authors (Reynolds, Heinz, & Begelman, 2001; Brüggen et al., 2002). These ’bubbles’ are thought to be the backflow material from the propagation of the powerful jets of radio galaxies through the ISM/ICM. The ’shells’ of enhanced X-ray emission are due to the compression and shock heating of the ambient ISM/ICM after it passes through the bow shock. The Cen A X-ray enhancement around the southwest radio lobe appears to be the visible result of a smaller-scale, lower-power (FR I jet and galactic ISM vs. FR II jet and ICM) example of this radio plasma/thermal gas interaction.
We consider in detail three possible models for the origin of the X-ray enhancement around the southwest radio lobe, two non-thermal and one thermal. First, we address the possibility that this emission is due to inverse-Compton scattering from the relativistic electrons of the radio lobe. The most significant source of seed photons is from the CMB, but unless the lobe is far from equipartition, it is unlikely that a significant fraction of the X-ray emission originates from this mechanism. Second, we investigate the possibility that the emission is synchrotron radiation from a population of ultra-relativistic electrons in the radio lobe. Because of the short lifetime of these particles, we reject this hypothesis as well. Finally, we explore the possibility that the emission originates from a thermal plasma that surrounds the radio lobe. In this model, which we consider the most plausible, the expansion of the lobe, energized by the counter jet, has compressed and shock-heated the ambient hot ISM. A partial shell or cap of plasma surrounding the lobe and rotated with respect to our line of sight would naturally give the edge brightened appearance.
4.2.1 IC scattering of CMB photons
First, we consider the possibility that the X-ray emission is due to inverse-Compton scattering of CMB photons off radio-synchrotron-emitting relativistic electrons. There are several significant problems with this model, given the observed morphology and spectrum, that make it implausible. First, the spatial morphology of the X-ray emission argues strongly against this model. The most prominent part of the detected X-ray emission, the enhancement ahead of the lobe, has no detected radio counterpart down to at least a frequency of 327 MHz (Slee et al., 1983). The IC-scattering hypothesis would require a large population of low-energy (2000) electrons without any extension to higher, observable energies. The ratio of X-ray to radio flux in the interior of the lobe and along the enhancement are significantly different, therefore implying a significant difference in the non-equipartion conditions or energy spectral index of the relativistic electrons in these regions. The synchrotron frequency for the electrons responsible for the IC scattering of the CMB photons into the X-ray band is 80 MHz assuming the equipartition magnetic field of 13 (Burns, Feigelson, & Schreier, 1983). Emission at this frequency from the narrow shell would be difficult to detect, but there is no plausible reason to expect that there is a large population of 2000 electrons while the presence of 104 electrons is ruled out by the lack of detection of the shell by the VLA or the ATCA.
It is conceivable that a significant fraction of the diffuse emission in the interior of the lobe is due to IC scattering of CMB photons, and that the enhancement along the edge of the lobe originates in a different mechanism. Such IC scattered X-ray emission has been observed in the radio lobes of several powerful radio galaxies (Feigelson et al., 1995; Tashiro et al., 1998; Hardcastle et al., 2002). To investigate the importance of this mechanism, we used the code of Hardcastle, Birkinshaw, & Worrall (1998) to determine the magnetic field strength that would be necessary to produce the observed X-ray flux density given the known radio source properties. We modeled the electron spectrum in the lobe as a power-law of the form with , and a value of determined by the radio data at 2.3 and 8.4 GHz. We measured the X-ray flux density (82 nJy at 1 keV) from a circular region in radius covering most of the outer or southern half of the radio lobe, but excluding the enhancement along the edge of the lobe. The X-ray background was estimated from a region of the observation away from the lobe but at approximately the same distance from the nucleus. We find that the magnetic field must be an order of magnitude below the minimum-energy value (determined assuming a tangled field in the lobes) of 20 G, if the IC process is to produce all of the observed X-ray emission from this region. This is a much larger departure from equipartition than is observed in other sources. If instead the magnetic field strength has its equipartition value, the IC process can produce only % of the observed X-rays.
Other sources of seed photons are even more implausible than the CMB. The synchrotron-self Compton (SSC) mechanism can be rejected immediately as the density of radio photons is lower than that from the CMB. Optical photons from either the nucleus or the stellar component are two other possibilities. Both are unlikely. In the unified model of AGN, Cen A, as an FR I galaxy, is considered to be a misdirected BL Lac (Urry & Padovani, 1995). In this case, there may be a considerable flux of beamed optical photons emitted from the nuclear region (Fossati et al., 1998). To upscatter optical photons into the X-ray band, the electrons must have . The typical optical luminosity of beamed photons from an FR I radio galaxy/BL Lac is 1042 ergs s-1 (Padovani & Urry, 1991; Chiaberge, Capetti, & Celotti, 2001; Hardcastle & Worrall, 2000). If all of these photons are emitted from the nucleus into the solid angle subtended by the southwest radio lobe, the energy density at the edge of the lobe is 10-13 ergs cm-3. It would require approximately 31062 electrons with 100 to produce the observed X-ray luminosity via IC scattering. The total energy of these electrons, , is 1059 ergs, several orders of magnitude larger than the equipartition energy of the lobe. Assuming they are distributed uniformly throughout the outer or southern half of the radio lobe, the pressure of these relativistic electrons would be 310-8 dynes cm-2, several orders of magnitude larger than the equipartition pressure of the lobe. The existence of such a large number of relativistic electrons is improbable. The energy density of optical starlight at the edge of the lobe is of the same order of magnitude as that estimated for the beamed nuclear source (Feigelson et al., 1981). We therefore reject the IC scattering hypothesis.
4.2.2 Synchrotron Radiation
X-ray synchrotron emission has been detected from a number of low-power jets by Chandra, and may be a common feature of these jets (Worrall, Birkinshaw, & Hardcastle, 2001). Such a model was invoked to explain the X-ray emission associated with the forward jet of Cen A (Feigelson et al., 1981; Kraft et al., 2002a). The main difficulty with a synchrotron model in the context of the Cen A radio lobe is, however, the short lifetime of the particles. Defining the lifetime of the particles as the timescale for the upper synchrotron cutoff frequency to become equal to the observing frequency, the particles will lose their energy on the order of tens of years in the equipartition magnetic field (Burns, Feigelson, & Schreier, 1983). For comparison, the light travel time across the lobe is approximately ten thousand years. This would imply that the particles must be re-energized hundreds or even thousands of times in the process of traveling through the lobe.
The X-ray and radio knots in jets are commonly thought to be the sites of shocks where particle reacceleration occurs. No such knotty structure is seen in the X-ray surface brightness of the radio lobe (Figure 1). At the resolution of Chandra, the forward jet has a complex morphology on scales from tens of parsecs to kiloparsecs (Kraft et al., 2002a). No such structure is seen in the X-ray morphology of the southwest lobe. It is conceivable that there are thousands of small-scale knots which are unresolvable with Chandra but give the appearance of more or less uniform emission in the interior of the lobe. We consider this unlikely in the absence of a distribution which includes large knots. The X-ray morphology strengthens this argument. The projected length of the X-ray enhancement along the edge of the lobe is quite small (100 pc) compared with the size of the lobe. It is difficult to see how a synchrotron model with thousands of unresolved knots would produce such a sharp, well defined feature exactly along the edge of the radio lobe. Finally, if the X-ray emission were due to synchrotron radiation, the enhancement at the edge of the lobe would be marginally detectable in the optical unless the spectrum flattens significantly between the X-ray and optical. Such a feature has not been seen.
4.2.3 Thermal plasma
As a third scenario, we consider the possibility that the emission originates in a partial shell or cap of thermal plasma that surrounds the radio lobe. We suggest that little or none of the emission originates within the lobe, and that the lobe is surrounded by a shell of plasma. All of the X-ray emission that appears to be within the lobe actually originates in a sheath or cap of hot plasma that surrounds the lobe. That is, the emission that appears to be within the lobe is actually in front of and behind the lobe along our line of sight. Emission from a thin cap of plasma rotated to our line of sight would appear as an edge-brightened shell and thus could take on the morphology of the detected emission.
It is reasonable to expect that the southwest radio lobe and the surrounding plasma shell are rotated to our line of sight at a complementary angle to that of the forward jet. Various estimates have been made of the angle to the line of sight of the forward jet, and all are highly uncertain. The most recent estimate of 50∘-80∘ is based on the VLBI brightness ratio of the milliarcsecond forward jet and the counter jet (Tingay et al., 1998). Other estimates typically range from 55∘-70∘ (Graham, 1979; Dufour et al., 1979; Skibo, Dermer, & Kinzer, 1994; Jones et al., 1996). In this work, we will assume a value of =60∘ for the angle between the forward jet and the line of sight, the angle between the counterjet/southwest radio lobe is therefore =120∘. None of our results or conclusions is sensitive to this choice.
We calculated the surface brightness from an optically thin plasma shell of uniform density rotated at an angle =115∘ to our line of sight with inner radius and outer radius , where is the radius of the lobe, and is the thickness of the X-ray emitting shell. This calculation is important for estimating the volume, and therefore the density, of the shell as described below.
The parameter can be approximately measured from the width of the radio lobe in a direction perpendicular to the counter jet direction. The parameter can be estimated by measuring the thickness of the enhancement along the direction of the counter jet. The Chandra OBSID 00962 data were used for this measurement because the lobe is close to the best focus of the telescope so that broadening of this feature by the telescope PSF is insignificant. The image of the lobe in this observation is considerably sharper than in the OBSID 00316 observation, where the lobe is positioned at the very edge of the FOV. We find the enhancement width to be (FWHM) on the sky by fitting a Gaussian plus second-order polynomial (to account for background and/or more extended emission in the interior of the lobe) to the peak. The effect of projection on the sky was then removed by comparing the measured width with the simulated width for a range of parameters . For our assumed counterjet angle (=120∘), we estimate a compression of approximately 8:1 (i.e. =0.875) based on a comparison of the measured width of the projected enhancement with that in our calculated images. The radius of the radio lobe is , so the deprojected thickness of the shell is 16.6′′ or 281 pc. Note that this observed compression ratio is consistent with the expected distance between the bow shock and the contact discontinuity if the lobe is expanding supersonically (Alexander, 2002; Nulsen et al., 2002).
We have based our estimate of the volume primarily on the width of the enhancement along the edge of the lobe. The sides of the shell in our preferred scenario will probably be thicker than at the enhancement along the leading edge of the lobe. Systematic uncertainty in the thickness of the shell or oversimplifications of the assumed geometry will not change any of our general conclusions about the nature of the shell. The particle density as a function of the compression parameter is given by
| (5) |
and is therefore not a strong function of the assumed thickness of the shell (unless the shell is much thinner than we have assumed in which case the density would be even higher). If the material were uniformly distributed throughout the entire southern half of the lobe, the shell density would only be a factor of two smaller. Given the uncertainty in , we estimate the uncertainty on the volume to be on the order of 30%.
In Table 5 We summarize the temperatures, the densities, and the pressures of the emission in the shell, the ISM, and of the radio lobe (equipartition pressure from the middle of the SW lobe taken from Burns, Feigelson, & Schreier (1983)). As can be seen from the table, the shell is greatly overpressurized relative to both the ambient ISM and the radio lobe, and the lobe is greatly overpressurized relative to the ISM. We infer that both the lobe and the shell must be expanding supersonically (relative to the ISM) and that the shell is confined by the ram pressure of the expansion. We hypothesize that the shell of hot plasma around the lobe is the result of the advance of an unseen, supersonic (and possibly now extinct) counter jet and the displacement and compression of the ISM as the radio lobe inflates. The current existence of a counter jet is not necessary, only that it existed sometime in the past to initiate the flow. The overpressurization and thin extent of the shell require the expansion to be supersonic because otherwise the shell would have dissipated on a time scale smaller than the expansion of the lobe. In particular, the sharp boundary of the shell would dissipate in a timescale much smaller than the expansion of the lobe if the expansion were subsonic or transonic. If this shell is indeed due to the supersonic expansion of the radio lobe into the ISM, the simplest interpretation of the thermodynamic properties of the gas would be that we are directly observing the bow shock across which the Rankine-Hugoniot (RH) conditions are formally met (Landau & Lifschitz, 1990; Spitzer, 1998). In our case, however, we cannot be directly observing the bow shock because the density contrast between the shell and the ISM is considerably larger than the factor of 4 (for =5/3) expected for a strong shock.
Our scenario is a bit different than a shock wave propagating into a uniform density medium however. Both the gas density and pressure of the ISM are falling rapidly () as the lobe expands away from the nucleus, and the lobe/shell system may be expanding self-similarly. Such a scenario has been investigated theoretically by several authors in the context of much more powerful FRII jets propagating through the ICM of clusters of galaxies (Clarke, Harris, & Carilli, 1997; Heinz, Reynolds, & Begelman, 1998; Kaiser & Alexander, 1999; Reynolds, Heinz, & Begelman, 2001; Alexander, 2002). If the density gradient of the ICM is steep enough, the density contrast between the shocked shell and the ambient ISM/ICM will be considerably larger than that expected on the basis of the RH conditions (Heinz, Reynolds, & Begelman, 1998; Kaiser & Alexander, 1999). It will appear as if the gas was further compressed as it crossed the bow shock. In fact, the thermodynamic state of the gas in the shell depends on its past history as it expanded through the denser regions of the ICM. We suggest that such a model can explain the observed X-ray emission around the southwest radio lobe of Cen A. We note that this problem has some similarities with that of a supernova explosion expanding into the ISM (Sedov, 1959; Chevalier, 1974; Spitzer, 1998).
A detailed hydrodynamic simulation is required to fully interpret and understand this phenomenon and will be the subject of a future paper, but we can make some general quantitative statements about the evolution and energetics of the lobe. We have created a four-region model of this system as shown in Figure 9 in the rest frame of the lobe. Region 1 is the radio lobe, region 2 is the X-ray shell, region 3 is a thin, hot boundary layer between the ISM and the X-ray shell where the RH conditions are met, and region 4 is the ISM. The subscripts 1,2,3, and 4 will be used to denote the thermodynamic variables and the thicknesses of each region. The lobe is expanding into the ISM with velocity vexp=v4. We assume that the lobe is expanding supersonically into the ISM so that the RH shock conditions apply across the interface between regions 3 and 4 (i.e. vexp=v where is the sound speed in region 4). We make the further assumption that region 3 is thin compared to the other regions (i.e. ) so that the observable emission from the shell is dominated by region 2. Under these assumptions, we can determine the thermodynamic state of the gas in region 3 and estimate the expansion velocity of the lobe.
The temperatures, pressures, and densities of the gas in regions 2 and 4 are known on the basis of the X-ray spectral analysis presented above. Since the RH conditions apply across the interface between regions 3 and 4, the density and velocity in region 3 are given by 6.810-3 cm-3 and vv3. Balancing the thermal pressure of the gas in region 2 with the thermal and ram pressure of the gas in region 3, 6.5 keV. Region 3 therefore represents a region of high temperature between the visible X-ray shell and the ISM. Given the high temperature and low density (relative to region 2), region 3 is in practice indistinguishable and/or unobservable in the Chandra/XMM-Newton band. The ratio of the temperature of the ISM to that of the boundary region is given by (Landau & Lifschitz, 1990)
| (6) |
where is the Mach number of the lobe expansion into the ISM (i.e. vexp/). We find an expansion velocity for the lobe of approximately Mach 8.5, or 2400 km/s. This confirms our assumption in the previous paragraph that the lobe is expanding supersonically into the ISM and the RH shock conditions are appropriate. This analysis implicitly assumes that the lobe and the bow shock are expanding at the same velocity. If we add an additional constraint and force the lobe/bow shock expansion to be self-similar, the derived shock temperature would be somewhat higher (8 keV).
The pressure of the plasma in the shell (region 2) is an order of magnitude larger than the equipartition pressure of the radio lobe (region 1). It is reasonable to Assume that these two components are in approximate pressure equilibrium. This implies that there must be an additional component providing pressure support in the radio lobe, perhaps protons or lower energy electrons, for the shell not to destroy the lobe on the sound crossing time. Such large deviations from the equipartion conditions have been inferred for other radio sources (Hardcastle, Birkinshaw, & Worrall, 1998), but not on such small scales as we see in Cen A.
The temperature between the shock temperature (6.5 keV) and the measured temperature of the gas (2.9 keV) in the shell indicates that there must be significant cooling in the shell as the material flows away from the bow shock. Neither radiation nor thermal conduction are likely to be important. The radiative timescale for the material in the shell is on the order of 108 yrs, whereas the dynamical timescale of the lobe is on the order of 106 yrs. Therefore radiative cooling cannot be significant. Likewise, the timescale for thermal conduction to the ISM must be longer than the dynamical timescale because the boundaries of the shell are sharp. This, and the inferred adiabatic evolution of the shell described below, imply that the thermal conductivity in the shell and between shell and the ISM is considerably lower than the canonical value of Cowie & McKee (1977). A similar suppression of transport processes has been observed in the ICM of galaxy clusters (Vikhlinin, Markevitch, & Murray, 2001). Thermal conduction between the shell and the relativistic plasma in the radio lobe would heat the shell, not cool it. The only other possibility is adiabatic expansion. Assuming that the lobe and shell expand self-similarly, the volume of the shell increases as the lobe inflates so that the temperature of the gas must decrease.
The adiabatic evolution of a shell of shocked gas created by the supersonic inflation of a radio lobe in a -model atmosphere has been studied by Alexander (2002); see also Dyson, Falle, & Perry (1980). As the lobe and shell expand self-similarly, new material is constantly added to the shell, but the material currently in the shell cools adiabatically as the volume of the shell increases. Alexander (2002) finds that if the density of the atmosphere into which the lobe/shell is expanding falls faster than , a temperature and density gradient between the bow shock and the contact discontinuity will be formed with the coolest material lying just above the contact discontinuity. This material will have the largest X-ray emissivity, so that the spectral parameters we derive are representative of this region of the shell. This scenario is therefore qualitatively consistent with our inferred temperature gradient between the shock temperature () and the temperature of the shell (). Using the formalism of Alexander (2002) and assuming (see Section 3.1), their model predicts a factor of 1.4 temperature difference between the material along the contact discontinuity and that just behind the bow shock. A larger temperature gradient would be created if the value of were larger, but the lobe must have progressed through an atmosphere with a steeper density gradient ( with 1.7-1.8) to account for the observed temperature gradient. Given the formal uncertainties in the thermodynamic parameters and assumptions (i.e. uniform density and temperature of the shell, using the average -model to describe the ISM when there are large azimuthal asymmetries in the surface brightness, the unknown temporal history of the jet powering the lobe, the complex environment within 2 kpc of the nucleus and possible complications due to cold or warm gas remaining from the merger, etc.) we do not consider the discrepancy between the predicted and measured density gradient to be significant.
If the material in the shell is to behave adiabatically, the thermal conduction must be effectively suppressed. The heating timescale, , of the material in the shell is given by (Cowie & McKee, 1977; Alexander, 2002)
| (7) |
where is the sound crossing time of the shell, is the thickness of the shell, is the electron mean free path, and is the suppression factor. For the shell around the SW radio lobe, the canonical heating timescale (=1) is 2105 yrs, approximately an order of magnitude less than the dynamical timescale of the lobe. Therefore, the thermal conductivity must be suppressed by a factor of 100 or more for the shell to remain adiabatic and support the inferred temperature gradient. The swept up magnetic field, while not dynamically important in the shock for reasonable assumptions of the ambient field strength, could effectively suppress thermal conduction in the shell if shear flows are present in the shell (e.g. if the shell is advancing more rapidly radially than laterally).
We have made a consistency check on this analysis by comparing the mass of material in the shell with the mass of the ISM in the region swept out and currently occupied by the lobe. The total mass of material in the shell is =3.2106 . We estimate the mass of the ISM displaced by the expansion of the lobe by integrating the -model in a piecewise fashion (i.e. = const for and for ) over the conical region currently occupied by the lobe and find 2106 . To order of magnitude, the mass in the hot shell is consistent with material swept up from the ISM.
One parameter commonly used to distinguish shock-heated, supersonically compressed gas from adiabatically, subsonically compressed gas is the specific entropy, . For shock-heated gas, the specific entropy will increase whereas there will be no change for adiabatically compressed gas (Landau & Lifschitz, 1990). Using the values from Table 5, the ratio of specific entropies of the shell and the ISM at the edge of the shell is approximately unity. As described above, however, the current thermodynamic state of the shell depends on the past history in a complex way. It is probably more relevant to compare the current state of the shell with the density (and temperature) of the ISM at a smaller distance from the nucleus. This would imply that the specific entropy of the shell is indeed larger than that of the gas and provides additional support for shock heating of the shell.
As an alternative to the shock-heating of the hot phase of the ISM, we consider the possibility that much cooler gas has been shock-heated by the supersonic expansion of the lobe. Considerable amounts of cold gas (i.e. neutral or molecular, K) are present in Cen A, likely because of the merger with the spiral galaxy, although this gas is distributed unevenly. The HI observations of van Gorkom et al. (1990) and Schiminovich et al. (1994) detected 8108 of neutral hydrogen aligned along the dust lane (i.e. perpendicular to the jet). This mass estimate is actually a lower limit because the mass in the central 2.5 kpc is uncertain due to absorption. There is enough cold gas present in Cen A to account for the mass in the shell if only a small fraction (1%) of it was swept up and heated by the lobe.
The total mass of warmer (104-5K) gas in Cen A is more uncertain. UV observations of more massive early-type galaxies have placed a lower limit on the mass of ionized gas of 106 (Trinchieri & Di Serego Alighieri, 1991; Trinchieri, Noris, & Di Serego Alighieri, 1997). This estimate relies on a highly uncertain filling fraction and is only an order of magnitude estimate at best. Unless this is a considerable underestimate, however, this mass of ionized material is probably not sufficient to account for the material in the shell in Cen A. The spiral galaxy may have had a considerable warm ISM component if it were similar to the Milky Way, so that the amount of warm gas in Cen A may be much larger than is typical for massive, early-type galaxies. In either case, the final temperature of the gas in the shell depends only on the expansion velocity of the lobe, so that whether the shocked material originates in the coronal gas or in cooler gas, the implied expansion velocity of the lobe remains unchanged.
4.3 Discussion
4.3.1 Dynamics of Jets and Radio Lobes
The conventional paradigm suggests that the jets of FR I galaxies like Cen A are expanding subsonically into the surrounding medium, whereas the lobes of the more powerful FR II galaxies are expanding supersonically (Icke, 1992). The existence of the shock-heated shell around the southwest radio lobe implies supersonic expansion which runs counter to this prevailing view. This suggests either that Cen A is different than most of the other well studied FR I galaxies, or that its proximity allows us to observe details that are not readily observable in more distant objects and the standard paradigm is therefore incorrect. The radio power of Cen A (=1.851024 W Hz-1 (Cooper, Price, and Cole, 1965)) is comparable to those of well-studied FR I radio galaxies from the 3C sample. Cen A is in some ways, however, not a typical FR I object even though it is often referred to as the prototypical object of the class. The jet/lobe morphology of Cen A is clearly different than the ‘tailed twin jet’ morphology (Leahy, 1993) commonly associated with objects like 3C 31 (Hardcastle et al., 2002; Laing & Bridle, 2002) and 3C 449 (Feretti et al., 1999). The multiscale structure of Cen A also makes it distinct from the more common bridged twin jet FR I sources such as 3C 296 (Leahy and Perley, 1991). One the other hand, if Cen A were at a distance comparable to these other FR I galaxies (100 Mpc), the X-ray cap around the SW radio lobe would be virtually undetectable. The larger scale radio components of Cen A (e.g. the Northern Middle Lobe) are likely to be evolving subsonically (Saxton, Sutherland, & Bicknell, 2001).
It is interesting that the X-ray morphology of the NE radio lobe is so different from the SW lobe. Based on a preliminary examination of our AO-3 ACIS-S observation of Cen A, there is some evidence for a partial shell around the NE lobe, but with an X-ray luminosity more than two orders of magnitude less than the shell around the SW lobe. These X-ray morphological differences aren’t too surprising given the very different radio morphologies of the NE (edge brightened on one side) and southwest (center filled with filamentary structure) lobes. This argues that the nature of the flows on kpc scales to the NE and southwest are fundamentally different, and in particular that the environment must play a key role in the appearance of the jets and lobes and in the overall dynamics of the flow. There are larger scale asymmetries in the radio emission from Cen A as well (Morganti et al., 1999), so that the past history of the radio source may play a key role in its current appearance.
Prior to the launch of Chandra, X-ray shells associated with the lobes of radio galaxies had been detected in only two objects, Perseus A (Böhringer et al., 1993) and Cygnus A (Clarke, Harris, & Carilli, 1997). Since the launch of Chandra, many additional examples of the interactions between the ICM and the jets of radio galaxies have been detected (Churazov et al., 2001; Finoguenov & Jones, 2001; McNamara et al., 2000; David et al., 2001; Fabian et al., 2000; Blanton et al., 2001). In all of these cases the shells are cooler than the surrounding ISM, in contrast to what we have observed with Cen A. In these other objects, radiative cooling may be important, but it is more likely that the cool shells are due to entrainment of lower temperature gas from the central regions of the galaxy or cluster by the inflation of lobe. It is clear that the nuclear activity can have an important effect on the galactic or cluster environment, and it is quite likely that the reverse is true as well.
4.4 Relationship between Nuclear Activity and Cooling Flows
This observation of the southwest radio lobe of Cen A provides the first clear demonstration of the complex relationship between the hot ISM of early galaxies and nuclear outflows from supermassive black holes at their centers. Other recent Chandra observations have hinted at such a relationship (Jones et al., 2002), but we believe that this is the first definitive example where the nuclear outflow is providing sufficient energy to heat the ISM. The total thermal energy of the gas within 15 kpc of the nucleus is 1.81056 ergs if one assumes the gas is isothermal with a temperature of 0.3 keV. This is actually an underestimate because the temperature rises somewhat in the central 2 kpc, but is accurate enough for our order of magnitude comparison. The total thermal energy of the gas in the shell around the southwest radio lobe is 4.21055 ergs, a significant fraction of the energy in the ISM. In its current configuration, the energy of the shell is a few tens of percent of the total energy in the hot ISM, and additional energy will be deposited in the ISM as the lobe continues expanding.
The ultimate fate of the gas (and energy) in the shell is not clear. It is possible that plasma in the shell will eventually come back into thermal equilibrium with the ISM and settle back into hydrostatic equilibrium with the gravitating dark-matter potential, effectively heating the ISM. On the other hand, the highly supersonic expansion of the lobe could drive the heated plasma completely out of the galaxy into the Cen A group, or even out of the group into the IGM. The temperature of the gas in the shell is also much too large to be gravitationally bound to a galaxy as small as Cen A (=-20.4 (Israel, 1998), =2.210 from Figure 6). The ratio of the kinetic energy of the shell to the thermal energy in the shell is 6.5. Currently the kinetic energy of expansion is a factor of a few larger than the thermal energy of the shell, but it is likely that the shell is decelerating. It is clear that the expansion of the southwest radio lobe can provide enough energy to reheat the hot ISM, although it is unclear if it actually does.
The cooling time for the hot ISM in the central regions of elliptical galaxies is 108-9 yrs, much less than a Hubble time. Prior to the Chandra/XMM-Newton era, it was therefore expected that significant amounts of cool gas would be found in their central regions. Recent XMM-Newton RGS observations of Abell 1835 (Peterson et al., 2001), M87 (Böhringer et al., 2001, 2002; Buote, 2001) and NGC 4636 (Xu et al., 2001) have not detected the spectral signatures of this cool gas and have cast serious doubts on the existence of large amounts of cool gas expected on the basis of observations with an earlier generation of X-ray observatories (see Brighenti & Mathews (2002) for a detailed discussion). A similar situation exists for cooling flows in clusters of galaxies in that the large amount of cool gas (keV) inferred from ROSAT, Einstein, and ASCA observations is not being found with Chandra or XMM-Newton (Molendi & Pizzolato, 2001) grating observations. In the absence of this cool gas, the ISM must be occasionally reheated because of the relatively short radiative lifetime.
It has been suggested that there is a cyclical relationship between the hot ISM of elliptical galaxies (and clusters of galaxies) and nuclear activity (Ciotti & Ostriker, 1997, 2001; Churazov et al., 2001; Brighenti & Mathews, 2002; Jones et al., 2002). In these models, supermassive black holes (SMBH) at the center of elliptical galaxies undergo intermittent outbursts as the hot ISM radiatively cools and accretes. During the outburst, energy is transferred from the active nucleus to the hot ISM via outflows that are observed as jets and radio lobes in galaxies. After the epoch of nuclear activity ends, the host galaxies undergo a long period of quiescence where the ISM in Cen A slowly cools. Once a significant amount of energy is lost from the inner regions of the galaxy, material flows onto the SMBH and initiates another epoch of nuclear activity. The implication is that all cooling-flow elliptical galaxies are radio galaxies, or that they have been radio galaxies in their past. This is still an open question. It has been shown that the host galaxies of FRI and FRII radio galaxies are drawn from a random population of otherwise normal elliptical galaxies (Scarpa & Urry, 2001). The probability that an elliptical galaxy is also a radio galaxy is a steep function of the host’s luminosity (Ledlow & Owen, 1996). The more luminous, and therefore more massive, galaxies also tend to have the shortest cooling timescales for the ISM at their centers, typically 108 yrs (Forman, Jones, & Tucker, 1985; Canizares et al., 1980; Fabbiano, 1989).
5 Summary and Conclusions
We have presented the results from one XMM-Newton and two Chandra observations of the hot ISM and radio lobes of the nearby radio galaxy Centaurus A. We find that:
-
1.
The temperature of the ISM beyond 2 kpc from the nucleus is approximately 0.29 keV with a small decrease in temperature as a function of distance from the nucleus. The average radial surface brightness profile is well described by a -model with an index of 0.390.04. There is, however, some azimuthal structure in both the temperature and surface brightness profile, most likely related to a recent merger with a small spiral galaxy.
-
2.
X-ray emission coincident with the southwest radio lobe is detected. A sharp X-ray enhancement along the edge of the lobe is also observed. Based on arguments about the energetics, the spectrum, the electron energy distributions, and the observed morphology, we reject a non-thermal (i.e. synchrotron or inverse-Compton scattering) origin for the emission. We model this emission as a shell or cap of hot plasma that surrounds the radio lobe. The gas parameters of this shell were estimated using a simple model for the observed width of the enhancement along the edge of the lobe and an estimate of the angle made by the jet/counterjet with respect to the line of sight.
-
3.
Based on spectral analysis, the temperature and density of the shell are much larger (factors of 10 and 11.8, respectively) than the ambient medium. The shell is enormously overpressurized and this requires that the lobe and the shell are expanding supersonically into the ambient ISM. This conclusion is supported by the small linear extent of the X-ray enhancement along the edge of the lobe. We estimate a Mach number of about 8.5, or a velocity of 2400 km/s.
-
4.
The density ratio between the material in the shell and that of the ambient ISM is too large to be explained in terms of the canonical Rankine-Hugoniot shock conditions. We suggest that the appearance of the additional compression is in fact due to the supersonic expansion of the lobe into a medium with a steep pressure and density gradient. Recent hydrodynamical simulations of the expansion of the lobes of FR II galaxies into the ICM support this conclusion. Hydrodynamic simulation is required to quantitatively understand this phenomenon and will be the subject of a future paper.
-
5.
The X-ray shell is also enormously overpressurized relative to the equipartition pressure of the radio lobe. An additional component, perhaps protons or lower energy relativistic electrons, must be providing pressure support in the lobe.
-
6.
The amount of energy transferred to the ISM by expansion/inflation of the radio lobe is a significant fraction of its total thermal energy, demonstrating the complex, and perhaps cyclical, link between the ISM on the one hand and nuclear activity and outflows on the other.
This last point could provide a partial answer to one of the long-standing puzzles in X-ray astronomy, namely why is there such a large variance in the X-ray luminosity of early-type galaxies of a given optical luminosity (Forman, Jones, & Tucker, 1985; Eskridge, Fabbiano, & Kim, 1995). The environment and depth of the dark matter potential play a key role in this, but the cyclical interaction between the ISM and nuclear activity can contribute to this variance as well. That is, the X-ray luminosity of an early galaxy will depend where in this cooling/reheating cycle we happen to be observing it. Chandra and XMM-Newton have observed (and will continue to observe) a large number of early-type galaxies with a wide range of nuclear activities and radio powers. Perhaps once a large enough sample has been observed and analyzed, a trend can be developed to quantify this relationship. Cen A is, in fact, considerably underluminous for its optical luminosity which would support the idea that it is at the end of its cooling cycle. We are just catching Cen A as it starts to reheat its ISM.
References
- Alexander (2002) Alexander, P. 2002, MNRAS, 335, 610.
- Bahcall & Sarazin (1977) Bahcall, J. N., and Sarazin, C. L. 1977, ApJ, 213, L99.
- Blanton et al. (2001) Blanton, E. L., Sarazin, C. L, McNamara, B. R., and Wise, M. W. 2001, ApJ, 558, L15.
- Blanton et al. (2001) Blanton, E. L., Sarazin, C. L., and Irwin, J. A. 2001, ApJ, 552, 106.
- Böhringer et al. (1993) Böhringer, H., Voges, W., Fabian, A. C., Edge, A. C., and Neumann, D. M. 1993, MNRAS, bf 264, L25.
- Böhringer et al. (2001) Böhringer, H., et al.2001, A&A, 365, L181.
- Böhringer et al. (2002) Böhringer, H., Matsushita, K., Churazov, E., Ikebe, Y, and Arnaud, M. 2001, A&A, 382, 804.
- Brighenti & Mathews (2002) Brighenti, F., and Mathews, W. G. 2002, ApJ, 573, 542.
- Brown & Bregman (2001) Brown, B. A. and Bregman, J. N. 2001, ApJ, 547, 154.
- Brüggen et al. (2002) Brüggen, M., Kaiser, C. R., Churazov, E., and Enßlin, T. A. 2002, MNRAS, 331, 545.
- Brüggen & Kaiser (2002) Brüggen, M., and Kaiser, C. R. 2002, Nature, bf 418, 301.
- Brunetti et al. (2002) Brunetti, G., Bondi, M., Comastri, A., and Setti, G. 2002, A&A, 381, 795.
- Buote (2001) Buote, D. A. 2001, ApJ, 548, 642.
- Burns, Feigelson, & Schreier (1983) Burns, J. O., Feigelson, E. D., and Schreier, E. J. 1983, ApJ, 273, 128 (BFS83).
- Canizares et al. (1980) Canizares, C. R., Fabbiano, G., and Trinchieri, G. 1987, ApJ, 312, 503.
- Cawley (1998) Cawley, L. 1998, Ph.D. dissertation, The Pennsylvania State University.
- Chevalier (1974) Chevalier, R. A. 1974, ApJ, 188, 501.
- Churazov et al. (1997) Churazov, E., Gilfanov, M., Forman, W., and Jones, C. 1996, ApJ, 471, 673.
- Ciotti & Ostriker (1997) Ciotti, L., and Ostriker, J. P. 1997, ApJ, 497, L105.
- Ciotti & Ostriker (2001) Ciotti, L., and Ostriker, J. P. 2001, ApJ, 551, 131.
- Chandra Proposers’ Guide (2001) Chandra Proposers’ Observatory Guide, rev. 3.0, 2001.
- Chiaberge, Capetti, & Celotti (2001) Chiaberge, M., Capetti, A., and Celotti, A. 2001, MNRAS, 324, L33.
- Churazov et al. (2001) Churazov, E., Brüggen, M., Kaiser, C. R., Böhringer, H., and Forman, W. 2001, ApJ, 554, 261.
- Clarke, Burns, & Norman (1992) Clarke, D. A., Burns, J. O., and Norman, M. L. 1992, ApJ, 395, 444.
- Clarke, Harris, & Carilli (1997) Clarke, D. A., Harris, D. E., and Carilli, C. L. 1997, ApJ, 284, 981.
- Cooper, Price, and Cole (1965) Cooper, B. F. C., Price, R. M., and Cole, D. J. 1965, Aust. J. Phys., 18, 589.
- Cowie & McKee (1977) Cowie, L. L., and McKee, C. F. 1977, ApJ, 211, 135.
- David et al. (1990) David, L. P., Arnaud, K. A., Forman, W., and Jones, C. 1990, ApJ, 356, 32.
- David et al. (2001) David, L. P., Nelson, P. E. J., McNamara, B. R., Forman, W. R., Jones, C., Ponman, T., Robertson, B. and Wise, M. 2001, ApJ, 557, 546.
- Döbereiner et al. (1996) Döbereiner, S., et al. 1996, ApJ, 470, L15.
- Dufour et al. (1979) Dufour, R. J., van den Bergh, S., Harvel, C. A., Martins, D. M., Schiffer, F. H. III, Talbot, R. J. Jr., Talent, D. L., and Wells, D. C. 1979, AJ, 84, 284.
- Dyson, Falle, & Perry (1980) Dyson, J. E., Falle, S. A. E. G., and Perry, J. J. 1980, MNRAS, 191, 785.
- Eskridge, Fabbiano, & Kim (1995) Eskridge, P. B., Fabbiano, G, and Kim, D. W. 1995, ApJS, 533, 799.
- Fabian et al. (2000) Fabian, A. C. et al. 2000, MNRAS, 318, L65.
- Fabricant, Lecar, & Gorenstein (1980) Fabricant, D., Lecar, M., and Gorenstein, P. 1980, ApJ, 241, 552.
- Fabbiano (1989) Fabbiano, G. 1989, ARA&A, 27, 87.
- Fabbiano, Gioia, & Trinchieri (1989) Fabbiano, G., Gioia, I. M., and Trinchieri, G. 1989, ApJ, 347, 127.
- Feigelson et al. (1981) Feigelson, E. D., Schreier, E. J., Delvaille, J. P., Giacconi, R., Grindlay, J. E., and Lightman, A. P. 1981, ApJ, 251, 31.
- Feigelson et al. (1995) Feigelson, E. D., Laurent-Muehleisen, S. A., Kollgard, R. I., and Fomalont, E. B. 1995, ApJ, 449, L149.
- Feretti et al. (1999) Feretti, L., Perley, R., Giovannini, G., and Andernach, H. 1999, A&A, 341, 29.
- Finoguenov & Jones (2000) Finoguenov, A. and Jones C. 2000, ApJ, 539, 603.
- Finoguenov & Jones (2001) Finoguenov, A. and Jones C. 2001, ApJ, 547, L107.
- Forman, Jones, & Tucker (1985) Forman, W., Jones, C., and Tucker, W. 1985, ApJ, 293, 102.
- Fossati et al. (1998) Fossati, G. Maraschi, L., Celotti, A., Comastri, A., and Ghisellini, G. 1998, MNRAS, 299, 435.
- Garmire et al. (1992) Garmire, G. P., Nousek, J. A., Apparao, K. M. V., Burrows, D. N., Fink, R. L., and Kraft, R. P. 1992, ApJ, 399, 694.
- Graham (1979) Graham, J. A. 1979, ApJ, 232, 60.
- Hardcastle, Birkinshaw, & Worrall (1998) Hardcastle, M. J,, Birkinshaw, M., and Worrall, D. M., 1998, MNRAS, 294, 615.
- Hardcastle, Birkinshaw, & Worrall (1998) Hardcastle, M. J,, Birkinshaw, M., and Worrall, D. M., 1998, MNRAS, 296, 1098.
- Hardcastle & Worrall (2000) Hardcastle, M. J., and Worrall, D. M. 2000, MNRAS, 314, 359.
- Hardcastle, Birkinshaw, & Worrall (2001) Hardcastle, M. J., Birkinshaw, M., and Worrall, D. M. 2001, MNRAS, 326, 1499.
- Hardcastle et al. (2002) Hardcastle, M. J., Worrall, D. M., Birkinshaw. M., Laing, R. A., and Bridle, A. H. 2002, MNRAS, 334, 182.
- Hardcastle et al. (2002) Hardcastle, M. J., Birkinshaw, M., Cameron, R., harris, D., Looney, Worrall, D. M. 2002, ApJ, in press.
- Harris et al. (2000) Harris, D. E. et al. 2000, ApJ, 530, L81.
- Harris & Krawczynski (2002) Harris, D. E. and Krawczynski, H. 2002, ApJ, 565, 244.
- Heinz, Reynolds, & Begelman (1998) Heinz, S., Reynolds, C. S., and Begelman, M. C. 1998, ApJ, 501, 126.
- Hui et al. (1995) Hui, X., Ford, H. C., Freeman, K. C., and Dopita, M. A. 1995, ApJ, 449, 592.
- Icke (1992) Icke, V. 1992, ’Beams and Jets in Astrophysics’, ed. Philip A. Hughes, Cambridge University Press, Cambridge.
- Israel (1998) Israel, F. P. 1998, Astron. Astrophys. Rev., 8, 237.
- Jansen et al. (2001) Jansen, F. et al. 2001, A&A, 365, L1.
- Jones et al. (1996) Jones, D. L. et al. 1996, ApJ, 466, L63.
- Jones et al. (2002) Jones, C., Forman, W., Vikhlinin, A., Markevitch, M., David, L., Warmflash, A., Murray, S., and Nulsen, P. E. J. 2002, ApJ, 567, L115.
- Kaiser & Alexander (1999) Kaiser, C. R., and Alexander, P. 1999, MNRAS, 305, 707.
- Karovska et al. (2002) Karovska, M., Fabbiano, G., Nicastro, F., Elvis, M., Kraft, R., and Murray, S. 2002, ApJ, 577, 114.
- Kraft et al. (2000) Kraft, R. P. et al. 2000, ApJ, 531, L9.
- Kraft et al. (2001) Kraft, R. P., Kregenow, J. M, Jones, C., Forman, W. R., and Murray, S. S. 2001, ApJ, 560, 675.
- Kraft et al. (2002a) Kraft, R. P., Forman, W. R., Jones, C., Murray, S. S., Hardcastle, M. J., Worrall, D. M. 2001, ApJ, 569, 54.
- Landau & Lifschitz (1990) Landau, L. D., and Lifshitz, E. M. 1990, Fluid Mechanics Vol. 6 (Oxford, Butterworth-Heinemann).
- Laing & Bridle (2002) Laing, R. A., and Bridle, A. H. 2002, preprint, astro-ph 0206251.
- Leahy and Perley (1991) Leahy, J. P. and Perley, R. A. 1991, AJ, 102, 537.
- Leahy (1993) Leahy, P. 1993, “Jets in Extragalactic Radio Sources”, eds. Röser, H.-J., and Meisenheimer, K., Berlin: Springer-Verlag.
- Ledlow & Owen (1996) Ledlow, M. J., and Owen, F. N. 1995, AJ, 109, 853.
- Loewenstein & Mushotzky (2002) Loewenstein, M., and Mushotzky, R. F. 2002, BAAS, 199, 25.05.
- Mathieu et al. (1996) Mathieu, A., Dejonge, H., and Hui, X. 1996, A&A, 309, 30.
- Matsumoto et al. (1997) Matsumoto, H., Koyama, K., Awaki, H., Tsuru, T., Loewenstein, M., and Matsushita, K. 1997, ApJ, 482, 142.
- McNamara et al. (2000) McNamara, B. R. et al. 2000, ApJ, 534, L135.
- Molendi & Pizzolato (2001) Molendi, S., and Pizzolato, F. 2001, ApJ, 560, 294.
- Morganti et al. (1999) Morganti, R., Killeen, N. E. B., Ekers, R. D., and Osterloo, T. A. 1999, A&A, 307, 750.
- Morini, Anselmo, & Molteni (1989) Morini, M., Anselmo, F., and Molteni, D. 1989, ApJ, 347, 750.
- Narayan & Medvedev (2001) Narayan, R., and Medvedev, M. V. 2001, ApJ, 562, L129.
- Nulsen et al. (2002) Nulsen, P. E. J., David. L. P., McNamara, B. R., Jones., C., Forman, W. R., and Wise, M. 2002, ApJ, 568, 163.
- Peterson et al. (2001) Peterson, J. R., Paerels, F. B. S., Kaastra, J. S., Arnaud, M., Reiprich, T. H., Fabian, A. C., Mushotzky, R. F., Jernigan, J. G., Sakelliou, I. 2001, A&A, 365, L104.
- Predehl and Schmitt (1995) Predehl, P., and Schmitt, J. H. M. M. 1995, å, 293, 889.
- Reynolds, Heinz, & Begelman (2001) Reynolds, C. S, Heinz, S., and Begelman, M. C. 2001, ApJ, 549, 179.
- Sarazin, Irwin, & Bregman (2001) Sarazin, C. L., Irwin, J. A., and Bregman, J. N. 2001, ApJ, 556, 533.
- Saxton, Sutherland, & Bicknell (2001) Saxton, C. J., Sutherland, R. S., and Bicknell, G. V. 2001, ApJ, 563, 103.
- Scarpa & Urry (2001) Scarpa, R., and Urry, C. M. 2001, ApJ, 556, 749.
- Schiminovich et al. (1994) Schiminovich, D., van Gorkom, J. H.,van der Hulst, J. M., and Kasow, S. 1994, ApJ, 423, L101.
- Schreier et al. (1996) Schreier, E. J., Capetti, A., Macchetto, F., Sparks, W. B., Ford, H. J. 1996, ApJ, 459, 535.
- Sedov (1959) Sedov, L. I., 1959, ’Similarity and Dimensional Methods in Mechanics’, translated by A. G. Volkovets, CRC Press, 10th ed.
- Slee et al. (1983) Slee, O. B., Sheridan, K. V., Dulk, G. A., Little, A. G. 1983, Proc. ASA, 5, 247.
- Skibo, Dermer, & Kinzer (1994) Skibo, J. G., Dermer, C. D., and Kinzer, R. L. 1994, ApJ, 426, L23.
- Snowden et al. (1997) Snowden, S. L., Egger, R., Freyberg, M. J., McCammon, D., Plucinsky, P. P., Sanders, W. T., Schmitt, J. H. M. M., Trümper, J., and Voges, W. 1997, ApJS, 485, 125.
- Spitzer (1998) Spitzer, L. 1998, Physical Processes in the Interstellar Medium (New York: John Wiley and Sons).
- Stark et al. (1992) Stark, A. A., Gammie, C. F., Wilson, R. W., Bally, J., Linke, R. A., Heiles, C., and Hurwitz, M. 1992, ApJS, 78, 77.
- O’Sullivan, Forbes, & Ponman (2001) O’Sullivan, E., Forbes, D. A., and Ponman, T. J. 2001, MNRAS, 328, 461.
- Padovani & Urry (1991) Padovani, P., and Urry, C. M. 1991, ApJ, 368, 373.
- Tashiro et al. (1998) Tashiro, M., Kaneda, H., Makishima, K., Iyomoto, N., Idesawa, E., Ishisaki, Y., Kotani, T., Takahashi, T., and Yamashita, A. 1998, ApJ, 499, 713.
- Tingay et al. (1998) Tingay, S. J., et al. 1998, A. J., 115, 960.
- Trinchieri & Fabbiano (1985) Trinchieri, G. and Fabbiano, G., 1985, ApJ, 296, 447.
- Trinchieri, Fabbiano, & Canizares (1986) Trinchieri, G., Fabbiano, G., and Canizares, C. R. 1986, ApJ, 310, 637.
- Trinchieri & Fabbiano (1991) Trinchieri, G. and Fabbiano, G. 1991, ApJ, 382, 82.
- Trinchieri & Di Serego Alighieri (1991) Trinchieri, G. and Di Serego Alighieri, S. 1991, AJ, 101, 1647.
- Trinchieri, Noris, & Di Serego Alighieri (1997) Trinchieri, G., Noris, L., and Di Serego Alighieri, S. 1997, å, 326, 565.
- Trinchieri et al. (2000) Trinchieri, G. et al. 2000, A&A, 364, 53.
- Tucker & David (1997) Tucker, W., and David, L. P. 1997, ApJ, 484, 602.
- Urry & Padovani (1995) Urry, C. M. and Padovani P. 1995, PASP, 107, 803.
- van Gorkom et al. (1990) van Gorkom, J. H., van der Hulst, J. M., Haschick, A. D., Tubbs, A. D. 1990, AJ, 99, 1781.
- Vikhlinin, Markevitch, & Murray (2001) Vikhlinin, A., Markevitch, M., and Murray, S. S. 2001, ApJ, 551, 160.
- Weisskopf et al. (2000) Weisskopf, M. C., Tananbaum, H. D., Van Speybroeck, L. P., and O’Dell, S. L. 2000, Proc. SPIE ’X-ray Optics, Instrument ation and Missions III’, eds. J. E. Trümper and B. Aschenbach, 2.
- Worrall, Birkinshaw, & Hardcastle (2001) Worrall, D. M., Birkinshaw, M., and Hardcastle, M. J. 2001, MNRAS, 326, L7.
- Xu et al. (2001) Xu, H., Kahn, S. M., Peterson, J. R., Behar, E., Paerels, F. B. S., Mushotzky, R. F., Jernigan, J. G., and Makishima, K. 2001, preprint (astro-ph 0110013).
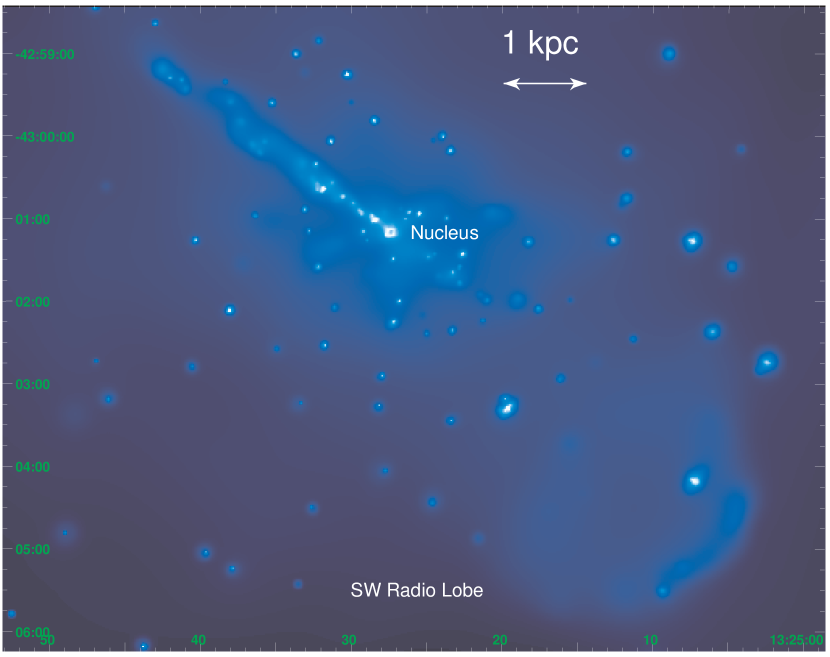
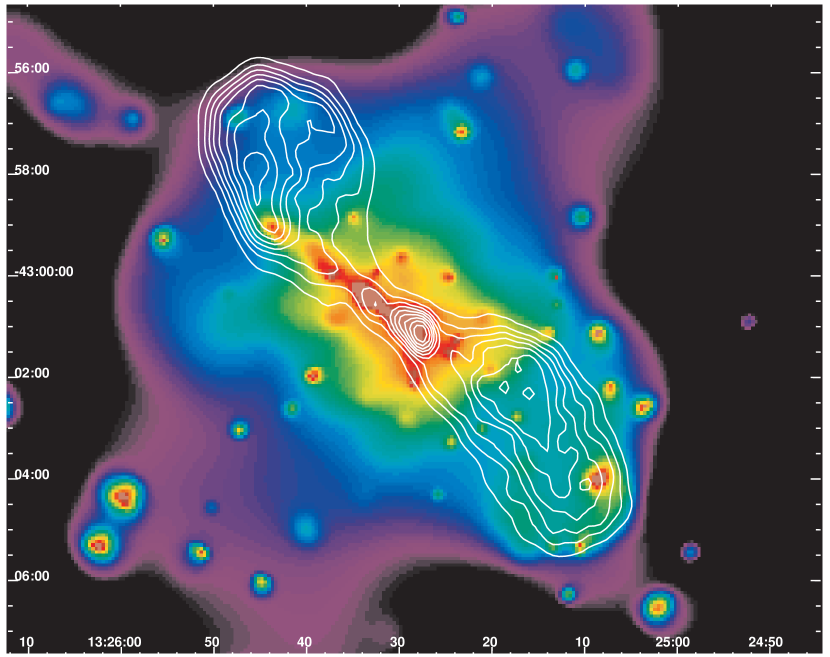

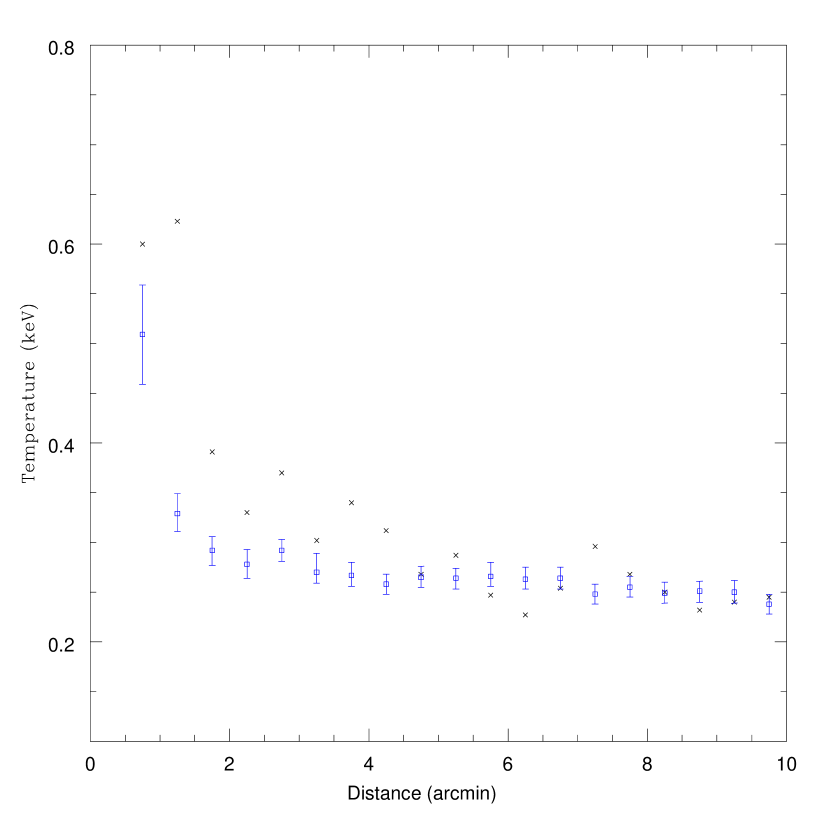
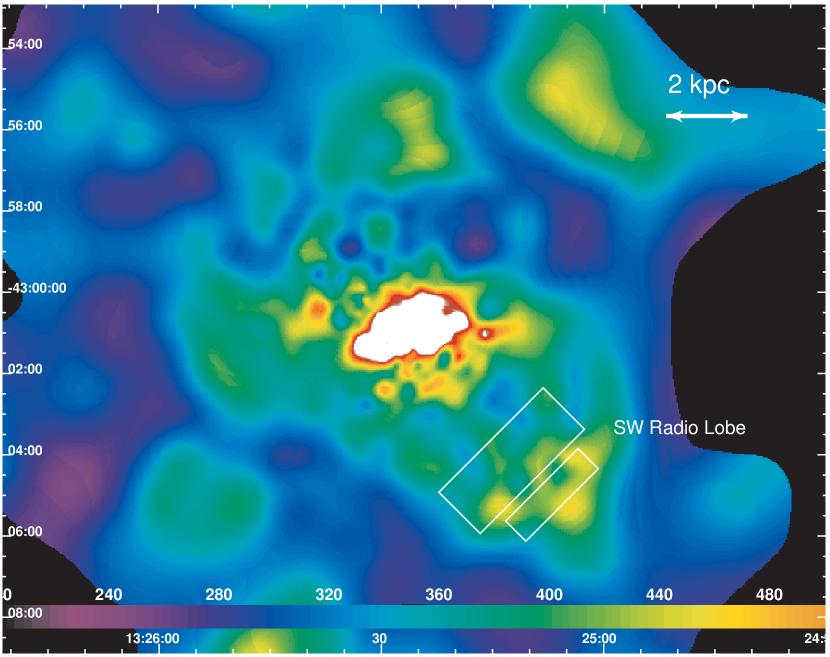
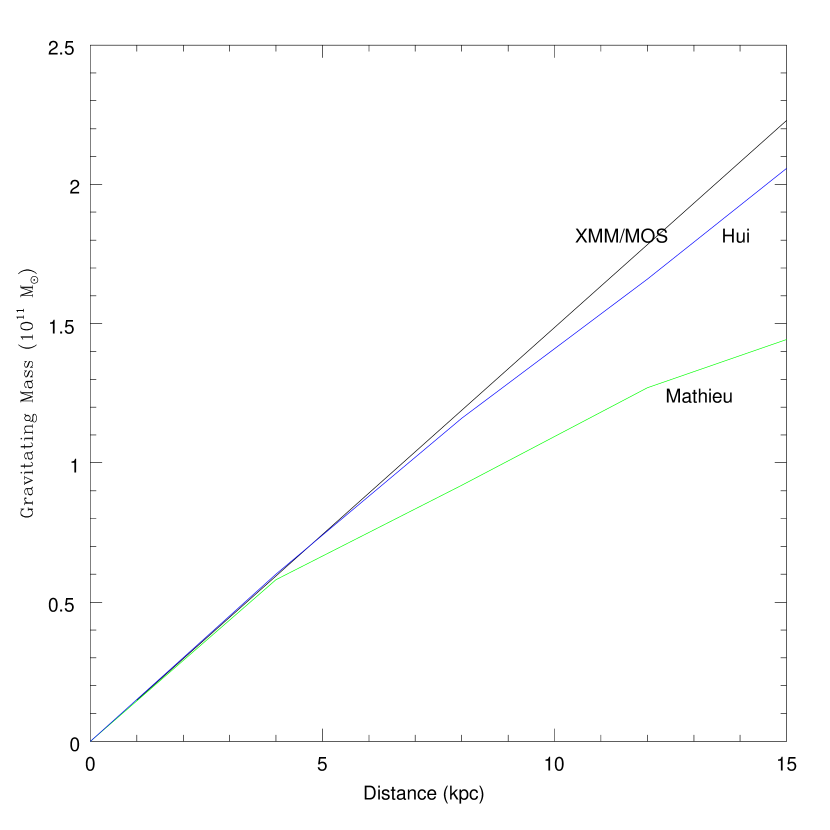
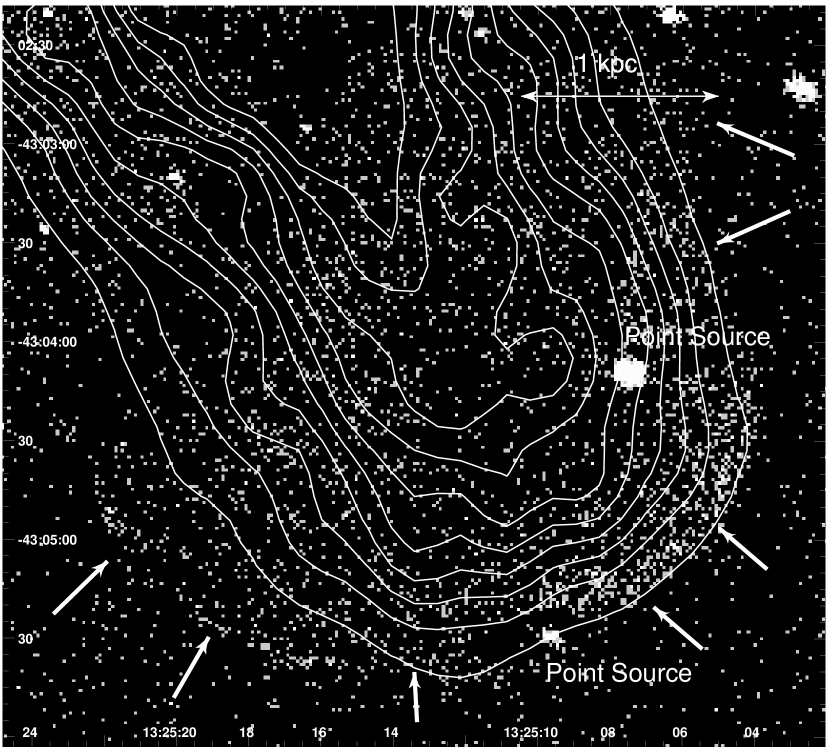
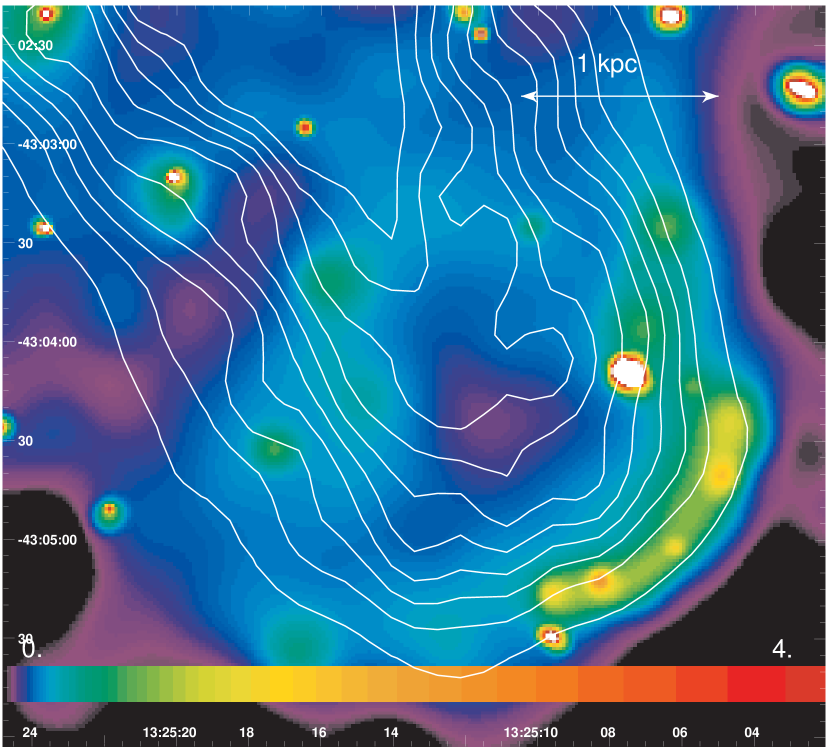
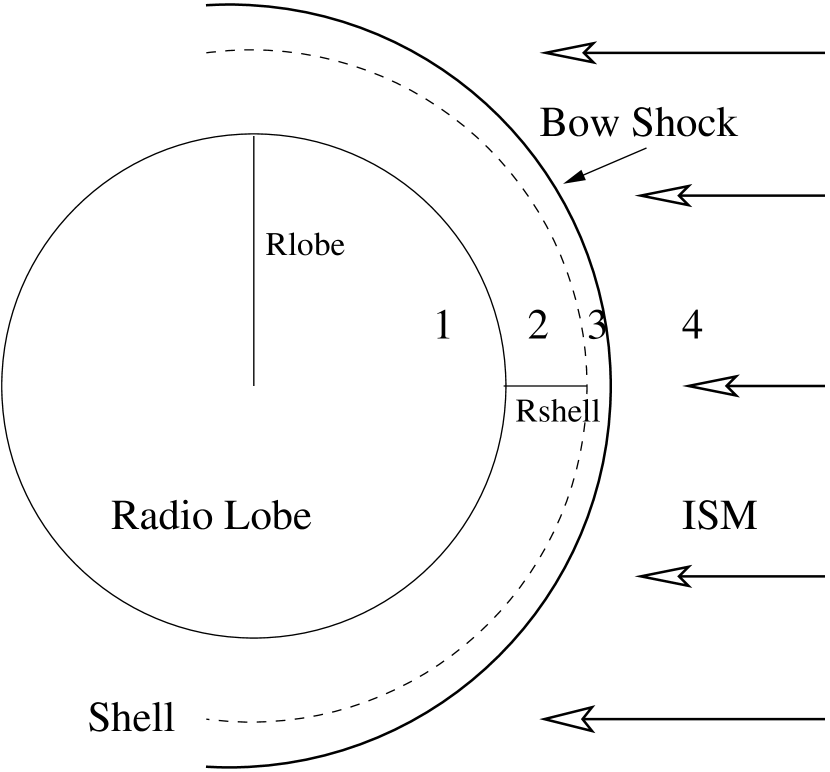
| Instrument | OBSID | Date | Exp Time (ks) | RA | DEC | Y Offset | Z Offset |
|---|---|---|---|---|---|---|---|
| ACIS-I | 00316 | 5DEC99 | 35.9 | 13:25:27.61 | -43:01:08.9 | ||
| ACIS-I | 00962 | 17MAY00 | 36.5 | 13:25:27.61 | -43:01:08.9 | ||
| XMM-Newton | 93650201 | 2FEB01 | 23.1 | 13:25:26.3 | -43:01:06 |
| kT (keV) | (cm-3) | (kpc) | Central Cooling time (yrs) | |
|---|---|---|---|---|
| 0.400.04 | 0.290.3 | 4.010-2 | 0.5 | 108 |
| Region | RA | DEC | Roll | Width | Length |
|---|---|---|---|---|---|
| 1 - Diffuse | 13:25:14 | -43:04:01 | 45∘ | ||
| 2 - Enhancement | 13:25:07 | -43:05:00 | 45∘ |
| XMM-MOS1 | XMM-MOS2 | XMM-PN | Chandra - 00316 | Chandra - 00962 | |
| Region 1 - Enhancement along/beyond the edge of the southwest lobe | |||||
| Rate (10-2 cts s-1) | 2.300.12 | 1.630.11 | 7.750.26 | 1.670.08 | 1.620.14 |
| Power Law Model | |||||
| Index | 2.04 | 1.80 | 1.81 | 1.85 | 1.83 |
| 1.73 | 1.11 | 1.02 | 1.50 | 0.97 | |
| One Temperature MEKAL Model | |||||
| 2.83 | 2.62 | 3.70 | 3.4 | 3.4 | |
| 2.92 | 0.49 | 1.24 | 2.31 | 1.32 | |
| Two Temperature MEKAL Model | |||||
| 4.19 | 2.90 | 4.5 | 5.1 | 4.2 | |
| 0.33 | 0.47 | 0.21 | 0.76 | 0.71 | |
| 0.44 | 0.06 | 0.20 | 0.18 | 0.07 | |
| 1.12 | 0.50 | 1.03 | 1.46 | 1.30 | |
| Region 2 - Diffuse emission coincident with/interior to the lobe | |||||
| Rate (10-2 cts s-1) | 3.600.20 | 3.260.20 | 8.740.39 | ||
| Power Law Model | |||||
| Index | 2.00 | 2.24 | 2.08 | ||
| 1.60 | 0.98 | 1.29 | |||
| One-Temperature MEKAL Model | |||||
| 2.84 | 2.03 | 2.25 | |||
| 1.82 | 1.47 | 1.59 | |||
| Two-Temperature MEKAL Model | |||||
| 3.43 | 2.26 | 3.47 | |||
| 0.34 | 0.30 | 0.38 | |||
| 0.29 | 0.35 | 0.375 | |||
| 1.54 | 1.15 | 1.08 | |||
| Feature | Pressure (dyn cm-2) | Temperature (keV) | Density (cm-3) |
|---|---|---|---|
| ISM (region 4) | 1.010-12 | 0.29 | 1.710-3 |
| Shell (region 2) | 2.110-10 | 2.88 | 2.010-2 |
| Lobe (equipartition) | 1.410-11 |