Hubble Space Telescope Observations of the Nova-Like Cataclysmic Variable V348 Puppis111Based on observations with the NASA/ESA Hubble Space Telescope, obtained at the Space Telescope Science Institute, which is operated by the Association of Universities for Research in Astronomy, Inc., under NASA contract NAS 5-2655.
Abstract
We present time series UV and optical (1150 – 8000 Å) spectrophotometry of the novalike (NL) cataclysmic variable V348 Pup through and after eclipse. Outside of eclipse, the spectrum is characterized by a blue continuum, strong line emission, and a broad dip from 2000 – 3000 Å. The continuum eclipse depth is roughly the same over the entire wavelength range covered and there are no signatures of the WD eclipse in the light curves. Model steady-state accretion disk spectra provide a poor fit to the shape of the UV-optical spectrum outside of eclipse. All of these properties are consistent with a disk that is self-shielding, hiding the inner disk and the white dwarf. In eclipse, the emission lines and the broad dip are occulted less than the continuum, indicating vertical extension in these components. The dip is consistent with the presence of a vertical “Fe II” absorbing curtain in the system. Archival UV-optical spectra of the lower-inclination NL UX UMa show a bluer continuum and weaker line emission than in V348 Pup and no broad dip. There is strong flickering in V348 Pup. The flickering spectrum shows that the flickering occurs only in the continuum. We did not detect any periodicities associated with the rapid variability. The properties of V348 Pup are consistent with its previous identification as a member of the SW Sex sub-class of NLs.
1 Introduction
Cataclysmic variables (CVs) are interacting binary systems in which a late-type donor star fills its Roche lobe and transfers mass to a white dwarf (WD). In non-magnetic CVs material is accreted onto the WD via an accretion disk; the magnetic field strength of the WD ( G) is too small to significantly disrupt the accretion flow. For an overview of the properties of CVs, see Warner (1995).
When plotted as a distribution in orbital period, very few of the known non-magnetic CVs fall in the period range from hr. This region is known as the CV “period gap”. The period gap is believed to be an evolutionary effect, described by the interrupted braking model (Spruit & Ritter, 1983; Rappaport, Verbunt, & Joss, 1983). In this picture, relatively rapid angular momentum loss (perhaps via a magnetic wind) drives the donor stars of longer period CVs out of thermal equilibrium, causing Roche lobe overflow and mass transfer. The upper edge of the period gap is created with the sudden cessation of the rapid angular momentum loss, shrinkage of the donor star within its Roche lobe, and a cutoff of mass transfer, which is believed to occur when the donor star becomes fully convective. CVs in the period gap continue to slowly lose angular momentum via gravitational radiation. Eventually, the Roche lobe shrinks enough in size that it regains contact with the surface of the donor star and mass transfer resumes at a diminished rate. CVs luminous enough to be observable are thus dominated by actively accreting systems above and below the period gap.
Nevertheless, the CV period gap is not devoid of disk-accreting CVs, and their presence can provide an opportunity to test the interrupted braking model and the theory of CV evolution. One such system is V348 Pup, discovered by Tuohy et al. (1990) as the optical counterpart of a persistent HEAO 1 X-ray source. With an orbital period of 2.44 hr, V348 Pup lies squarely inside the period gap. An eclipse in its light curve and a rotational disturbance in the radial velocities of its optical emission lines point to the presence of an accretion disk.
V348 Pup does not show dwarf nova outbursts, so it is a novalike (NL), a sub-class of CVs with persistently high mass accretion rates that are nearly always found above the period gap. It has the broad, smooth optical eclipses characteristic of eclipsing NLs, caused by the occultation of a luminous, high accretion rate disk. Rolfe, Haswell, & Patterson (2000) showed that V348 Pup has a permanent positive superhump from a precessing, elliptical accretion disk. The non-axisymmetric disk morphology is driven by tidal interactions with the donor star. Rodríguez-Gil et al. (2001) demonstrated that, based on the morphology and orbital behavior of its line spectrum, V348 Pup can also be classified as a SW Sex system, a sub-type of the NLs. SW Sex systems are characterized by strong, single-peaked optical H I and He I emission lines that are largely unocculted during eclipse, by phase lags in the radial velocity curves of these lines relative to the motion of the central object, and by phase-dependent absorption components in the lines (Thorstensen et al., 1991). Although SW Sex stars were originally thought to consist of eclipsing systems only, several non-eclipsing systems have been discovered that display SW Sex type behavior (Martínez-Pais, Rodríguez-Gil, & Casares, 1999).
V348 Pup provides an important extension of NL CVs to shorter orbital periods. By probing the structure of the accretion disk and related phenomena such as outflows in V348 Pup, we can better understand the properties that govern disk accretion and how such properties depend on the evolutionary state, mass accretion rate, and geometric size of the binary system. V348 Pup is eclipsing, with an inclination of 81 (Rolfe, Haswell, & Patterson, 2000; Rodríguez-Gil et al., 2001). As a result, it is also an excellent candidate in which to probe the vertical structure of accretion disks by observing the differences between eclipsed and uneclipsed components of the disk at various wavelengths. In order to study the accretion properties in this unusual CV, we have obtained high-speed UV and optical spectrophotometry of the eclipse in V348 Pup with the Faint Object Spectrograph (FOS) on the Hubble Space Telescope (HST). The observations and data reduction are summarized in § 2. Analysis of the data is presented in § 3, and discussion and conclusions given in § 4 and 5.
2 Observations
We observed V348 Pup with the HST FOS on 1996 September 11 – 17. There were eight visits total. A summary of the observations is given in Table 1. The visits switched between observations obtained with the RD PRISM and observations obtained with the BL G160L grating, both using the 1.0 aperture (0.86). This combination of settings allowed for the greatest possible wavelength coverage at high time resolution, but at low spectral resolution. The observing strategy was the same as one used for observations of another eclipsing NL, UX UMa (Knigge et al., 1998). The spectra were acquired in RAPID mode, with a spectrum obtained every 4.29 sec. The effective wavelength coverage of the PRISM observations was 1600 – 8000 Å with a widely varying resolution ranging from approximately 4 Å at the blue end to 400 Å at the longest wavelengths. The effective wavelength coverage of the G160L grating observations was 1150 – 2500 Å at a resolution of 6.87 Å. The data were reduced using the standard STSDAS package routines with the updated (POA_CALFOS) calibration package for the FOS. In addition to the dispersed light spectra, the zeroth-order undispersed light was recorded in observations with the G160L grating. For calibrating the undispersed data, we used the rough (to within 50%) absolute flux calibration given in Eracleous & Horne (1994).
Due to non-repeatability in the placement of the filter grating wheel (FGW), the absolute wavelength solution for FOS spectra in an observation can be off by as much as 1 diode. At the longest wavelengths in the PRISM setting, this can translate to an error of hundreds of Å. We did not obtain wavelength calibration spectra during our observations so we do not have the means to recalibrate the wavelength solution. Fortunately, the effect of this error is to shift the entire spectrum by the same amount with every spectrum in an observation having the same shift (based on the placement of the FGW at the start of the observation). As a result, it is the absolute wavelength solution for each observation only that is uncertain, not the relative wavelength solutions of each spectrum. The FOS paper products from the observations confirm that our observations were normal, and that other potential sources of wavelength uncertainty (such as mis-centering of the target in the aperture) did not occur.
We see absolute wavelength offsets in several of our visits of order 1 diode, so for the PRISM spectra we determined the wavelength shift for each visit using the position of the Mg II Å feature and corrected the wavelength solution accordingly. We also recalculated the flux calibration solution to ensure that the correct wavelength and sensitivity were matched for each pixel. For the G160L grating spectra, there were no obvious wavelength offsets between the various observations but, based on the wavelengths of various spectral features, all spectra were shifted by about 1 diode, or 6.87 Å, to the red. We have corrected this offset in the analysis that follows.
The orbital phases for the spectra were determined using the ephemeris of Baptista et al. (1996)222A revised ephemeris has been published for V348 Pup (Rolfe, Haswell, & Patterson, 2000). The two orbital solutions agree within their uncertainties, so we did not rebin the data.. Three of the visits in each dispersion configuration were obtained during eclipse (Runs 1–4, 7–8 in Table 1), and one observation each in the prism and grating configurations was obtained after primary eclipse (Runs 5 & 6).
3 Analysis
3.1 Spectra and Light Curves Through Eclipse
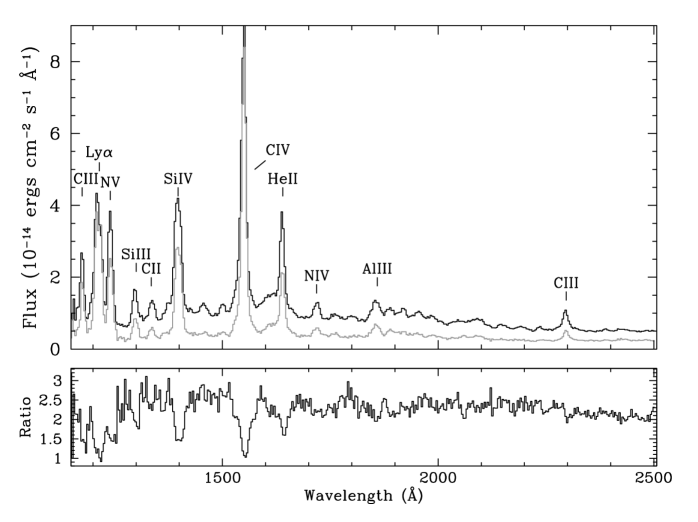
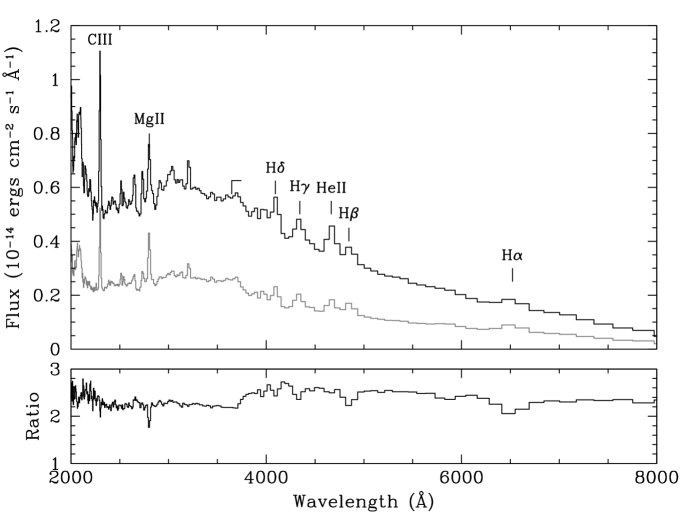
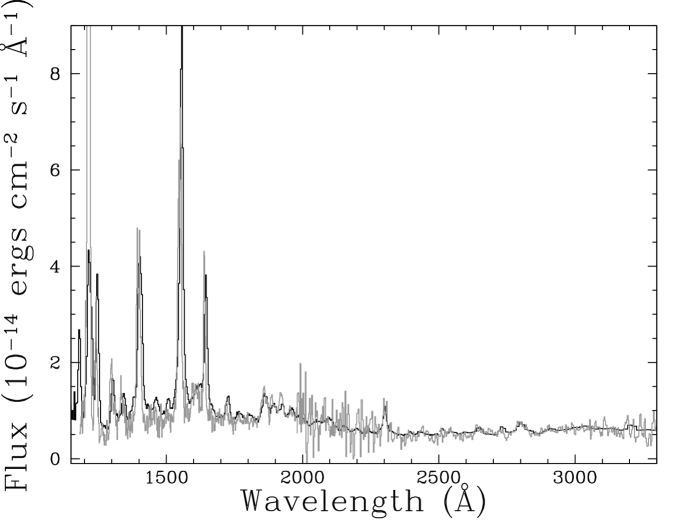
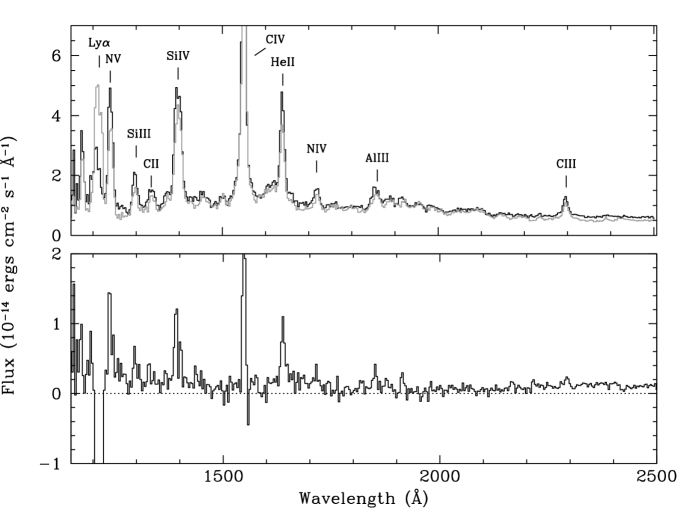
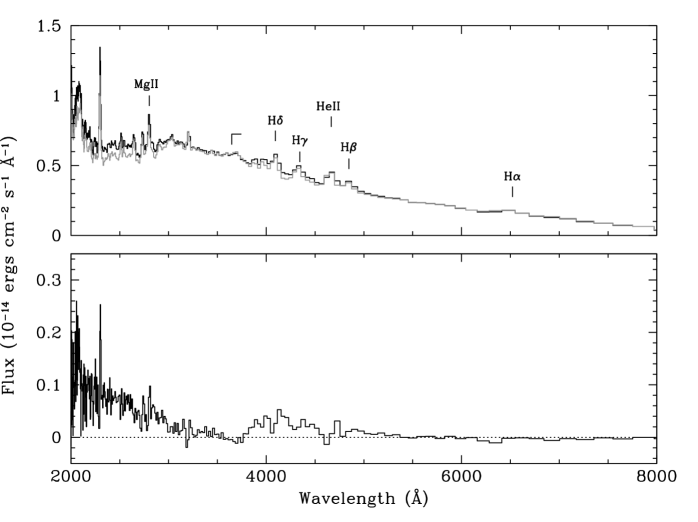
Figure 1 shows the combined out-of-eclipse and mid-eclipse spectra from the grating observations, while Figure 2 shows the same for the prism observations. There were no gross changes in the flux or shape of the spectra between observations, so all data were combined together. Here and elsewhere in this paper, out-of-eclipse phases are defined as and , and include the observation in each setting acquired post-eclipse. Mid-eclipse is defined as the duration of total eclipse of the WD, 0.07 cycles (assuming = 0.31 and = 81; Rolfe et al. 2000, Rodríguez-Gil et al. 2001), so that mid-eclipse runs from = 0.965 – 0.035. Also shown in the bottom panel of each figure is the ratio of the out of eclipse to mid-eclipse spectra.
Outside of eclipse, the broadband UV-optical spectrum rises to the blue, although there is a broad trough in the spectrum from 2000 – 3000 Å. The spectra show strong emission lines of H I (Balmer series and Ly); He II; resonance transitions of C II, C IV, N V, Mg II, Al III, and Si IV; and excited state transitions of C III, N IV, and Si III. The Balmer jump is shallow or absent. The resonance doublet of C IV 1548,1552 Å is the strongest line in the spectrum, with a combined EW of Å. The FWHM of the UV lines range from 2500 – 4000 km s-1. (The FHWM measurement assumed Gaussian profiles for the single lines and double Gaussian profiles for the doublets, where the FWHM was fixed to the same value for both components.)
The depth of the continuum eclipse is similar over the entire UV-optical wavelength range. At most continuum wavelengths, 55% – 60% of the out-of-eclipse flux is occulted. The eclipse is shallower in the broad spectral trough from 2000 – 3000 Å, with only 45% of the out of eclipse flux occulted at 2500 Å. The eclipse depth remains around 50% to the red of this trough until the Balmer limit, where the eclipse depth rises sharply back to 60% of the out of eclipse flux occulted. As a result, the mid-eclipse spectrum has an even weaker Balmer jump than the out of eclipse spectrum. The 2000 – 3000 Å trough is also more shallow relative to the rest of the spectrum at mid-eclipse than outside of eclipse.
All of the emission lines seen in the out-of-eclipse spectrum are also present at mid-eclipse, indicating that they are not fully occulted. The degree to which the lines are eclipsed varies. The strongest lines, Ly and C IV, are essentially unobscured near their line cores. Ly is most likely contaminated by variable airglow emission, so we will not discuss its properties further, but the shallow eclipse in C IV is intrinsic to V348 Pup. C III 1175 Å also has a very shallow eclipse. In the rest of the emission lines, 20% – 55% of the out of eclipse flux near line center is occulted. For all of the emission lines, the eclipse is weaker in the line than in the adjacent continuum.
For most of the UV and optical emission lines, the line profile is unchanged in eclipse. Interestingly, however, the eclipse profile is not symmetric about the line center in C IV and C III 1175 Å: the eclipse depth is smaller to the red of line center than to the blue. A similar but less conspicuous asymmetry in the eclipse minimum with respect to line center can be seen in Al III 1855 Å and C III 2300 Å. Figure 3 shows the spectrum of the eclipsed light (that is, the difference spectrum between the out-of-eclipse and mid-eclipse spectra). For most of the lines, the eclipsed light spectrum is much the same in line profile and morphology as the out-of-eclipse spectrum, but for C IV and C III 1175 Å, the line profile in eclipsed light has a blue emission component and a red trough that actually falls below the local continuum into absorption. The peak in Si IV 1393,1402 Å is also blueshifted in eclipse relative to its peak out of eclipse, but there is no absorption component in this line in the eclipsed light spectrum.
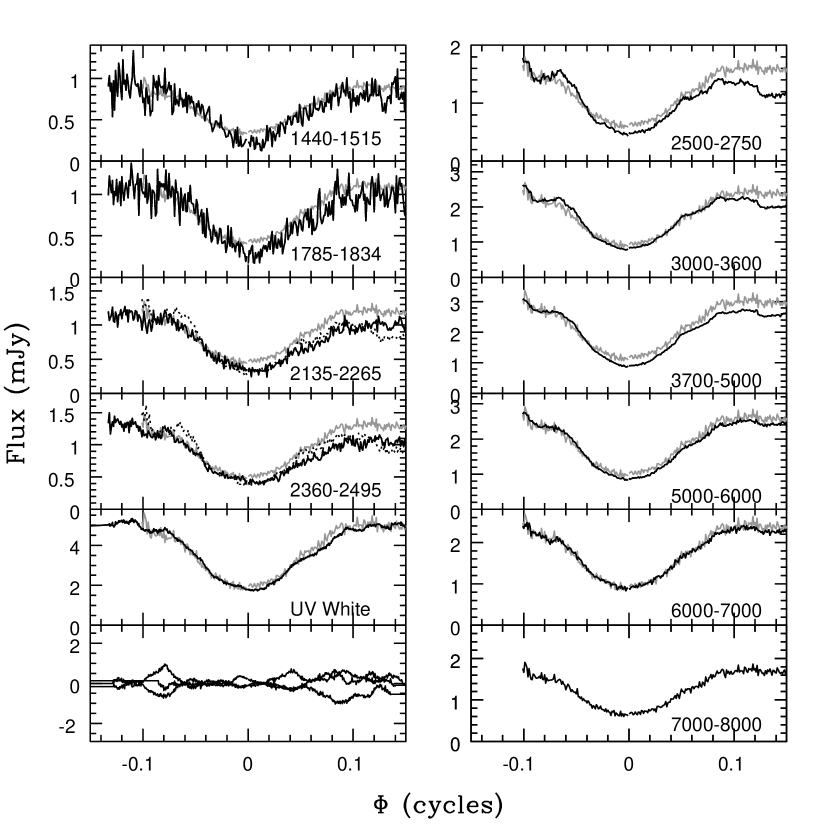
In Figure 4, we show continuum eclipse light curves in several bands across the UV-optical range. The light curves are binned (2000 points per binary orbit) averages of the three eclipse observations obtained in each observation setting. Also shown in the lower left panel are the residuals from the three G160L eclipse observations in undispersed light with respect to the average light curve. The residuals show that flickering is strong in V348 Pup. The behavior and properties of the flickering are discussed in §3.3, but it should be noted here that the strength of the flickering confuses the eclipse profile. We have averaged the three eclipse observations in each observation setting, but three observations are not always sufficient to separate orbital variability effects from secular fluctuations.
The continuum eclipse light curves are quite similar over the broad wavelength coverage of our observations. All of the continuum eclipses are V-shaped, particularly in contrast to the smooth, U-shaped eclipses in UX UMa (see §3.1.1). As noted before, there is little change in the depth of the eclipse from UV to optical. There is also no sign of a change in the eclipse width over the wavelength range. While the red light curves ( Å) show the same pre- and post-eclipse flux levels, the post-eclipse flux does not recover to the pre-eclipse levels in the UV and blue optical. Both the modest change in eclipse shape with wavelength and the V-shaped eclipses point to the eclipse of a source that has a relatively flat radial temperature distribution.
Finally, there is no clear signature of the eclipse of the WD or, indeed, any other ingress or egress features in the light curves. A 15,000 K – 30,000 K WD is most observable at short wavelengths, where its fractional contribution to the observed flux is maximized. There is no sign of the WD in the UV light curves, however. An examination of the residuals of the individual light curves with respect to the mean curve in the lower left panel of Figure 4 shows that what appear to be possible ingress/egress features in the UV light curves are actually associated with flickers and are not repeated in every eclipse observation.
3.1.1 A Comparison of the Spectra and Light Curves of V348 Pup, UX UMa, and DW UMa
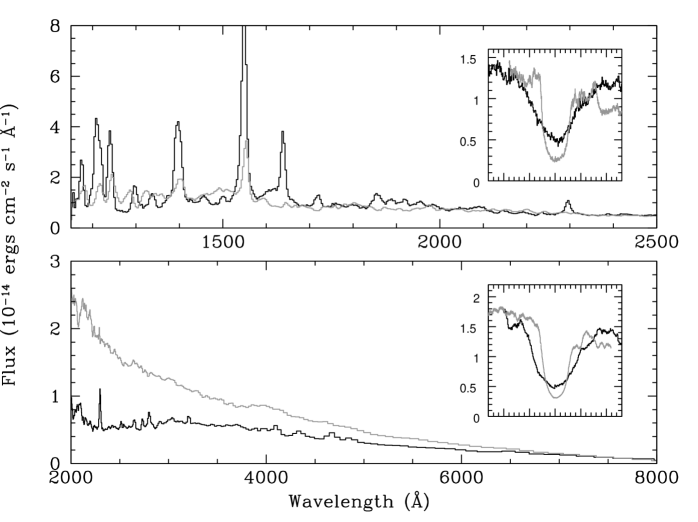
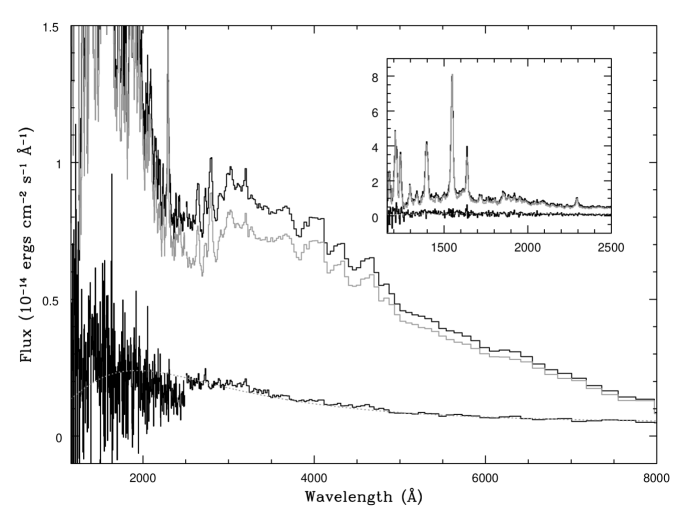
Since the eclipsing NL UX UMa, a system above the period gap, was observed with the same setup as our observations, it is instructive to compare the two systems. Detailed analysis of the UX UMa observations can be found in Knigge et al. (1998) and Baptista et al. (1998). UX UMa is an eclipsing NL with an orbital period of 4.72 hr and an inclination of 71 (Baptista et al., 1995). Figure 5 shows the out of eclipse G160L and PRISM spectra of V348 Pup and UX UMa, and broadband light curves of both objects. UX UMa is brighter than V348 Pup, so its spectra and light curves have been scaled down to the fluxes of V348 Pup for comparison.
The rich emission line spectrum of V348 Pup in the UV is similar to that of UX UMa. The emission lines are not as strong in UX UMa than in V348 Pup, however, and He II emission at 1640 Å and 4686 Å is significantly weaker. The Balmer jump is more prominently in absorption in UX UMa than in V348 Pup. The continuum is significantly bluer in UX UMa: when the two spectra are fixed to the same flux at 2500 Å, UX UMa is 20% brighter than V348 Pup at 1500 Å and 25% brighter at 1275 Å. In the PRISM spectra, UX UMa exceeds V348 Pup in flux by 60% at 4000 Å and 240% at 2000 Å (when fixed to the same flux at 8000 Å). Interestingly, UX UMa does not show the broad 2000 – 3000 Å spectral dip that is seen in V348 Pup.
A comparison of the light curves indicates that the eclipse is wider in V348 Pup than in UX UMa. The wider eclipse is due to the combination of a higher inclination (81 vs. 71 in UX UMa; Baptista et al. 1995) and a larger disk size in V348 Pup. By modeling the superhump in V348 Pup, Rolfe, Haswell, & Patterson (2000) determined that the disk emission extends out to 80 – 90% of the primary Roche lobe radius, significantly farther than the outer disk emitting radius in UX UMa (0.6 R; Baptista et al. 1998). UX UMa has a smooth, U-shaped eclipse with a steep ingress and egress, while the eclipse in V348 Pup is more V-shaped, with a gradual ingress and egress and relatively short duration of eclipse minimum. Finally, UX UMa has a stronger pre- versus post-eclipse flux variation than in V348 Pup, although this can change dramatically from eclipse to eclipse in UX UMa, with the post-eclipse flux often exceeding the pre-eclipse level (Smak, 1994).
The eclipsing NL DW UMa is also interesting to compare to V348 Pup because the two systems have the same inclination ( for DW UMa; Araujo-Betancor et al. 2003). DW UMa has an orbital period of 3.28 hr. Although there are no broadband UV-optical observations of DW UMa in its normal state, it was observed in 1985 and 1987 by IUE. The IUE observations are discussed in greater detail in Szkody (1987). Here we compare the out of eclipse spectra of V348 Pup and DW UMa, both shown in Figure 6 (the DW UMa spectrum has been scaled down by a factor of 2). In the shape of the UV continuum and the appearance and strength of the emission lines, the two sources have UV spectra that are virtually identical. The drop in flux longward of 2000 Å suggests that the broad 2000 – 3000 Å dip seen in V348 Pup is also present in DW UMa.
3.2 Pre- Versus Post-Eclipse Spectra
There are indications that the spectrum of V348 Pup is not the same in the phases before and after eclipse: the UV and blue optical fluxes are smaller after eclipse than before, while the red optical flux is the same before and after eclipse. As a result, we undertook a comparison of the pre- and post-eclipse spectra in V348 Pup. We combined all spectra obtained from orbital phases 0.88 – 0.92 for pre-eclipse and all spectra from phases 0.08 – 0.12 for the (immediate) post-eclipse spectrum. We combined all spectra within the defined orbital phase ranges from the three eclipse observations in each observation setting to create mean pre- and post-eclipse spectra. Two of the three eclipses were well covered before and after eclipse in each observation setting, while the pre-eclipse phases were largely cut off in one eclipse observation in each setting.
We are somewhat limited in our ability to draw conclusions concerning the pre- and post-eclipse behavior of the spectrum, however, because the relative fluxes before and after eclipse changed from observation to observation. In one of the G160L eclipse observations, the 1500 Å flux dropped 30% between the mean pre- and post-eclipse levels. In the other observation with pre-eclipse coverage, however, there is no difference in the continuum before and after eclipse. Similarly, of the two PRISM observations spanning the full eclipse, one shows a 20% drop in flux at 3000 Å before and after eclipse and one shows no drop. We therefore discuss below those features that appear in multiple eclipses.
The mean pre- and post-eclipse spectra, and the difference spectra, are shown in Figures 7 and 8. As suggested by the eclipse light curves, there is a difference in the spectrum before and after the eclipse. The continuum red of the Balmer limit is roughly the same before and after eclipse, but the blue emission does not recover its pre-eclipse level. Most of the UV and optical emission lines are also weaker after eclipse than before. The spectral dip from 2000 – 3000 Å is deeper (i.e., lower in flux) after eclipse than before. The resulting difference spectrum between pre- and post-eclipse shows a blue continuum and line emission.
Interestingly, the two observations obtained after the eclipse (Runs 5 & 6) also show a steady decline in the observed flux, extending to at least phase 0.3. The drop is 20% in the PRISM observation and 45% in the G160L observation from phase 0.1 – 0.3. This suggests that there is an orbital phase-related drop in the flux starting before the eclipse and extending well after eclipse end, but with our limited data, little more can be said on this point.
There is more than one possible source for the variable emission across the eclipse. The bright spot, where the mass accretion stream impacts the edge of the disk, has an orbital phase behavior consistent with a difference in pre- and post-eclipse flux. If this component is the bright spot, its properties are in contrast to those of the bright spot in UX UMa, which showed lines in absorption, the opposite of what we see here. The permanent superhump could also cause a slowly-varying fluctuation across and beyond the eclipse (see Rolfe et al. 2000, Fig. 7). Unfortunately, the superhump phasing is very unstable, and we do not have enough data to determine the superhump phase at the time of our observations.
3.3 Light Curve Flickering
The light curves in V348 Pup show frequent, large amplitude secular variability, or flickering, especially at UV wavelengths. Examples of flickering can be seen in the residuals of the individual eclipse observations with respect to the average light curve in the UV first-order light (see the lowest left panel of Figure 4). The typical flickers last from 1 – 3 minutes and are 5% – 10% above the local mean. Some of the brighter flickers reach 25% – 40% above the local mean.
To examine the spectrum of the flickering source, we created an average of all the spectra obtained at flux peaks and another of the troughs. We normalized the individual observation light curves, using a constant normalization for the regions out of eclipse on the eclipse observations and a low-order (4th order) spline on the two post-eclipse observations. We then defined the flickering peaks for each observation as comprising all out of eclipse spectra more than 1 above the mean. Similarly, the flickering troughs comprise all spectra more than 1 below the mean. The resulting spectra and the difference spectrum are shown in Figure 9. The difference spectrum between the peaks and troughs gives the spectrum of the flickering. It is featureless, indicating that the instantaneous flickering occurs in the continuum and not in the emission lines. An arbitrarily-scaled, 15,000 K blackbody is shown in comparison to the flickering spectrum in Figure 9. While the blackbody spectrum is not a fit, it does provide a good match to the shape of the flickering spectrum.
We also examined auto-correlation and cross-correlation functions of light curves in several passbands to determine if there are any periodicities in the light curves or a delayed response to the continuum flickering in the emission lines. For this, we used the two out of eclipse observations (Runs 5 & 6). We created post-eclipse light curves of continuum regions and emission lines by averaging the flux in each passband and each spectrum. Emission line light curves in the G160L observation were made for Si IV, C IV, He II, and C III 2300 Å, as well as for the blend of weaker lines from 1833 – 2018 Å. Continuum light curves were made for 1429 – 1511 Å, 1679 – 1700 Å, 2343 – 2493 Å. From the PRISM observation, we made emission line light curves for C III and Mg II, and continuum light curves from 1720 –1835 Å, 2000 – 2275 Å, 2340 – 2620 Å, 2865 – 3165 Å, and 3240 – 3595 Å. We did not make narrow-band light curves at the longer wavelengths because the variability drops off longward of the Balmer limit. Finally, we made light curves of the overall spectral regions covered by each observation, 1150 – 2500 Å for the G160L and 2000 – 8000 Å for the PRISM.
Both post-eclipse observations showed a steady decrease in flux, so we smoothed the light curves with a high-pass filter (71 pixel boxcar) to remove the slow variability before conducting the power spectrum analysis. For this, we used a 71 pixel boxcar filter; each pixel in the light curve covers 4.29 sec, so this corresponds to filtering over a 5.1 min moving window (the total observation time was 38 min for each observation). Experiments with filters of other sizes altered the S/N of the correlation functions but did not change our results. We also subtracted the nearby continuum light curve from the line light curves to focus on the line variability only.
None of the auto-correlation functions of the continuum or line light curves showed any lagged correlations in the variability. The continuum light curves were cross-correlated at zero lag, but there was no significant lagged correlation between different continuum regions; nor was there any correlation between continuum and lines at zero or non-zero lag. Power spectrum analyses of the light curves confirmed this result, failing to show any significant periodicities in the light curves. By injecting sinusoids of known period and amplitude into our broadband light curves, we determined that we would certainly (probably) have detected periodicities with an amplitude of 5% (3%) in a frequency range of 0.002 – 0.1 Hz.
3.4 Model Accretion Disk Fits to the Spectra
We generated a grid of steady-state accretion disk model spectra to compare to the UV-optical spectrum of V348 Pup. The disk spectra were constructed from summed, area-weighted, Doppler-broadened model atmosphere stellar spectra. The stellar spectra were used to model each accretion disk annulus, with each spectrum chosen to correspond to the theoretical, steady-state accretion disk temperature and gravity of that annulus. For a detailed description of this procedure, see Long et al. (1994). The stellar spectra were created using the model atmosphere and spectral synthesis codes of Hubeny, TLUSTY and SYNSPEC (Hubeny, 1988; Hubeny, Lanz, & Jeffery, 1994). For temperatures below 12,000 K, we used the ATLAS model atmospheres of Kurucz (1993). The stellar atmosphere grid spans a temperature range of 4000 – 100,000 K and of 2.0 – 8.5. From these, we created model accretion disk spectra with accretion rates of = 15.0 – 19.0 g s-1 in increments in the log of 0.2.
For the geometry of the system, we adopted the parameters of Rolfe, Haswell, & Patterson (2000) and Rodríguez-Gil et al. (2001), who agree on the values for which they overlap. We set = 0.31, , , and = 2.44 hr. We set , based on a standard WD mass-radius relation (Nauenberg, 1972). The distance to V348 Pup is unknown, so we fixed the distance in the models at 100 pc. The normalization of the models to the observed flux will give a distance for a given model and accretion rate, but without a distance estimate we do not have independent information on the best fit model from the spectral shape and the flux. There are no previous estimates of the interstellar reddening along the line of sight to V348 Pup, so the reddening E(B–V) was left as a free parameter in the fits. There is evidence that the reddening to V348 Pup is not very high: a dust map of the sky (with a resolution of ) indicates that the total extinction looking out of the Galaxy in the direction of V348 Pup is E(B–V) = 0.216 (Schlegel et al. 1998; calculated using the NASA/IPAC Extragalactic Database).
The accretion disk models are circular, not elliptical, which differs from the actual geometry of the disk in V348 Pup, at least in its outermost radii (Rolfe, Haswell, & Patterson, 2000). Moreover, Rolfe, Haswell, & Patterson (2000) show that the size and the ellipticity of the disk varies over the superhump cycle. As a result, we tested two disk sizes in our models. In the first, we used a disk that has a large inner radius () and an outer radius that extends to the tidal cut-off radius, , to mimic the Rolfe et al. disk parameters. Second, we used a more “standard” disk whose inner edge reaches to the WD surface () and that has a smaller outer radius, , the circularization radius of the disk (Frank, King, & Raine, 1992). We fit the models by least squares to a concatenation of the grating and prism out-of-eclipse spectra (switching between settings at 2500 Å), and excluded strong emission lines from the fit.
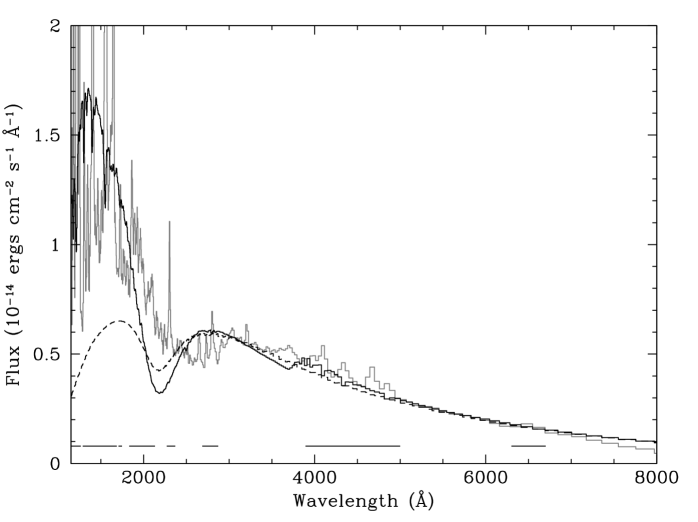
Figure 10 shows the best fit accretion disk model when the Rolfe et al. disk size is used. The model has a mass accretion rate of , a reddening E(B–V) = 0.40, and a normalization N = 0.04, which gives a distance of 500 pc for a disk with this flux and accretion rate. The model fit to the data is poor both qualitatively and statistically (). The maximum allowed accretion rate is selected, primarily to weaken the amplitude of the Balmer jump, although it remains larger in the model than in the observed spectrum. Despite the large reddening, the model still exceeds the observed UV flux. Similar problems were encountered with fits to the UV-optical spectrum of UX UMa (Knigge et al., 1998). The reddening value also results in a prominent 2175 Å feature. As can be seen, the model 2175 Å feature is much deeper than the observed spectrum at that wavelength. It is also clear that interstellar reddening cannot explain the 2000 – 3000 Å dip in the observed spectrum, which is broader and comes to a minimum at a longer wavelength (2600 Å) than the 2175 Å reddening feature.
A change to the smaller accretion disk size fails to improve the fit. The fit is qualitatively similar to the previous fit and . The disk parameters are not the same, however: , E(B–V) = 0.50, and N = 0.16 (251 pc). The mass accretion rate drops and the reddening increases compared to the previous model because the “standard” disk extends to the surface of the WD, which results in more disk emission in the blue. The UV emission still exceeds the observed UV continuum flux and the resulting 2175 Å feature dips 60% below the observed flux at that wavelength.
In order to distinguish between possible problems with the assumption of a steady-state disk dominating the continuum and problems with the use of stellar spectra to model the disk, we also show in Figure 10 the best-fit accretion disk spectrum when the disk is modeled as a sum of blackbodies at each annulus rather than stellar spectra. The model parameters are , E(B–V) = 0.18, and N = 0.06 (419 pc). The fit to the spectrum is improved ( = 212), mainly because of a lack of a Balmer jump and less UV emission in the blackbody model. The accretion rate and reddening are also at lower, less extreme values. Nevertheless, the fit to the observed spectrum remains poor. The reddening dip at 2175 Å is still too large, and the model overshoots the observed flux around 2500 – 3500 Å. In this case, the UV flux is too low rather than too high compared to the observed spectrum.
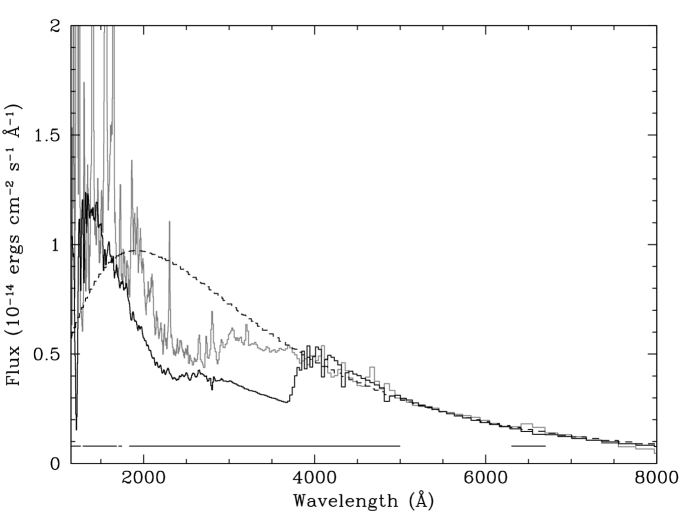
Since the observed spectral dip and lack of a Balmer jump are what drove the model disk fits to their extreme parameter values, we also tested fits to the spectrum in which we masked out all wavelengths between 2000 and 5000 Å. The best fit in this case (again, for the Rolfe et al.-like disk) is shown in Figure 11. The model parameters are , E(B–V) = 0.11, and a normalization N = 0.06, giving a distance of 415 pc. The is 70. Outside of the Balmer jump region, this fit is better than the previous model fits. The UV flux is more consistent with the observed level, and the lower reddening gives a near-UV slope and weak 2175 Å feature that is also closer to that observed. Unfortunately, this model also has a Balmer jump in which the flux drops by a factor of two, when no Balmer jump is observed. When the “standard”, disk is used, the fit is qualitatively similar, but the parameters are , E(B–V) = 0.001, and a normalization N = 0.39 (160 pc). is 59. As a result, even if we are inclined to ignore problems with the Balmer jump and accept these models, we cannot constrain the mass accretion rate to better than a factor of 64 without knowing more about the structure of the disk or the distance to the system.
Finally, we also show in Figure 11 the model fit for the “standard disk” when the disk is constructed from sums of blackbodies. The model parameters are , E(B–V) = 0.002, and N = 0.05 (456 pc). . The mass accretion rate and normalization are similar to those of the disk model constructed from sums of stellar spectra, but the smaller UV flux of the blackbody model results in a lower, effectively zero, reddening. The model is a reasonable fit to the UV and red optical fluxes, and there is by definition no Balmer jump problem, but the model overshoots the observed spectrum in the region of the dip, 2000 – 3500 Å.
4 Discussion
One notable characteristic of the depth of the eclipse in V348 Pup is its relative flatness over the UV-optical range. The depth of the continuum eclipse at 1300 Å is the same as the eclipse depth at 5500 Å, and the fraction of the out of eclipse flux occulted only drops slightly (5%) at longer wavelengths. Because NL CVs do not show outbursts, their accretion flow is assumed to be largely steady (leaving aside intermittent low states, which do not concern us here). The theoretical radial temperature profile of a steady-state disk shows a decline in disk temperature with increasing disk radius, with (Pringle, 1981). The high viewing inclination of V348 Pup () ensures that the central plane of the inner disk is fully occulted at mid-eclipse. Therefore, the eclipse of a steady-state disk should be deeper at shorter wavelengths as the hotter parts of the disk are fully occulted, while the cooler, outer disk is uneclipsed. This is not the case in the eclipse of V348 Pup.
The shape of the eclipse light curves bolsters this point. The light curves in V348 Pup are largely V-shaped, particularly in contrast to the smooth, U-shaped eclipses of UX UMa. V-shaped eclipses are indicative of the eclipse of a disk with a flat temperature distribution; this deviation from the expected steady-state temperature profile has been seen in other NLs of the SW Sex subclass (e.g., Rutten et al. 1992). Finally, the poor fits of theoretical steady-state accretion disk models to the time-averaged spectrum of V348 Pup indicate that the continuum is not well described by this model. Admittedly, there have been problems fitting disk models created from sums of stellar spectra in other systems in which the continuum is believed to be dominated by steady-state accretion disk emission (such as UX UMa), but in our modeling, even theoretical spectra created from sums of blackbodies failed to match the overall shape of the UV-optical continuum.
There are a couple of possibilities for why the continuum shape and eclipse are not consistent with the expected properties of a steady-state disk. The first is that the disk is not in a steady-state. Rutten, van Paradijs, & Tinbergen (1992) offer several possibilities for the flat T(R) distribution is the SW Sex-type NLs they modeled, including disruption of the inner disk by the WD magnetic field, an extended boundary layer, or a substantial outflow. Another possibility, for which there is empirical evidence in a similar system, is that we are not viewing the inner disk because it is shielded. The NL DW UMa is a SW Sex star with the same inclination as V348 Pup. When DW UMa went into an optical low state, its UV flux actually increased (Knigge et al., 2000). Its normal UV spectrum is very similar to the UV spectrum of V348 Pup, while the UV spectrum in the optical low state was that of a WD. This led Knigge et al. to conclude that the WD and the inner disk are usually invisible in DW UMa, blocked by a self-occulting, flared accretion disk.
Because of the similarity in binary parameters, inclination, and spectral morphology between DW UMa and V348 Pup, this is an attractive scenario to explain the flat T(R) profile in V348 Pup as well. Indeed, Knigge et al. (2000) suggest that a self-shielding disk could be a defining characteristic of the SW Sex stars, most of which are eclipsing (although it should be reiterated that it is not clear if the preponderance of eclipsing systems among the SW Sex population is a characteristic of the class or is a selection effect). In V348 Pup, the absence of any WD ingress features in the light curves and the extreme UV excess (even with implausibly high reddening values) in the model disk fits support the idea that the inner disk and the white dwarf are shielded from view.
It is also clear that much of the material we see being eclipsed lies above the disk plane. Because of its high inclination, the inner annuli — , assuming and from Rolfe et al. 2000 and Rodríguez-Gil 2001 — and the back of the accretion disk are fully occulted in V348 Pup. However, it is the plane of the disk that is occulted; vertically extended material (), even at the center of the disk, will not be occulted at mid-eclipse. All of the emission lines show more shallow eclipses than those of the adjacent continuum, indicating that the vertical extent of the lines exceeds that of the continuum. The strongest UV lines, in particular, are only weakly eclipsed. Shallow or non-existent eclipses are a common characteristic of UV emission lines in CVs (Holm, Panek & Schiffer, 1982; Cordova & Mason, 1985; Drew & Verbunt, 1985). The extended line emission may originate in wind outflows and/or a vertically extended disk chromosphere. It is notable that the asymmetry of the UV lines in eclipsed light is seen in the strongest lines in the spectrum, which also show the weakest eclipses. These lines likely have the largest vertical extension of line emission above the disk, such that we continue to see scattered red-shifted emission from the outflowing gas even as the parts of the line nearest the disk are occulted.
The broad spectral dip extending from 2000 – 3000 Å is, like the line emission, eclipsed less than the continuum, suggesting that the source of the dip is also vertically extended with respect to the accretion disk continuum. The dip is similar to a feature seen in the spectrum of the eclipsing dwarf nova, OY Car. Horne et al. (1994) successfully modeled the dip in OY Car as absorption of the underlying continuum by an “Fe II curtain” of vertically extended, veiling gas. The 2000 – 3000 Å dip is not seen in the FOS spectrum of the lower-inclination system UX UMa, but it appears to be present in DW UMa. The continuum V348 Pup is also not as blue as in UX UMa, although the emission lines are stronger. All of these differences are consistent with inclination effects. The redder continuum in V348 Pup is probably a result of greater shielding of the inner disk in the higher-inclination system.
There is little in our observations to distinguish V348 Pup, a rare disk-accreting NL CV found in the period gap, from longer period NL CVs. It has been proposed that V348 Pup is a magnetic CV (Tuohy et al., 1990). If true, then its orbital period would place it near the important phase of synchronization of the WD rotation and orbital periods in some evolutionary models of magnetic CVs (Webbink & Wichramasinghe, 2002). We find no evidence in these observations to support the V348 Pup as a magnetic CV, however. In particular, we did not find any periodic variability that would signal the presence of a magnetic WD (although it is certainly possible that a self-shielding disk could hide the signature of a magnetic WD). Rather, in its UV-optical spectrum and eclipse behavior, V348 Pup behaves as a typical SW Sex system. Unfortunately, the poor model accretion disk fits to the observed spectrum preclude a determination of the mass accretion rate in V348 Pup, which may have indicated whether there are differences between luminous period gap CVs and their brethren outside of the gap.
5 Conclusions
We have obtained high time series, moderate to low spectral resolution, UV and optical spectrophotometry of the eclipsing NL V348 Pup. Three of the observations in each setting were obtained through eclipse while one observation in each setting covered the orbital phases after the eclipse. The results of the observations are as follows:
-
1.
The time-averaged spectrum outside of eclipse shows a steady rise in flux to shorter wavelengths, although there is a broad spectral dip extending from 2000 – 3000 Å. Superposed on the continuum are strong emission lines of H I, He II, and resonance and excited state transitions of ionized metals. There were no gross changes in the shape or flux of the spectrum over the 6 days of our observations.
-
2.
The continuum eclipse is relatively flat over the UV-optical spectral range; 55% – 60% of the out of eclipse continuum flux is occulted at mid-eclipse at most wavelengths. The eclipse is more shallow in the 2000 – 3000 Å trough, where 45% – 50% of flux is eclipsed. The eclipse light curves in the continuum are wide and V-shaped. There is little change in eclipse shape with wavelength, although the eclipses at the reddest wavelengths are slightly broader and shallower than the eclipses in the blue and UV. The eclipses are largely featureless; in particular, there is no sign of the eclipse of the WD in any of the light curves.
-
3.
All of the emission lines remain present in eclipse. All of the lines show a more shallow eclipse than the nearby continuum. The strongest UV lines show the least amount of occultation during eclipse. For most of the emission lines, the eclipse is symmetric about the line centers and the line profile does not change in eclipse, but in C IV 1550 Å the eclipse is skewed to wavelengths blue of the line peak, while the red component of the line becomes stronger at mid-eclipse. There is also a mild asymmetry toward a weaker eclipse at red velocities in C III 1175 Å and 1855 Å, and Si IV 1393,1402 Å.
-
4.
Spectra pre- and post-eclipse show that most of the emission lines and the blue continuum are weaker after eclipse than before. The dip in the spectrum from 2000 – 3000 Å is also deeper after eclipse than before.
-
5.
Flickering is strong in the observations. Typical flickers last from 1 – 3 minutes, and range from 5% – 15% in excess of the local flux levels. A flickering spectrum shows that flickering occurs only in the continuum and that the flickering source is qualitatively well fit by a 15,000 K blackbody spectrum. We did not detect any periodicites associated with the variability.
-
6.
Model steady-state accretion disk spectra give poor fits to the shape of the UV-optical spectrum. Disk spectra constructed from sums of stellar spectra are too strong in the UV and have Balmer jumps well in excess of the observed feature. Disk spectra constructed from sums of blackbodies do not have these problems, but they are still poor fits to the shape of the observed spectrum. The 2000 – 3000 Å dip, in particular, is not fit by the model disk spectra. Due to its width and the wavelength of its minimum, this feature is not attributable to reddening.
-
7.
The UV-optical properties of V348 Pup near and through eclipse are consistent with the behavior of SW Sex type NL CVs, and support the identification from Rodríguez-Gil et al. (2001) of V348 Pup as a member of this class. The high inclination, shallow and flat eclipse, and similarity to the spectrum of DW UMa suggest that the accretion disk is self-occulting, blocking a line of sight view of the inner disk and the WD. The broad spectral dip is consistent with the presence of a vertically-extended, absorbing “Fe II curtain” in the system. The UV-optical eclipse observations do not reveal any characteristics of the system to explain its location in the period gap. There are no periodicities in the light curves to indicate the presence of a magnetic WD.
References
- Araujo-Betancor et al. (2003) Araujo-Betancor, S., et al. 2003, ApJ, 583, 437
- Baptista et al. (1998) Baptista, R., Horne, K., Wade, R. A., Hubeny, I., Long, K. S., & Rutten, R. G. M. 1998, MNRAS, 298, 1079
- Baptista et al. (1996) Baptista, R., Patterson, J., O’Donoghue, D., Buckley, D., Jablonski, F., Augusteijn, T., & Dillon, W. 1996, IAU Circ., 6327, 1
- Baptista et al. (1995) Baptista, R., Horne, K., Hilditch, R. W., Mason, K. O., & Drew, J. E. 1995, ApJ, 448, 395
- Cordova & Mason (1985) Cordova, F. A. & Mason, K. O. 1985, ApJ, 290, 671
- Drew & Verbunt (1985) Drew, J. & Verbunt, F. 1985, MNRAS, 213, 191
- Eracleous & Horne (1994) Eracleous, M. & Horne, K. 1994, ApJ, 433, 313
- Frank, King, & Raine (1992) Frank, J., King, A., & Raine, D. 1992, Accretion Power in Astrophysics (Cambridge: Cambridge University Press)
- Holm, Panek & Schiffer (1982) Holm, A. V., Panek, R. J. & Schiffer, F. H., III 1982, ApJL, 252, L35
- Horne et al. (1994) Horne, K., Marsh, T. R., Cheng, F. H., Hubeny, I., & Lanz, T. 1994, ApJ, 426, 294
- Horne & Steining (1985) Horne, K. & Steining, R. F. 1985, MNRAS, 216, 933
- Hubeny (1988) Hubeny, I. 1988, Comput. Phys. Commun. 52, 103
- Hubeny, Lanz, & Jeffery (1994) Hubeny, I., Lanz, T., & Jeffery, C. S., in Newsletter on Analysis of Astronomical Spectra (St. Andrews: St. Andrews Univ.), 20, 30
- Knigge et al. (2000) Knigge, C., Long, K. S., Hoard, D. W., Szkody, P., & Dhillon, V. S. 2000, ApJ, 539, L49 DW UMa
- Knigge et al. (1998) Knigge, C., Long, K. S., Wade, R. A., Baptista, R., Horne, K., Hubeny, I., & Rutten, R. G. M. 1998, ApJ, 499, 414
- Kurucz (1993) Kurucz, R. 1993, ATLAS9 Stellar Atmosphere Programs and 2 km/s grid. Kurucz CD-ROM No. 13. Cambridge, Mass.: Smithsonian Astrophysical Observatory, 1993., 13
- Long et al. (1994) Long, K. S., Wade, R. A., Blair, W. P., Davidsen, A. F., & Hubeny, I. 1994, ApJ, 426, 704
- Nauenberg (1972) Nauenberg, M. 1972, ApJ, 175, 417
- Pringle (1981) Pringle, J. E. 1981, ARA&A, 19, 137
- Rappaport, Verbunt, & Joss (1983) Rappaport, S., Verbunt, F., & Joss, P. C. 1983, ApJ, 275, 713
- Rodríguez-Gil et al. (2001) Rodríguez-Gil, P., Martínez-Pais, I. G., Casares, J., Villada, M., & van Zyl, L. 2001, MNRAS, accepted
- Martínez-Pais, Rodríguez-Gil, & Casares (1999) Martínez-Pais, I. G., Rodríguez-Gil, P., & Casares, J. 1999, MNRAS, 305, 661
- Rolfe, Haswell, & Patterson (2000) Rolfe, D. J., Haswell, C. A., & Patterson, J. 2000, MNRAS, 317, 759
- Rutten, van Paradijs, & Tinbergen (1992) Rutten, R. G. M., van Paradijs, J., & Tinbergen, J. 1992, A&A, 260, 213
- Rosen, Clayton, Osborne, & McGale (1994) Rosen, S. R., Clayton, K. L., Osborne, J. P., & McGale, P. A. 1994, MNRAS, 269, 913
- Schlegel et al. (1998) Schlegel, D. J., Finkbeiner, D. P., & Davis, M. 1998, ApJ, 500, 525
- Smak (1994) Smak, J. 1994, AcA, 44, 59
- Spruit & Ritter (1983) Spruit, H. C., & Ritter, H. 1983, A&A, 124, 267
- Szkody (1987) Szkody, P. 1987, AJ, 94, 1055
- Thorstensen et al. (1991) Thorstensen, J. R., Ringwald, F. A., Wade, R. A., Schmidt, G. D., Norsworthy, J. E. 1991, AJ, 102, 272
- Tuohy et al. (1990) Tuohy, I. R., Remillard, R. A., Brissenden, R. J. V., & Bradt, H. V. 1990, ApJ, 359, 204
- Warner (1995) Warner, B. 1995, Cataclysmic Variable Stars (Cambridge:Cambridge University Press)
- Webbink & Wichramasinghe (2002) Webbink, R. F. & Wichramasinghe, D. T. 2002, MNRAS, 334, 1

a
| Run | Date | Start | End | Phase RangeaaOrbital phasing based on the photometric ephemeris of Baptista et al. (1996). We have shifted the absolute phasing by 0.024 cycles to bring the eclipses symmetric about phase 0. | Spectra ObtainedbbEach spectrum has an exposure time of 4.28 sec, with 0.1 sec of dead time between exposures. | Detector |
|---|---|---|---|---|---|---|
| (1996) | (UT) | (UT) | (Cycles) | |||
| 1 | Sept 11 | 19:11:08 | 19:51:23 | 0.91 – 1.20 | 578 | PRISM |
| 2 | Sept 14 | 18:04:49 | 18:43:30 | 0.91 – 1.18 | 542 | G160L |
| 3 | Sept 14 | 22:55:50 | 23:23:27 | 0.90 – 1.16 | 527 | PRISM |
| 4 | Sept 15 | 03:44:22 | 04:23:03 | 0.86 – 1.13 | 542 | G160L |
| 5 | Sept 15 | 21:28:24 | 22:06:01 | 0.12 – 0.38 | 527 | PRISM |
| 6 | Sept 16 | 02:17:04 | 02:55:45 | 0.09 – 0.36 | 542 | G160L |
| 7 | Sept 17 | 12:06:38 | 12:44:15 | 0.93 – 1.19 | 527 | PRISM |
| 8 | Sept 17 | 21:44:26 | 21:23:07 | 0.87 – 1.14 | 542 | G160L |