Globular Cluster Luminosity Function 11institutetext: Astronomy Group, Departamento de Física, Universidad de Concepción, Casilla 160-C, Concepción, Chile
The Globular Cluster Luminosity Function: New Progress in Understanding an Old Distance Indicator
Abstract
I review the Globular Cluster Luminosity Function (GCLF) with emphasis on recent observational data and theoretical progress. As is well known, the turn-over magnitude (TOM) is a good distance indicator for early-type galaxies within the limits set by data quality and sufficient number of objects. A comparison with distances derived from surface brightness fluctuations with the available TOMs in the V-band reveals, however, many discrepant cases. These cases often violate the condition that the TOM should only be used as a distance indicator in old globular cluster systems. The existence of intermediate age-populations in early-type galaxies likely is the cause of many of these discrepancies. The connection between the luminosity functions of young and old cluster systems is discussed on the basis of modelling the dynamical evolution of cluster systems. Finally, I briefly present the current ideas of why such a universal structure as the GCLF exists.
1 Introduction: What is the Globular Cluster Luminosity Function?
Since the era of Shapley, who first explored the size of the Galaxy, the distances to globular clusters often set landmarks in establishing first the galactic, then the extragalactic distance scale. Among the methods which have been developed to determine the distances of early-type galaxies, the usage of globular clusters is one of the oldest, if not the oldest. Baum baum55 first compared the brightness of the brightest globular clusters in M87 to those of M31. With the observational technology improving it became possible to reach fainter globular clusters and soon the conjecture was raised that the distribution of absolute magnitudes of globular clusters in a globular cluster system exhibits a universal shape, which can be well approximated by a Gaussian:
where dN is the number of globular clusters in an apparent magnitude bin , is the ”Turn-Over Magnitude” and the width of the Gaussian distribution. Also a representation by a ”t5-function”
introduced by Secker secker92 found a wide-spread application.
This distribution is called the ”Globular Cluster Luminosity Function”. In the following ”Globular Cluster Luminosity Function“ is abbreviated by GCLF, ”Turn-Over Magnitude“ by TOM, and ”Globular Cluster System“ by GCS.
The conjecture that the GCLF is very similar in different galaxies, in particular that the absolute magnitude of the TOM has an almost universal value, has been first suggested by Hanes hanes77 (but also see the references in this paper). The reviews of Harris & Racine hara79 , Hanes hanes79 , Harris harris91 , Jacoby et al. jacoby92 , Ashman & Zepf ashman98 , Whitmore whitmore97b , Tammann & Sandage tammann99 , and Harris harris01 demonstrated both the solidity and the limitations of this conjecture. They also show the progress which has been achieved during the past 20 years both in terms of the number of investigated GCSs and the accuracy of an absolute calibration.
The GCLF as a distance indicator has seen little application to spiral galaxies for several reasons: their GCSs are distinctly poorer than those of giant ellipticals, the identifications of clusters is rendered more difficult by the projection onto the disk, and the presence of dust causes inhomogeneous extinction. The investigation of GCSs of ellipticals or S0-galaxies is much easier due to the homogeneous light background, the richness, and the absence of internal extinction.
The application of GCLFs as distance indicators for early-type galaxies has a simple recipe: Given appropriately deep photometry of the host galaxy, identify GC candidates, as many as you can. In most cases this has to be done statistically by considering only objects with GC-like colors and by subtracting a hopefully well determined background of sources. Then measure their apparent magnitudes, draw a histogram and fit a suitable function, for instance a Gaussian, to determine the apparent TOM. Under the assumption that every GCS has the same absolute TOM, one can use the galactic system and/or the M31 system to calibrate it in terms of absolute magnitudes. Real data, however, make the derivation of the TOM somewhat more difficult, which will be discussed below. The most important restriction is probably that we can follow the GCLF down to faint clusters only in two galaxies, the Milky Way and Andromeda.
There is no physical reason why the GCLF should be a Gaussian or a t5-function. On the contrary, we shall later on learn about physical reasons why it is not a Gaussian. Closer scrutiny of the galactic cluster system indeed shows that its GCLF is not symmetric in that it exhibits an extended wing beyond the TOM for smaller masses (for example see Fig.2 of Fall & Zhang fall01 ). But Gaussians empirically are fair descriptions for the bright side and most observations of GCLFs of distant galaxies seldomly reach more than 1 mag beyond their TOMs, so this asymmetry is not relevant for measuring the TOM.
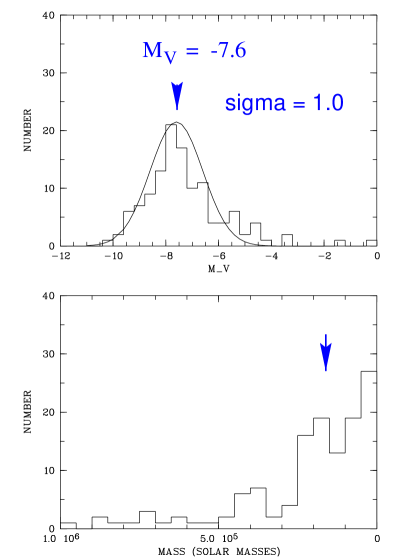
Fig. 1 shows the GCLF for the galactic system (upper panel). It has been constructed on the basis of the ”McMaster-catalog” (Harris harris96 ) using the horizontal branch (HB) brightness as the distance indicator and adopting the relation (Demarque et al. demarque00 ). The Gaussian fit results in for the TOM and for the dispersion of the Gaussian. The lower panel shows a histogram of the masses, assuming M/L = 2, where the mass which corresponds to the TOM is indicated. In this linearly binned histogram, there is no striking feature at this mass. Indeed, the existence of a TOM is a consequence of the logarithmic magnitude scale in combination with a change of the power-law slope of the mass function. We come back to this in a later section.
Throughout this review, we shall consider only TOMs in the V-band, because most modern published data, particularly those from the Hubble Space Telescope, have been obtained in V. Other photometric systems, most notably the Washington photometric system (Geisler et al. geisler96 , Ostrov et al. ostrov98 , Dirsch et al. dirsch03 ) have been used for the investigations of GCSs as well.
Given the previous excellent reviews on GCLFs as distance indicators, what can be the scope of this contribution? A lot of new data has been published during the last years and it is now possible to compare GCLFs of early-type galaxies with other distance indicators on the basis of a much larger sample than has been possible before. The outstanding publication here is the catalog of distances based on surface brightness fluctuations (SBFs) (Tonry tonry01 ). We shall see that the absolute calibration of GCLFs indeed agrees very well with that of SBFs, demonstrating that most GCSs of elliptical or S0-galaxies show absolute TOMs which are not distinguishable within the uncertainties of the measurements. Nevertheless, many discrepancies between GCLF distances and SBF distances exist. These galaxies are of particular interest and we shall discuss them as well.
Beyond the usefulness of the GCLF as a distance indicator is the question why there exists such a remarkably universal structure. Is there a universal formation law for globular clusters, which operates in the same way in such different galaxies as the Milky Way and giant ellipticals? This problem has to do with the initial mass function of globular clusters and the evolution of GCSs. Much progress has been achieved during the last years, on which we will also report.
2 Sources of uncertainty
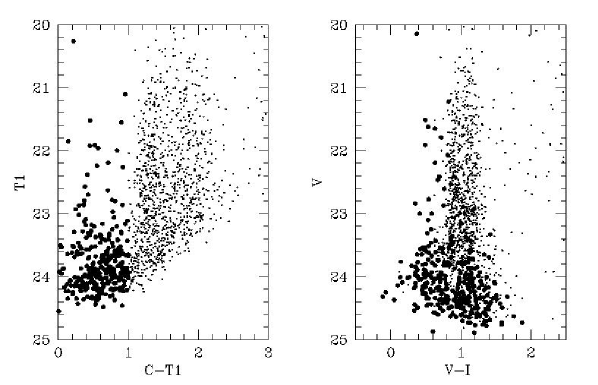
To begin with difficulties: Even if we trust the universal TOM, the actual measurement may appear straightforward according to the above recipe, but nevertheless one encounters many sources of uncertainty. The identification of GCs as resolved objects from the ground is only possible for the nearest early-type galaxies, for example NGC 5128 (Rejkuba rejkuba01 ). Unfortunately, no modern investigation of the GCLF of NGC 5128 exists until now. Observations with the Hubble Space Telescope can resolve the largest clusters in galaxies as distant as about 20 Mpc (e.g. Kundu & Whitmore kundu01 , kundu01b , Larsen et al. larsen01 ). Therefore, the identification by ground-based observations normally has to use color criteria and the statistical discrimination against a ”background”, which actually may consist of foreground stars and of unresolved background galaxies. That the latter contamination is a strong function of the color system used, is nicely shown in Fig. 2, taken from Dirsch et al. dirsch03 , which compares the color magnitude diagrams V-I and Washington C-T1 for the GCS of NGC 1399, the central galaxy in the Fornax cluster. The C-T1 color recognizes many background galaxies, which have an excess flux in the blue band C, while they are not noticable in V-I, a color which has been widely used in HST investigations.

The nearest large galaxy clusters (Virgo and Fornax) have distance moduli of about 31. Thus, TOMs for GCSs at this distance and beyond will generally be fainter than V=23.5, where the photometric incompleteness (depending on the data quality) plays an increasingly dominant role. Then there are the factors of the numbers of found GCs and the distance itself: If the photometry does not reach the TOM and/or the GCS is not very rich, the resulting TOM is naturally less well defined than in the case of a nearby, rich GCS. Then it may depend on the adopted shape of the luminosity function. However, empirically the derived TOM is not very sensitive to whether a t5-function or a Gaussian is used, at least not in the case of well observed GCLFs (e.g. see Della Valle et al. della98 for the GCLF of NGC 1380).
Moreover, the width of the adopted fitting function can be left free or can be fixed. Larsen et al. larsen01 performed t5-function fits to their sample of 14 early-type galaxies both with the width as a fit parameter and with a fixed with of mag. To gain an impression of the effect on the TOM, we show Fig.3, where the TOM corresponding to a free width is plotted versus the difference TOM(var)-TOM(nonvar). Leaving the two outliers NGC 1023 and NGC 3384 aside, the standard deviation of the differences is 0.13 mag. Then there are different ways to fit, for example maximum likelihood methods or direct fits.
One must also not forget the uncertainty of the foreground absorption and another factor which is difficult to nail down: the photometric calibration of the respective data set and the actual realization of the used photometric standard system.
The above error sources are always there, even if the TOM would be strictly universal, which one would not expect: For a given mass the luminosity of a GC depends on its metallicity in the sense that metal-poor clusters are brighter in the optical (e.g. Girardi girardi02 ), but the metallicity distribution within a cluster system is not expected to be the same for all early-type galaxies. So one should principally correct for this as well (Ashman et al. ashman95 ). There is also empirical evidence for a metallicity dependence of the TOM: Larsen et al. larsen01 find by HST observations in V and I of a sample of 15 early-type galaxies the TOMs for red clusters to be fainter than those for blue clusters by mag, which is somewhat larger than predicted by theory. However, as we shall see, it is possible that part of this difference is due to an intrinsically fainter TOM of the red cluster population, so it is difficult to quantify the metallicity effect.
Also if the initial cluster mass distribution would be the same in all galaxies, destruction processes like disk shocking or evaporation are expected to act differently in different environments and may create intrinsically varying TOMs (see section 10 for this topic). Last, but not least, one has to assume that the members of a GCS all have the same old age, while we shall see that the number of examples where this is not the case is growing.
Given all these possible error sources, it may come as a surprise that GCLFs seem to work so well as distance indicators, and it is plausible that an accuracy of, say, 0.2 mag or less can only be achieved in the case of rich GCSs and a high quality dataset.
3 The Galaxy and M31
The two massive galaxies where the GCLF can be best observed down to faint clusters are the Milky Way and M31. A calibration of the absolute TOM therefore via these galaxies always has to face the caveat that both are spiral galaxies and the application to early-type galaxies may not be justified. However, as we will see, the zero-point gained from using the Galaxy and M31 as fundamental calibrators is in very good agreement with the one obtained from the comparison with the method of surface brightness fluctuations (Tonry et al. tonry01 ), which at present offers the largest and most homogeneous catalog of distances to early-type galaxies.
The history of the investigations of the galactic GCS and that of M31 involves the work of many people. To be short, we refer the reader to Harris harris01 and Barmby et al. barmby01 (and references therein) for the Galaxy and M31, respectively. Harris harris01 quotes for the galactic TOM and . Barmby et al. barmby01 quote for the apparent TOM of the M31 system and . The distance modulus of M31 is (Freedman & Madore freedman91 ), which translates into an absolute TOM of . The weighted average of these two TOMs is , which we will compare with the distance moduli derived from surface brightness fluctuations.
4 The data
During the last few years, many new TOMs of early-type galaxies in the V-band have been published. The majority of them are based on HST observations and stem from the papers by Kundu & Whitmore kundu01 , Kundu & Whitmore kundu01b , and Larsen et al. larsen01 . Other new papers on individual galaxies are from Okon & Harris okon02 , Kavelaars et al. kavelaars00 , Woodworth & Harris woodworth00 , Drenkhahn & Richtler drenk99 . For TOMs published earlier we refer the reader to the compilation of Ferrarese et al. ferra00 and references therein. As mentioned above, the main problem with such a data set is its inhomogeneity for a variety of reasons. For example, Kundu & Whitmore kundu01 and Kundu & Whitmore kundu01b fitted Gaussians with both variable and fixed dispersions (1.3 mag) to their GCLFs. We adopt their TOMs resulting from the fixed dispersions because of the larger number of galaxies included, leaving out a few TOMs with very large uncertainties. Larsen et al. larsen01 fitted t5-functions with both non-variable and variable widths, from which we adopt the latter because the scatter of the dispersions points to real differences. However, the TOMs are not strongly influenced by whether the dispersions are fitted or keep fixed. Since we are interested rather in the bulk properties of the available data than in hand-selected data according to certain quality criteria, we included also work which was mentioned but rejected by Ferrarese et al.
We end up with 102 TOMs (corrected for foreground extinction and including a few double and triple measurements) in the V-band for 74 galaxies, which should be almost complete from the present day back to 1994.
5 The Hubble diagram

Can we say something about the Hubble constant from our data set, assuming that the TOM indeed has the universal value of , adopted from the Milky Way and M31? A set of standard candles whose redshifts are only due to their recession velocities give a straight line in the Hubble diagram when their apparent magnitudes (their TOMs in our case) are plotted versus their redshifts according to
where is the Hubble constant in units of km/s/Mpc and M the constant absolute magnitude of the standard candles.
The upper panel of Fig.4 shows the Hubble diagram for our entire database. The velocities of the host galaxies have been individually related to the microwave background (which of course is not a good approach). It is obvious that such a diagram is not suitable for deriving the Hubble constant. Many objects show radial velocities which are simply not in the Hubble flow, most strikingly for NGC 4406 (which is represented by the double measurement with the lowest velocity). If we select galaxies with log and furthermore only those with uncertainties less than 0.3 mag, we end up with about 20 galaxies. If these galaxies are used to calculate the zero point in the Hubble relation, it gives a Hubble constant of 83 km/s/Mpc, adopting a TOM of mag. It is clear that one cannot be content with this. Standard candles in a Hubble diagram should define a straight line with a slope of 5, whereas the slope in this diagram is clearly steeper. To resolve this discrepancy, one has to carefully look into each individual GCS, select those TOMs with the highest degree of trustworthiness, and then investigate the recession velocities of individual galaxies. The measured radial velocities of galaxies within the space volume under consideration may not be good indicators for their recession velocities due to the existence of large scale peculiar motions, which are under debate (e.g. Tonry et al. tonry00 ).
Following Kavelaars et al. kavelaars00 , a better way might be to consider only groups of galaxies, average the TOMs and assign a recession velocity to each group. Kavelaars et al. use the Virgo, the Fornax and the Coma cluster and arrive at km/s/Mpc for the Hubble constant. But to fix the recession velocities even for these three galaxy clusters is far from trivial.
To avoid very lengthy discussions, a better way of deriving the Hubble constant is perhaps the use of standard candles which are so distant that peculiar velocities act only as minor perturbations of the Hubble flow, i.e. the Hubble diagram of Supernovae Ia (Freedman et al. freedman01 ).
6 The comparison with surface brightness fluctuations

To evaluate the accuracy and reliability of the method of the GCLF, we must compare it with other distance indicators of early-type galaxies. This results in a complicated task, if one’s objective is to select the most reliable measurements, to quantify possible biases inherent to different methods, and to discuss the uncertainties claimed by the authors. See for example Ferrarese et al. ferra00 , who conclude that GCLFs do not provide reliable distances, mainly based on a deviating distance to the Fornax cluster, and Kundu & Whitmore kundu01 , who contrarily find GCLF distances as least as accurate as distances from surface brightness fluctuations. We do not want to follow these lines but rather investigate what can be seen from the entirety of TOMs if they are compared with a distance indicator which provides distances to most of our GCSs.
Today, the most homogeneous and largest sample of distances to early-type galaxies is the catalog resulting from the survey of surface brightness fluctuations (SBFs) (Tonry et al. tonry01 ; see also the preceding papers by Tonry et al. tonry97 , Blakeslee et al. blakeslee99 , and Tonry et al. tonry00 ) which contains distances to about 300 galaxies. Therefore we restrict ourselves to a comparison with this important distance indicator. Basically, it analyzes that part of the pixel-to-pixel scatter of a CCD image of an early-type galaxy which is caused by the finite number of bright unresolved stars covered by each CCD pixel. These fluctuations of the surface brightness are large for nearby galaxies and small for more distant galaxies.
Fig. 5 plots for all galaxies in our database (irrespective of whether there are double or triple measurements) the TOM versus its difference to the distance moduli from Tonry et al. tonry01 . The error bars of the differences simply are the square roots of the quadratic sums of the uncertainties in the GCLF and SBF distance moduli. The first impression seems to be somewhat discouraging. Where we would have expected to see a horizontal line at an ordinate value of -7.5 with some scatter, we see a large spread with often dramatic devations, particular for the fainter TOMs. What is striking is that the deviating galaxies do not scatter symmetrically around a mean value, but that the faint TOMs give systematically larger distance moduli than do the SBFs. A direct and naive conclusion could be that perhaps the very faint TOMs are observationally not reached and that an extrapolation from the bright end of the luminosity function to the TOM gives a TOM which is systematically too faint. In fact this is not the case and the strongly deviating TOMs belong to interesting galaxies (we come back to this point).
But also at the bright end there are irritations. The deviating galaxy at -8.6 is NGC 4565, and even the one with the brightest TOM, the Sombrero galaxy NGC 4594, does not fit very well to our assumed universal value. Both are the only spiral galaxies in our sample. We note that the GCS of NGC 4565 is very poorly populated (Fleming et al. fleming95 ), so this deviation might not bear much significance.
7 Absolute TOMs and the distances to Virgo and Fornax
However, if we select according to the quoted uncertainties, the situation starts to look better. The lower panel of Fig.5 plots all galaxies where the uncertainties of both the SBF distance and the TOM according to the various authors are lower than 0.2 mag. The dispersion of the scatter is 0.25 mag and thus is compatible with the claimed selection. Thus we can confirm the statement by Kundu & Whitmore kundu01b that the GCLF distances, at least for the sample under consideration, are not less accurate than the SBF distances. The mean difference is -7.51 mag with a dispersion of 0.24 mag and thus in excellent agreement with the zero-points coming from the Milky Way and from M31. These three zero-points give a weighted mean of .
The average TOM of 8 galaxies in the Fornax cluster is 23.79 mag with a dispersion of 0.17 mag, the one for the Virgo cluster (16 galaxies) is 23.62 with a dispersion of 0.16 mag, which translate into distance moduli for Fornax and Virgo of and , respectively. The corresponding distance moduli from the SBFs are and . A discussion of the absolute calibration is not our objective. However, we can conclude that indeed many GCLFs can provide good distances but one is reluctant to label the GCLF ”universal” at this point because there are too many deviations with the SBF distances. We shall see that these deviations are apparently related to the existence of intermediate-age populations in early-type galaxies.
8 Deviations and intermediate-age populations
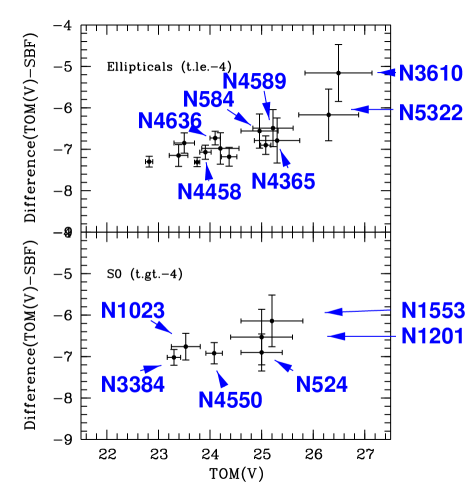
Like in human society, deviations from the norm may be sometimes more interesting and illustrative than reconciliation with it. Let’s look at Fig.6. Plotted are those TOMs which deviate from the ”universal” TOM by more than what is suggested by their uncertainties. Since we see from Fig. 5 that the scatter is by no means symmetric but that the most striking deviations prefer a TOM, which is systematically fainter than expected from the SBF distances, only these fainter TOMs are shown.
Among the elliptical galaxies, the largest deviation is shown by NGC 3610, admittedly with a large error. But more interesting is the fact that this galaxy violates one important condition for the TOM to be a viable distance indicator, namely that its GC population is old. NGC 3610 is known to host GCs of intermediate-age. Whitmore et al. whitmore97a and Whitmore et al. whitmore02 estimate an age of about 4-6 Gyr for the red (and presumably metal-rich) GCs which plausibly have their origin in a merger event (Schweizer & Seitzer schweizer92 ). However, many of the metal-rich clusters probably had been brought in by the progenitor galaxies. Strader et al. strader02 find among their sample of 6 metal-rich clusters only one with an age of 1-5 Gyr. But since the other clusters are located in the outer halo, this cannot strongly constrain the fraction of intermediate-age metal-rich clusters.
As we later shall discuss, the GCLF is expected to change its TOM, resulting in fainter TOMs for younger cluster populations. Indeed, Whitmore et al. whitmore02 find a TOM of for the blue clusters alone, while no TOM is visible at all for the red cluster population. This decreases the difference to the SBF distance, however, it still remains large. On the other hand, the existence of an intermediate-age population also influences the SBF distance by enhancing the fluctuation signal (mainly through the enhanced number of asymptotic giant branch stars) and thus would lead to a spuriously smaller distance without any correction term. Normally, the color V-I is used to correct for differences in the population (see Liu et al. liu00 and Blakeslee et al. blakeslee01 for a deeper discussion). Whether this correction is always sufficient or fails in some casesx, cannot be discussed here.
So the suspicion arises that a difference between the GCLF distance and the SBF distance may in general be produced by intermediate-age GCs. This conjecture indeed gets support by looking at other galaxies in Fig.6. Besides NGC 3610, younger clusters have been detected in NGC 4365 (Larsen et al. larsen02 , Puzia et al. puzia02 , also conjectured to be a merger remnant (Surma & Bender surma95 ). Note, however, that Davis et al. davies01 did not find evidence for intermediate-age populations from their integral-field spectroscopy in the galaxy iself.
Other ellipticals show strong -lines, indicating as well a younger population, and NGC 4636 hosted a supernova Ia, whose progenitors should also be of intermediate age (e.g. Leibundgut leib00 ).
However, there are also examples where the existence of an intermediate-age population is not supported by the present literature. For NGC 3379 and NGC 4472, the difference to the SBF distance is anyway marginal, perhaps still so for NGC 4660. The case of NGC 4291 is hard to assess because of the large uncertainties, but NGC 4473 and NGC 5846 pose a problem. The spectroscopic evidence for intermediate-age populations normally come from the central regions and it may be that the outer parts, from which the globular clusters are sampled, still host younger populations. The other possibility is that either the SBF distance or the TOMs are erroneous. In any case one has to wait for further observations.
Turning to the S0’s, NGC 1023 and NGC 3384 are perhaps candidates for hosting intermediate-age populations. Both galaxies show indications of star formation activity in their inner regions (Kuntschner et al. kuntschner01 , Sil’chenko silchenko99 ). However, the faint TOM of NGC 1023 does not seem to be related to intermediate-age clusters. Larsen & Brodie larsen00b identified beside the ”normal” compact GCs (both red and blue) a population of faint extended red GCs. The inclusion of these latter objects in the luminosity function is mainly responsible for the deviating position of NGC 1023. Leaving them aside results in a distance modulus well agreeing with the SBF distance. A similar finding is reported for NGC 3384 by Larsen et al. larsen01 . Brodie & Larsen brodie02 found that these faint extended clusters belong to the disk populations of their host galaxies and quote an age of at least 7 Gyr.
NGC 4550 contains two counterrotating stellar disks (Rix et al. rix92 ) and molecular gas has been detected by Wiklind & Henkel wiklind01 which is supposed to have its origin in a recent accretion event. Similarly striking findings are not reported for NGC 1553 or NGC 1201. However, both are shell galaxies (e.g. Longhetti et al. longhetti00 ), which hints at earlier interactions or mergers.
NGC 524 again is a supernova Ia host galaxy. The question whether the appearance of a supernova of type Ia in an early-type galaxy always indicates an intermediate-age stellar population is beyond the scope of this article, but a few remarks on GCSs of Ia host galaxies are appropriate. NGC 1316 in the Fornax cluster, a merger remnant and host to two SN Ia’s, has a GCS where 2-3 Gyr old clusters have been found, probably formed during the merger event (Goudfrooij et al. goud01a , goud01b ). Deep VLT and HST photometry does not reveal a TOM; the GCLF increases steadily down to beyond the observation limit (Grillmair et al. grillmair99 , Gilmozzi, this conference). In the work of Gómez & Richtler gomez01 who quote a TOM which is in good agreement with the SBF distance, the TOM was not actually reached, but extrapolated, and the agreement with the SBF distance perhaps stems from the fact that in the outer region, where this data has been sampled, the fraction of intermediate-age clusters is low.
Other early-type Ia host galaxies with investigated GCSs, where intermediate-age cluster populations have been identified, are NGC 5018 (SN 2002 dj) (Hilker & Kissler-Patig hilker96 ) and NGC 6702 (SN 2002cs) (Georgakakis et al. georgakakis01 ). Unfortunately, NGC 6702 is too far for an analysis of its GCLF and the TOM of the NGC 5018 system must be largely extrapolated, so it remains uncertain.
But we also have examples of Ia hosts, where the GCLF distance agrees quite well or is even smaller than the SBF distance, e.g. NGC 4621 (2001A), NGC 1380 (1992 A), NGC 4526 (1994D) and NGC 3115 (1935B). If there are intermediate-age populations in these galaxies, they do not seem to contaminate the GCLF.
An interesting note regarding Ia host galaxies and GCSs can be made from the paper of Gebhardt & Kissler-Patig gebhardt99 . These authors analyze the V-I colour distribution of the GCs of a sample of early-type galaxies. Their ”skewness” parameter measures the asymmetry of the colour distribution with respect to the mean colour. The two GCSs which are skewed strongest towards red (e.g. metal-rich) clusters both belong to Ia host galaxies (NGC 4536, NGC 4374) as well as does the fourth in this sequence (NGC 3115).
All this, of course, does not mean that in those cases where GCLF and SBF distances agree within the uncertainties, the stellar populations are necessarily old. However, a comparison with the compilation of galaxy ages by Terlevich & Forbes terlevich01 reveals that among the ellipticals, only NGC 720 (3.4 Gy) is quoted with an age lower than 5 Gyr. Among the S0’s we have only NGC 3607 (3.6 Gyr) and NGC 6703 (4.1 Gyr), i.e. strikingly less candidates for hosting younger populations than among the deviating ones.
Summarizing, it seems that many of the cases where the SBF distance does not agree with the GCLF distance, can be related to the presence of intermediate-age populations, particularly among the ellipticals.
Tab.1 lists all galaxies in Fig. 6 with their TOM, its difference with the SBF distance, references for the TOM and a reference for other properties of the host galaxy.
| Name | TOM | diff(TOM-SBF) | Ref. | Remarks |
| Ellipticals | ||||
| N3610 | kundu01 ,whitmore02 | IM clusters | ||
| N5322 | kundu01 ,proctor02 | IM age | ||
| N4589 | kundu01 ,trager99 | strong | ||
| N0584 | kundu01 ,kodama98 ,trager99 | strong | ||
| N4636 | kissler94 | Ia host | ||
| N4291 | kundu01 | old? | ||
| N4697 | kavelaars00 ,proctor02 | IM age | ||
| N5846 | forbes96 ,kuntschner01 | old? | ||
| N4458 | kundu01 ,kuntschner01 | strong | ||
| N4473 | kundu01 ,kuntschner01 | old? | ||
| N4660 | kundu01 ,kuntschner01 | old? | ||
| N4365 | larsen01 ,puzia02 ,surma95 | IM clusters | ||
| N3379 | kundu01 ,kuntschner01 | old? | ||
| N4472 | kundu01 ,kuntschner01 | old? | ||
| S0 | ||||
| N3384 | larsen01 ,kuntschner01 | extended GCs, strong | ||
| N4550 | kundu01 ,wiklind01 | molecular gas, merger | ||
| N0524 | kundu01b | Ia host | ||
| N1023 | larsen00b ,brodie02 ,silchenko99 | extended GCs, IM nucleus | ||
| N1201 | longhetti00 | shell galaxy | ||
| N1553 | longhetti00 | shell galaxy |
9 Why does it work?

What could be the reason for an universal TOM of old GCSs? A globular cluster with mag has a mass of about 150000 , adopting an average of 2.5 (Pryor & Meylan pryor93 ). Is this particular mass somehow distinguished? One has to realize that the magnitude scale is logarithmic. Binning in linear luminosity units instead of magnitudes, we would not see any striking feature at the luminosity corresponding to the TOM. After remarks by Surdin surdin79 , Racine racine80 , and Richtler richtler93 , regarding the power-law nature of the linear luminosity function of galactic GCs, McLaughlin mclaughlin94 put this concept on a formal basis. If the luminosity function can be described as , where N is the number of clusters found in the luminosity interval L+dL and a function of L, then one has in magnitudes , i.e. the TOM is found where just changes from smaller than -1 to larger than -1. So the location of the TOM does not express a specific physical property at this particular mass. However, the underlying universal property must be a universal mass function. Harris & Pudritz harris94 first investigated the mass function of GCSs of different galaxies, assuming a constant M/L. They found that such diverse systems as that of the Milky Way and of M87 can be described by a common power-law exponent of for masses higher than about solar masses. Larsen et al. larsen01 found in their larger sample on the average between and solar masses. However, in very rich GCSs, such as that of M87 or NGC 1399, the slope becomes distinctly steeper for cluster masses larger than about solar masses (see Fig.7).
Ten years ago, GCSs had been almost exclusively associated with old stellar populations. Meanwhile, systems of young globular clusters have been detected in many merging galaxies, the most prominent ones being the Antennae NGC 4038/4039 (Whitmore & Schweizer whitmore95 ) and NGC 7252 (Whitmore et al. 1993) (see Whitmore whitmore00 for a complete listing until 2000), but also in normal spiral galaxies (Larsen & Richtler larsen99 , Larsen & Richtler larsen00a ).
Determinations of the luminosity functions resulted so far consistently in power-laws with an exponent of about -2, without compelling indications that this exponent changes over the observed luminosity range as in the case of the GCSs of giant ellipticals (Whitmore whitmore00 ), given the uncertainties caused by internal extinction and by the age spread among a cluster system. There was some debate regarding the mass function of GCs in the the Antennae as derived from the luminosity function. The Antennae may show a bend at about , becoming steeper towards the bright end (Whitmore whitmore00 , Zhang & Fall zhang99 ). Fritze-v. Alvensleben fritze99 ) found a log-normal mass distribution like for old systems, which was contradicted by Zhang and Fall (zhang99 ), who attributed this difference to the effect of varying extinction and ages, and found a uniform power-law. If we assume that young GCs are born obeying a universal luminosity function like , and accordingly with a mass function of the same shape, then we must ask, what processes can transform such a luminosity function into the approximately log-normal luminosity functions of old GCSs. If these processes work in a universal manner, then the universality of the TOM could be explained.
10 How does an initial cluster mass function change with time?
A young star cluster is exposed to different destruction mechanisms. If it is still young, mass loss from massive star evolution plays an important role. At later times, two-body relaxation, dynamical friction, and tidal shocks, when the cluster enters the bulge region of its host galaxy or moves through a disk, can be efficient in decreasing the cluster’s mass, depending on its mass, it’s density and it’s orbit in the host galaxy. The most general statement is that low-mass clusters are more affected by disruption processes than high-mass clusters, so an initial power-law of the mass distribution is more strongly distroyed on the low mass end and may develop a shape which finally resembles a log-normal distribution.
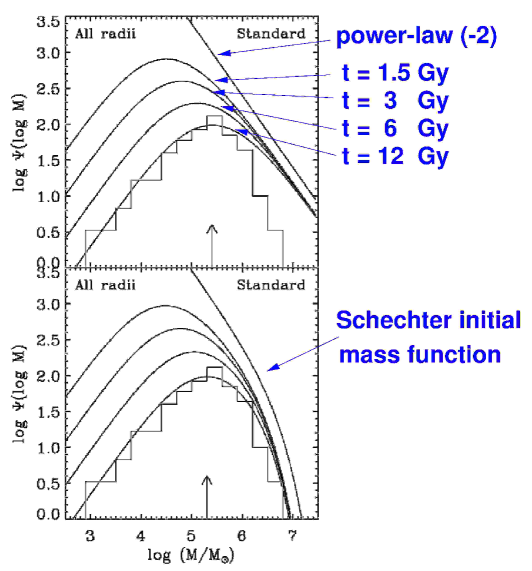
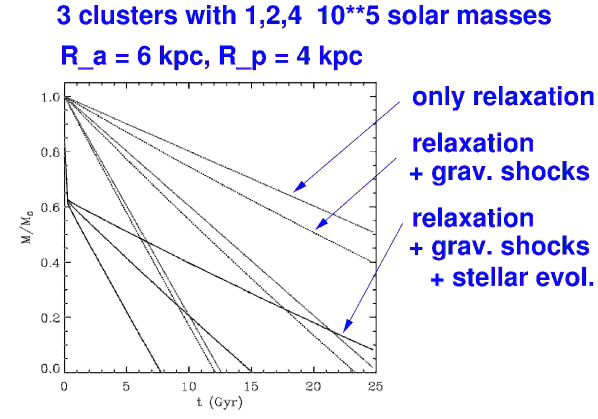
Many people have worked on this problem, among them Aguilar et al. aguilar88 , Okazaki & Tosa oka95 , Elmegreen & Efremov elm97 , Gnedin & Ostriker gnedin97 , Murali & Weinberg (1997a,b,c) Vesperini vespe98 ,vespe00 , Fall & Zhang fall01 . We cannot present all work in detail, instead we choose the analytical model by Fall & Zhang in order to illustrate the most important results. Fig. 8 (Fig. 1 of Fall & Zhang 2001) shows the time evolution for three different masses for a cluster which is on a slightly elongated orbit. The dotted lines indicate the effect of two-body relaxation alone. The dashed lines additionally include gravitational shocks, and the solid lines add the effect of mass loss by stellar evolution.
Under a wide variety of conditions, the mass function of a GCS develops a peak which is progressively shifted to higher masses, as the evolution of the cluster system proceeds. After, say, 12 Gyr, Fall & Zhang get from their model a peak mass (in logarithmic bins) which may well represent the mass corresponding to the TOM observed in the Milky Way or in elliptical galaxies (Fig.9).
However, it seems that the assumption of a power-law with an exponent around -2, as suggested by the young cluster systems in merging galaxies, cannot reproduce well the log-normal shape in the mass-rich domain observed in many galaxies. This is because the shape of the mass function above a few times practically does not change by evolutionary processes. Instead, an initial log-normal mass function works much better in resembling the bright end of the luminosity function of ellipticals (Vesperini vespe00 , vespe01 ) (but see the section on the brightest clusters).
The dynamical evolution of a GCS may raise doubts on the general quality of the GCLF as a distance indicator, if the evolutionary history of a GCS is not negligible. The GCLF might also depend on whether the TOM is measured at small or large galactocentric radii. In the inner parts of a galaxy, the TOM is expected to be brighter. Gnedin gnedin97 finds significant differences in this sense for the Milky Way, M31, M87, which for M31 has been confirmed by the improved sample of Barmby et al. barmby01 . Also the brighter TOM (with respect to the SBF distance) of the Sombrero may have its explanation in the dynamical history of this GCS. The Sombrero possesses an extraordinary large bulge, where dynamical shocks might work more efficient than in other galaxies (naively assuming, of course, that the SBF distance is correct). Note, however, that the HST-observations by Larsen et al. larsen00b reveal a GCLF for the Sombrero whose TOM is not very well defined.
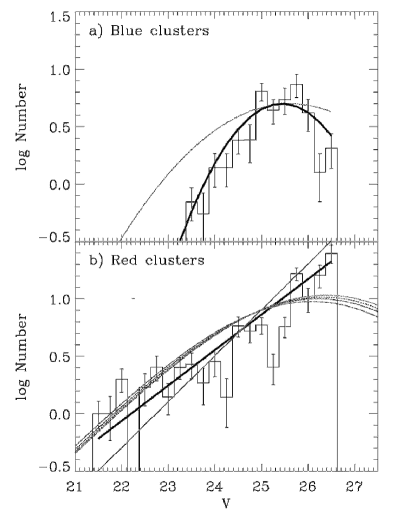
One of the best investigated galaxies among those which shows a marked difference between the GCLF and the SBF distance is the elliptical galaxy NGC 3610. Scorza & Bender scorza90 found a disk and other morphological signatures indicating previous interaction or a merger event. It’s location in Fig.5 corresponds to the TOM quoted by Kundu & Whitmore kundu01 . In a subsequent paper, Whitmore et al. whitmore02 performed a more detailed investigation of the GCS of NGC 3610, based on new HST data. Fig. 10 shows the LFs separately for the blue and the red clusters. While for the blue clusters the TOM is measured to be at , the red clusters show a LF rising until the photometry limit. Whitmore et al. combined the destruction model of Fall & Zhang with evolutionary models of stellar populations. The resulting model LFs are indicated in the lower panel. The data are not yet deep enough to show a turn-over for the red clusters, which by the models is predicted to be at around . Whitmore et al. state that in the context of the Fall & Zhang models, the brightening of the TOM during the dynamical evolution of the cluster system is almost completely balanced by the fading of the stellar population during this time. This may well be an explanation for the universality of the TOM. However, given the approximate nature of the analytic models of Fall & Zhang and the the dependence of the destruction processes on the actual environment, this probably does not apply to every galaxy.
We therefore can conclude that in the case of NGC 3610, a large part of the deviation of the GCLF distance from the SBF distance comes from the fact that the contribution of the presumably younger red clusters causes a fainter TOM than from the blue, metal-poor and presumably older clusters alone. But also when we use only the TOM of the blue clusters to determine the distance modulus, which then would be 32.94, a significant difference remains to the SBF modulus, which is 31.65. This cannot be resolved here. The modelling of SBF’s accounts for the population structure (Liu et al. liu02 , Blakeslee et al. blakeslee01 ) but may fail in extreme cases.
11 The brightest clusters
Regarding the significance of the GCLF as a distance indicator, its shape in the domain of the brightest clusters is less important. But since dynamical models indicate that the GCLF for clusters more massive than about is not modified by destruction processes, they bear potential information about the formation of a GCS. Two different views on a GCLF like that of Fig.7 exist: It can be seen as a power-law with an exponent around -2 with a cut-off at higher masses or it can be seen as a log-normal function.
Adopting the first view, the GCLF would resemble in large parts the LF found in young cluster systems. The cut-off at high masses may have different reasons. Possibly these very massive clusters (the brightest clusters in NGC 1399 have about ) are not globular clusters in the normal sense, but the dynamically stripped nuclei of dwarf galaxies. In the Milky Way, we have Centauri as a possible example (e.g. Hilker & Richtler hilker00 ). In this case, the LF at the bright end would depend on the accretion rate of dwarf galaxies, which pausibly is highest in massive galaxies in dense environments like NGC 1399 or M87. Or the formation history of the most massive clusters is principally different from the less massive ones. The peculiar cluster in NGC 6946 (Larsen et al. larsen01a , larsen02a ) with a mass of about and an age of 15 Myr is surrounded by a round, star forming complex of about 600 pc diameter, which gives the impression of a disk-like structure with the massive cluster near its center. Such a configuration suggests that the cluster mass is determined or partly determined by accretion from a larger region, resulting in a steeper mass function for massive clusters.
Taking the second view of a log-normal function, one has the possibility to relate such a shape to coagulation processes by which GCs might have been formed through the merging of smaller subunits. Based on ideas by Harris & Pudritz harris94 , McLaughlin & Pudritz mclaughlin96 developed a model, in which GCs form inside the cores of supergiant molecular clouds. These cores are built up by internal collisions and subsequent coagulation of smaller clouds. Star formation tends to partly disrupt these cores and in an equilibrium between coagulation and disruption, a mass spectrum of cores results, which directly resembles the GC mass spectrum. This is because the formation of GCs in these cores must occur with a high star formation efficiency in order for the GC to stay bound, i.e. the mass of the core is closely related to the mass of the final cluster.
See also Burkert & Smith burkert00 who argue that the mass spectra of GCSs can be fitted with a form , where is a ”truncation mass“. Such a shape resembles the long-time solution of the coagulation model of Silk & Takahashi silk79 , initially starting with small progenitor clouds of equal mass.
Although the relation between the GC mass spectrum and the mass spectrum of the progenitor clouds is open to speculation, the power-law interpretation of the GCLF has some attractive features over the log-normal law interpretation.It relates the GCLF of old clusters system with young ones, and it offers a simple explanation by a direct link to the mass spectrum of molecular clouds.
It is amazing that molecular clouds in the Galaxy exhibit a mass spectrum resembling so closely that of GCs. See the introductory part of Elmegreen elm02 for a compilation of references. This power-law behaviour may be the result of a fractal structure of the interstellar gas caused by turbulence and selfgravitation (Fleck fleck96 , Elmegreen & Falgarone elm97 , Elmegreen elm02 ). Therefore the universality of the GCLF probably has its ultimate explanation in the universality of the interstellar gas structure.
12 Conclusions
We have seen that the method of globular cluster luminosity functions (GCLFs) allows one to determine distances to early-type galaxies, which are as accurate as those derived from surface brightness fluctuations (SBFs), once the conditions of high data quality and sufficiently rich cluster systems are fullfilled. The achievable accuracy of distance moduli is of the order 0.2 mag. The absolute turn-over magnitudes (TOMs), if calibrated by SBF distances, agree very well with those of the globular cluster systems of the Milky Way and the Andromeda nebula. Therefore the TOM is indeed a universal property of old globular cluster systems.
The comparison of SBF distances with GCLF distances reveals however many discrepant cases, in which the GCLF distances are systematically larger than the SBF distances beyond the limits given by the uncertainties. In some elliptical galaxies, direct evidence for the existence of intermediate-age globular clusters is available. In others, intermediate-age stellar populations are indicated by a variety of findings, which again may suggest a certain fraction of intermediate-age globular clusters as well. The S0-galaxies NGC 1023 and NGC 3384 exhibit a population of faint extended red clusters, which cause a fainter TOM, if they are included in the luminosity function.
That a globular cluster system, consisting mainly of old clusters, in which intermediate-age clusters are mixed in, exhibits a fainter TOM, can be understood by the dynamical evolution of cluster systems. Young globular clusters, which are found in large numbers in merging galaxies, are formed according to a power-law mass function with an exponent around -2. The cluster system then undergoes a dynamical evolution where the mass loss of individual clusters is caused by two-body relaxation, tidal shocks and mass loss by stellar evolution. This results in a preferential destruction of low-mass clusters, modifying the initial power-law mass function in such a way that the corresponding luminosity function on the magnitude scale shows a TOM which becomes brighter as the system evolves. The fading of clusters by stellar evolution counteracts this brightening to some degree.
The universality of the GCLF probably has its origin in the fractal structure of the interstellar medium, which results in a power-law mass spectrum for molecular clouds with an exponent of -2, similar to that found for young globular cluster systems.
13 Acknowledgements
Thanks go to Doug Geisler for a careful reading of the manuscript and helpful criticism. I am indebted to Søren Larsen for indicating unclear points and calling attention to NGC 1023 and NGC 3384. Many discussions with Boris Dirsch are gratefully acknowledged as well as support by the FONDAP Center for Astrophysics, Conicyt 15010003.
References
- (1) Aguilar L., Hut P., Ostriker J.P. 1988, ApJ 335, 720
- (2) Ashman K. M., Zepf S. E. 1998, Globular Cluster Systems, Cambridge University Press, Cambridge
- (3) Ashman K.M., Conti A., Zepf S.E. 1995, AJ 110, 1164
- (4) Barmby P., Huchra J.P., Brodie J.P. 2001, AJ 121, 1482
- (5) Baum W. 1955, PASP 67, 328
- (6) Blakeslee J.P., Davis M., Tonry J.L. et al. 1999 ApJ 527, L73
- (7) Blakeslee J.P., Vazdekis A., Ajhar E. 2001, MNRAS 320, 193
- (8) Brodie J.P., Larsen S.S. 2002, AJ 124, 1410
- (9) Burkert A., Smith G.H. 2000, ApJ 542, L95
- (10) Demarque P., Zinn R., Lee Y.-W., Yi S. 2000, AJ 119, 1398
- (11) Davies R.L., Kuntschner H., Emsellem E. et al. 2001, ApJ 548, L33
- (12) de Vaucouleurs G., de Vaucouleurs A., Corwin Jr. H.G. et al, 1991, Third Reference Catalogue of Bright Galaxies, Springer-Verlag Berlin Heidelberg New York
- (13) Dirsch B., Richtler T., Geisler D., Forte J.-C., Gieren W. 2003, AJ, in press
- (14) Della Valle M., Kissler-Patig M., Danziger J., Storm J. 1998, MNRAS 299, 267
- (15) Drenkhahn G., Richtler T. 1999, A&A 349, 877
- (16) Elmegreen B.G., Falgarone E. 1996, ApJ 471, 816
- (17) Elmegreen B.G., Efremov Y.N. 1997, ApJ 480, 235
- (18) Elmegreen B.G. 2002, ApJ 564, 773
- (19) Fall S.M., Zhang Q. 2001, ApJ 561, 751
- (20) Ferrarese L., Ford H.C., Huchra J. et al. 2000, ApJS 128, 431
- (21) Fleck R.C., Jr. 1996, ApJ 458, 739
- (22) Fleming D.E.B., Harris W.E., Pritchet C.J., Hanes D.A. 1995, AJ 109, 1044
- (23) Freedman W., Madore B. 1991, PASP 103, 933
- (24) Freedman W., Madore B., Gibson B.K. et al. 2001, ApJ 553, 47
- (25) Fritze-v.Alvensleben U. 1999, A&A 342, L25
- (26) Forbes D.A., Brodie J.P., Huchra J.P. 1996, AJ 112, 2448
- (27) Gebhardt K., Kissler-Patig M. 1999, AJ 118, 1526
- (28) Geisler D., Lee M.G., Kim E. 1996, AJ 111, 1529
- (29) Georgakakis A.E., Forbes D.A., Brodie J.P. 2001, MNRAS 324, 785
- (30) Giradi L., Bertelli G., Bressan A. et al. 2002, A&A 391, 195
- (31) Gnedin O.Y. 1997, ApJ 487, 663
- (32) Gnedin O.Y., Ostriker J.P. 1997, ApJ 474, 223
- (33) Gómez M., Richtler T., Infante L., Drenkhahn G. 2001, A&A 371, 875
- (34) Goudfrooij P., Alonso M.V., Maraston C., Minniti D. 2001, 328, 237
- (35) Goudfrooij P., Mack J., Kissler-Patig M., Meylan G., Minniti D. 2001, 322, 643
- (36) Grillmair C.J, Forbes D.A., Brodie J.P., Elson R.A.W. 1999, AJ 117, 167
- (37) Hanes D.A. 1977, MNRAS 180, 309
- (38) Hanes D.A. 1979, MNRAS 188, 901
- (39) Harris W.E., Racine R. 1979, ARAA 17, 241
- (40) Harris W.E. 1991, ARAA 29, 543
- (41) Harris W.E., Pudritz R. 1994, ApJ 492, 177
- (42) Harris W.E. 1996, AJ 112, 1487
- (43) Harris W.E. 2001, ”Globular Cluster Systems”, in Star Clusters, Saas-Fee Advanced Course 28. Lecture Notes 1998, Swiss Society for Astrophysics and Astronomy. Edited by L. Labhardt and B. Binggeli, Springer-Verlag, Berlin, 2001, p.223
- (44) Hilker M., Kissler-Patig M. 1996, A&A 314, 357
- (45) Hilker M. Richtler T. 2001, A&A 362, 895 ApJ 512, L79
- (46) Jacoby G.H., Branch D., Ciardullo R. et al. 1992, PASP 104, 599
- (47) Kavelaars J.J., Harris W.E., Hanes D.A. et al. 2000, ApJ 533, 125
- (48) Kissler M., Richtler T., Held E.V. et al. 1994 A&A 287, 463
- (49) Kodama T., Arimoto N. 1998, MNRAS 300, 193
- (50) Kundu A., Whitmore B.C. 2001, AJ 121, 2950
- (51) Kundu A., Whitmore B.C. 2001, AJ 122, 1251
- (52) Kuntschner H., Lucey J.R., Smith R.J. et al. 2001, MNRAS 323, 615
- (53) Larsen S.S., Richtler T. 1999, A&A 345, 59
- (54) Larsen S.S., Richtler T. 2000, A&A 354, 836
- (55) Larsen S.S., Brodie J.P. 2000, AJ 120, 2938
- (56) Larsen S.S., Brodie J.P., Huchra J.P. et al. 2001, AJ 121, 2974
- (57) Larsen S.S., Brodie J.P., Elmegreen B. G. et al. 2001, ApJ 556, 801
- (58) Larsen S.S., Efremov Y.N., Elmgreen B. G. et al. 2002, ApJ 567, 896
- (59) Larsen S.S., Brodie J.P., Beasley et al. 2002, ApJ in press (astro-ph/0211434)
- (60) Lauer T.R., Tonry J.R., Postman M. et al. 1998, ApJ 499, 577
- (61) Leibundgut B. 2000, A&ARv 10, 179
- (62) Liu M.C., Charlot S., Graham J.R. 2000, ApJ 543, 644
- (63) Liu M.C., Graham J.R., Charlot S. 2002, ApJ 564, 216
- (64) Longhetti M. Bressan A., Chiosi C., Rampazzo R. 2000, A&A 353, 917
- (65) McLaughlin D.E. 1994, PASP 106, 47
- (66) McLaughlin D.E., Pudritz R.E. 1996, ApJ 457, 578
- (67) Murali C., Weinberg M.D. 1997, MNRAS 291, 717
- (68) Murali C., Weinberg M.D. 1997, MNRAS 288, 740
- (69) Murali C., Weinberg M.D. 1997, MNRAS 288, 767
- (70) Okazaki T., Tosa M. 1995, MNRAS 274, 48
- (71) Okon W.M.M., Harris W.E. 2002, ApJ 567, 294
- (72) Ostrov P.G., Forte J. C., Geisler D. 1998, AJ 116, 2854
- (73) Proctor R.N., Sansom A.E. 2002, MNRAS 333, 517
- (74) Pryor C., Meylan G. 1993, in ”Structure and Dynamics of Globular Clusters“, ASP Conf. Ser. 50, eds. S.G. Djorgovski and G. Meylan, p. 357
- (75) Puzia T.H., Zepf S.E., Kissler-Patig M. et al. 2002, A&A 391, 453
- (76) Racine R. 1980, in IAU Symp. 85, Star Clusters, ed. J.E. Hesser, Dordrecht, Reidel, p.369
- (77) Rejkuba M. 2001, A&A 369, 812
- (78) Richtler T. 1993, in The Globular Cluster-Galaxy Connection, ASP Conf.Ser. 48, eds. G.H.Smith and J.P. Brodie, p.375
- (79) Rix H.-W., Franx M., Fisher D., Illingworth G. 1992, ApJ 400, L5
- (80) Schweizer F., Seitzer P. 1992, AJ 104, 1039
- (81) Scorza C., Bender R. 1990, A&A 235, 49
- (82) Secker J. 1992, AJ 104 1472
- (83) Sil’chenko O.K. 1999, AJ 117, 2725
- (84) Silk J., Takahashi T. 1979, ApJ 229, 243
- (85) Strader J., Brodie J.P., Schweizer F. et al. 2002, AJ in press (astro-ph/0211156)
- (86) Surdin V.G. 1979, Sov. Astron. 23, 648
- (87) Surma P., Bender R. 1995, A&A 298, 405
- (88) Tammann G.A., Sandage A. 1999, in ”Harmonizing Cosmic Distance Scales in a Post-Hipparcos Era, ASP Conference Series, vol. 167, eds. D. Egret and A. Heck. p. 204
- (89) Terlevich A.I., Forbes D.A. 2001, MNRAS 330, 547
- (90) Tonry J.L., Blakeslee J.P. Ajhar E.A. et al. 1997, ApJ 475, 399
- (91) Tonry J.L., Blakeslee J.P. Ajhar E.A. et al. 2000, ApJ 530, 625
- (92) Tonry J.L., Dressler A., Blakeslee J.P. et al. 2001, ApJ 546, 681
- (93) Trager S.C., Faber S.M., Worthey G., Gonzalez J.J. 1999, AJ 119, 1645
- (94) Vesperini E. 1998, MNRAS 299, 1019
- (95) Vesperini E. 2000, MNRAS 318, 841
- (96) Vesperini E. 2001, MNRAS 322, 247
- (97) Whitmore B.C., Schweizer F., Leitherer C. et al. 1993, AJ 106, 1354
- (98) Whitmore B.C., Schweizer F. 1995, AJ 109, 960
- (99) Whitmore B.C., Miller B.W., Schweizer F., Fall S.M. 1997, AJ 114, 1797
- (100) Whitmore B.C. 1997, in The Extragalactic Distance Scale, eds. M. Livio, M. Donahue, and N. Panagia, StScI Conf., Baltimore, p. 254
- (101) Whitmore B.C. 2000, in STScI Symp. Ser. 14, ed. M. Livio (astro-ph/0012546)
- (102) Whitmore B.C., Schweizer F., Kundu A., Miller B.W. 2002, AJ 124, 147
- (103) Wiklind T., Henkel C. 2001, A&A 375, 797
- (104) Woodworth S.C., Harris W.E. 2000, AJ 119, 2699
- (105) Zhang Q., Fall S.M. 1999, ApJ 527, L81