Chandra Observation of the Merging Cluster Abell 2034
Abstract
We present an analysis of a Chandra observation of Abell 2034. The cluster has multiple signatures of an ongoing merger, including a cold front and probable significant heating of the intracluster medium above its equilibrium temperature. We find no evidence for the large cooling rate previously determined for the cluster, and in fact find it to be roughly isothermal, though with numerous small-scale inhomogeneities, out to a radius of 700 kpc. The cold front appears to be in the process of being disrupted by gas dynamic instability and perhaps by shock heating. We find weak evidence for Inverse Compton hard X-ray emission from the radio relic suspected to be associated with the cold front. Finally, we study the emission to the south of the cluster, which was previously thought to be a merging subcluster. We find no evidence that this “subcluster” is interacting with the main Abell 2034 cluster. On the other hand, the properties of this region are inconsistent with an equilibrium cluster at the redshift of Abell 2034 or less. We explore the possibility that it is a disrupted merging subcluster, but find its luminosity to be significantly lower than expected for such a scenario. We suggest that the emission to the south of the cluster may actually be a moderate to high redshift () background cluster seen in projection against Abell 2034.
Subject headings:
cooling flows — galaxies: clusters: individual (Abell 2034) — intergalactic medium — shock waves — X-rays: galaxies: clusters1. Introduction
Clusters of galaxies are bright X-ray sources, with typical bolometric luminosities in the range from to erg s-1. In the standard hierarchical model of cluster formation, larger clusters are formed by hierarchical accretion of smaller clusters. Occasionally, two clusters of roughly equal mass will merge. These major mergers are expected to have significant effects on the intracluster medium (ICM). Mergers will drive shocks with Mach numbers , which can significantly heat the ICM. While strong, centrally condensed cooling flows are anticorrelated with major mergers, merger shocks are too weak to completely disrupt cooling flows at the centers of clusters. Consequently, cold cores of gas have been observed to be moving at high velocities through the ICM of several clusters e.g. Abell 2142, Abell 3667; Markevitch et al., 2000; Vikhlinin et al., 2001a. In principle, these thermal effects should all be visible in X-rays: the shocks as abrupt increases in the entropy of the X-ray emitting gas, and cold cores as regions of high density, cold gas.
The survival of these cold cores during the merger process has been one of the most significant discoveries in the area of cluster research made by Chandra. Prior observations did not have the spatial resolution to resolve these cold cores of gas from the surrounding hotter gas. The leading edges of these cold cores, dubbed “cold fronts,” are contact discontinuities, where the pressure gradient from the hot gas to the cold gas is continuous. The abruptness of the temperature and density change over the small distance of these fronts means that transport processes (diffusion) across the fronts must be suppressed (Vikhlinin et al., 2001b; Ettori & Fabian, 2000).
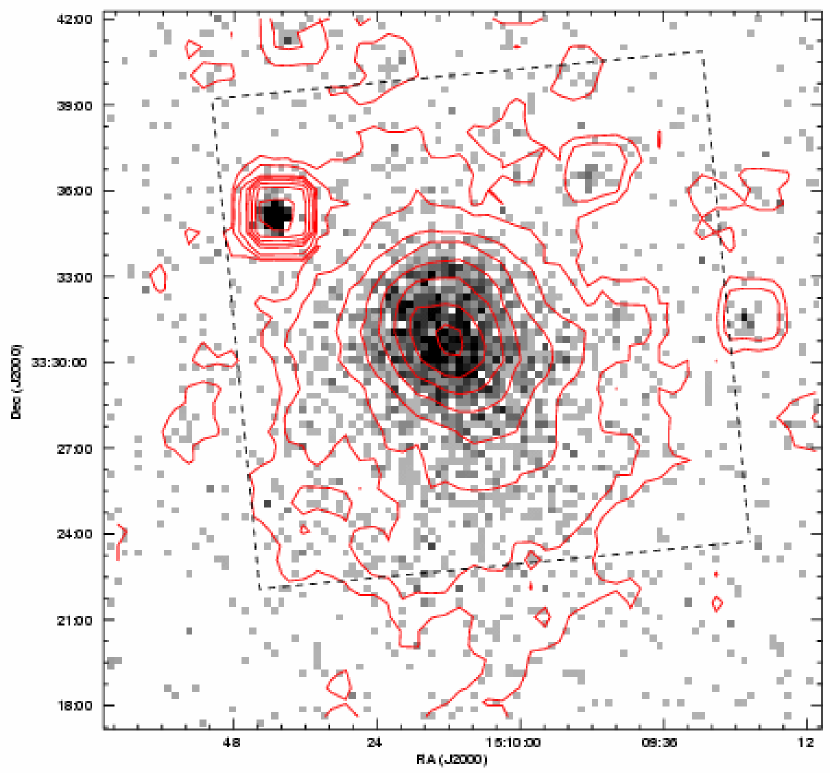
Abell 2034 is a moderate redshift, high X-ray luminosity cluster at (Struble & Rood, 1999). Previous observations of the cluster with ASCA and ROSAT have found, respectively, a cooling flow-corrected temperature of 9.6 keV (White, 2000) and a bolometric luminosity of erg s-1 (David, Forman, & Jones, 1999). White (2000) found a best-fit single temperature of 7.6 keV. Optically, it is quite rich (ACO richness class 2; Abell, Corwin, & Olowin, 1989). It has a cD galaxy which is offset from the X-ray centroid and from the optical centroid of the cluster. The relative displacements of the cD galaxy, average galaxy position, and center of the X-ray gas distribution suggest that the cluster is out of equilibrium. Indeed, non-equilibrium features were seen in the cluster in a pointed ROSAT observation; the unpublished ROSAT PSPC image is presented below (Figure 2). It showed an excess of emission to the south of the cluster center which was suspected to be a merger shock. Also visible in the ROSAT image was a surface brightness discontinuity to the north of the cluster center, opposite the suspected merger shock. The detection of a radio relic near the position of the northern discontinuity (Kempner & Sarazin, 2001) strengthens the case for the cluster being out of equilibrium due to a recent or ongoing merger.
Despite these pieces of evidence for a merger, Abell 2034 has also been reported to have a large cooling flow with a cooling rate of 90–580 yr-1 (White, 2000). Usually, large cooling flows are strongly anti-correlated with major cluster mergers (Buote & Tsai, 1996). Thus, ASCA and ROSAT observations did not lead to a consistent picture of the dynamical state of this cluster. Higher spatial resolution observations with spatially resolved spectra and a broad X-ray band (given the high temperature) were needed.
This makes Abell 2034 an interesting target for a Chandra observation, particularly since it is located at a sufficiently large redshift that most of the center of the cluster can be imaged with the ACIS-I camera. In this paper, we present the results of such an observation. All errors are quoted at 90% confidence unless otherwise stated. We assume km s-1 Mpc-1 and throughout this paper. At the redshift of Abell 2034, kpc.
2. Observation and Data Reduction
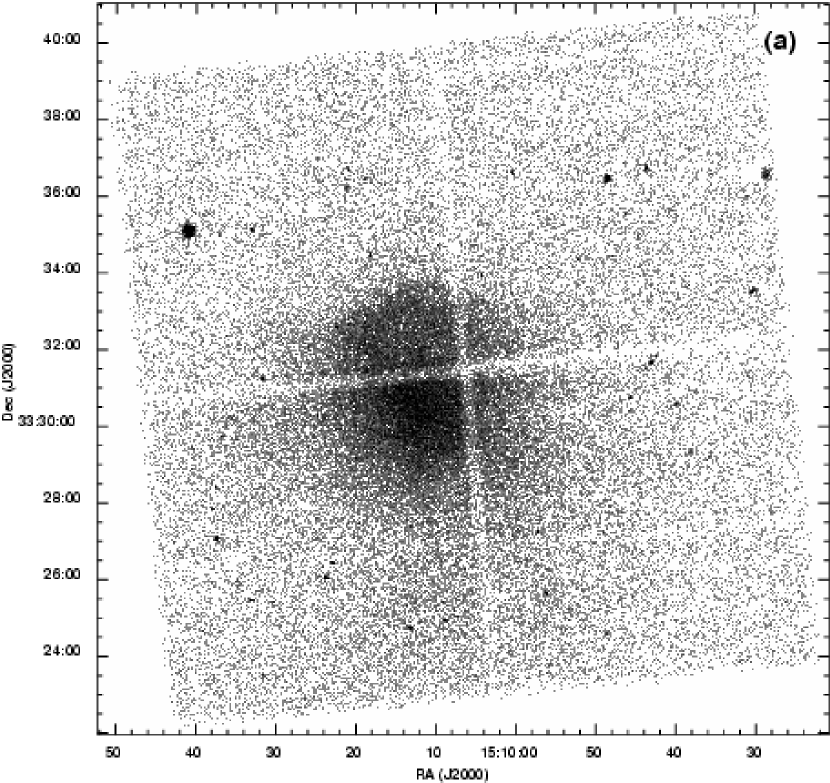
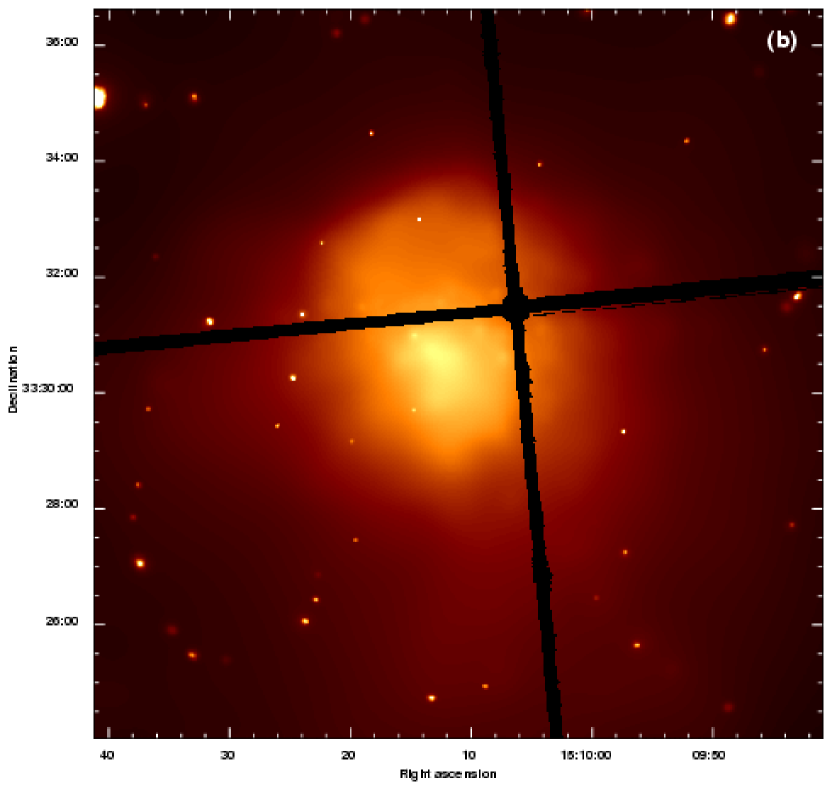
Abell 2034 was observed on 2001 May 5 in a single 54 ksec exposure. The data were taken in Very Faint (VF) mode using the four ACIS-I chips and the S3 chip. The focal plane temperature was 120 C, the frame time was 3.2 s, and only events with ASCA grades of 0,2,3,4, and 6 were analyzed. The S3 chip was used to check the background during the observation; no background flares were observed. A binned image, uncorrected for background or exposure, is shown in Figure 1a.
Chandra data taken in VF mode retain the full 55 pixel event islands, which allow for more thorough rejection of particle background than do data with only the 33 pixel event islands111http://cxc.harvard.edu/cal/Links/Acis/acis/Cal_prods/vfbkgrnd/index.html. We applied this additional filtering to our data and to the blank-sky backgrounds. We determined the background using the blank sky background files included in the Chandra Calibration Database222http://asc.harvard.edu/caldb/. We used the period D background files, which include data taken in VF mode.
The ancillary response files (arfs) used in the spectral analysis were corrected for the reduction in transmission of the CCD window at low energies using the “apply_acisabs” tool in CIAO. At the time of the observation, the reduction in sensitivity due to this effect was about 20% at 0.8 keV. Due to additional uncertainty in the calibration at low energies, we restricted our analysis to the range 0.8–9.0 keV.
3. X-ray Image
The raw Chandra image, binned by a factor of 4 and uncorrected for background or exposure, is shown in Figure 1a. At its moderate redshift, Abell 2034 fills much of the ACIS-I detector on Chandra. The cluster was positioned on the detector so that the aimpoint would be about halfway between the cD galaxy and the centroid of the X-ray emission as determined from the ROSAT image. The image shows several interesting features in the cluster itself, and a number of point sources.
A smoothed image of the diffuse emission is shown in Figure 1b. The image was adaptively smoothed using the csmooth tool from the CIAO software package333http://asc.harvard.edu/ciao/. Blank sky background and exposure images were smoothed using the same kernel, and were then used to correct the smoothed raw image.
As can be seen in Figures 1a and 1b, the cluster has significant emission out to a distance of – in all directions. There is a sharp discontinuity in the surface brightness to the north of the cluster center. We will refer to this feature as the “northern cold front.” It is discussed in detail below (§6). This feature was seen in the earlier ROSAT image (Figure 2; the image was corrected for background and exposure using the ROSAT extended object analysis tools by S. Snowden444ftp://legacy.gsfc.nasa.gov/rosat/software/fortran/sxrb/). This feature was one of the motivations for observing this cluster with Chandra. Based on the ROSAT observations, which provided no useful information on the X-ray spectra near this feature, we had interpreted this feature as a possible merger shock.
Also visible in the raw and smoothed X-ray images is an excess of emission to the south of the cluster center. We will refer to this region as the “south excess;” it is discussed in more detail below (§ 5). This feature was also seen in the earlier ROSAT image (Figure 2), where it appeared as a rather distinctive arc of emission running from the southeast to the northwest. Initially, we suspected that this feature might be a merger shock cutting across the cluster. The extensions of this arc in the ROSAT image are due, at least partially, to unresolved point sources seen in the Chandra image. Because Chandra is able to better resolve these distinct regions of emission and separate out point sources, the south excess appears as a fairly regular region of diffuse emission rather than as the arc which we believed to see in the ROSAT image (Figure 2).
The cluster does not have a particularly sharply peaked core, suggesting that it does not contain a strong cooling flow. The core of the cluster has a somewhat irregular structure. The central arcminute or so is shaped like a curved teardrop, with the brightness peak centered on the broad end of the teardrop, to the north of center. Outside of 1′, the cluster becomes more regular and circular. This structure is clearly visible in the contours in Figure 3.
An optical image of the Digital Sky Survey (DSS) is shown in Figure 3. Note that the cD galaxy which is the brightest cluster member is not located at the peak in the X-ray surface brightness, but is 77″ south of the peak. There is a smaller peak in the X-ray surface brightness which does coincide with the central cD galaxy.
A very bright cluster galaxy, also classified as a cD, is located NNW of the X-ray peak near the location of the northern cold front. There are several other bright elliptical galaxies in this neighborhood, and numerous fainter galaxies. In fact, the number of moderately bright to faint galaxies in this region significantly outnumbers that in the region of the more central cD galaxy. The majority of these galaxies are north, or ahead, of the cold front, perhaps suggesting that the collisionless galaxies have moved ahead of the collisional gas, which has been slowed during the merger. Just inside the cold front, there is a significant excess of X-ray emission relative to that expected from a smooth -model, as we discuss later in §4.1.
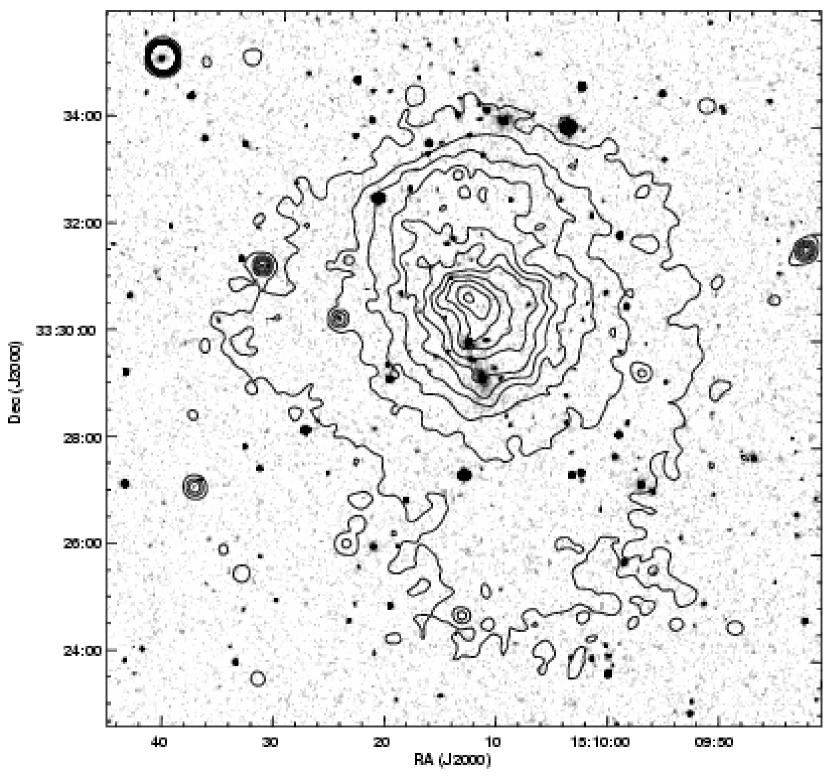
There are no bright galaxies and no obvious excess in the galaxy density evident in the DSS image of the region covered by the south excess. Two faint galaxies () are visible on the western edge of the south excess, and are associated with the wide angle tail (WAT) radio galaxy FIRST J150957.2+332716 and the narrow angle tail (NAT) radio galaxy FIRST J150959.5+332746. The latter is also visible as an X-ray source in the Chandra image.
4. Global Cluster Properties
4.1. Radial Gas Distribution
The X-ray image of Abell 2034 shows a number of strong features which suggest that the cluster may not be relaxed. These include the northern cold front, the south excess, the lumpy structure near the center, and the displacement of the central cD galaxy from the X-ray peak. Despite these local irregularities, the radial surface brightness profile of the cluster is fairly consistent over most azimuthal angles.
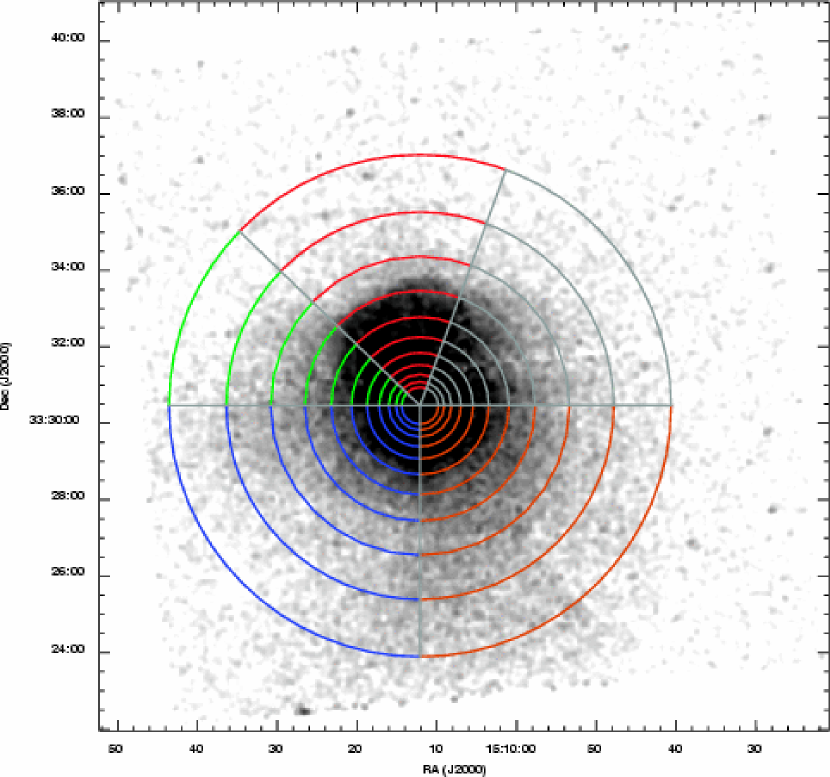
We determined the radial surface brightness profile in 5 sectors where the cluster is approximately circularly symmetric within each sector. The sectors and annuli used to extract the surface brightness profile are shown in Figure 4a. The annuli were selected to have between 1000 and 2000 source counts per annulus in order to produce reasonable spectral fits. This meant that for the purposes of the surface brightness analysis presented here they had a much higher flux than was necessary. In Figure 4b, we show the radial surface brightness profiles in these five sectors. The sectors’ common origin is the approximate centroid of the cluster emission. A -model fit to the sum of these profiles yields the best-fit core radius of kpc and slope of (1- errors). We could not find any previously published values for these parameters for comparison. This model provides a reasonably good fit to all of the inner regions of the sectors except for the one encompassing the northern edge, plotted in red in Figure 4b. This particular sector shows an excess of emission immediately inside the edge and a smaller deficit outside, but at smaller and larger radii is reasonably consistent with the profiles in the other sectors.
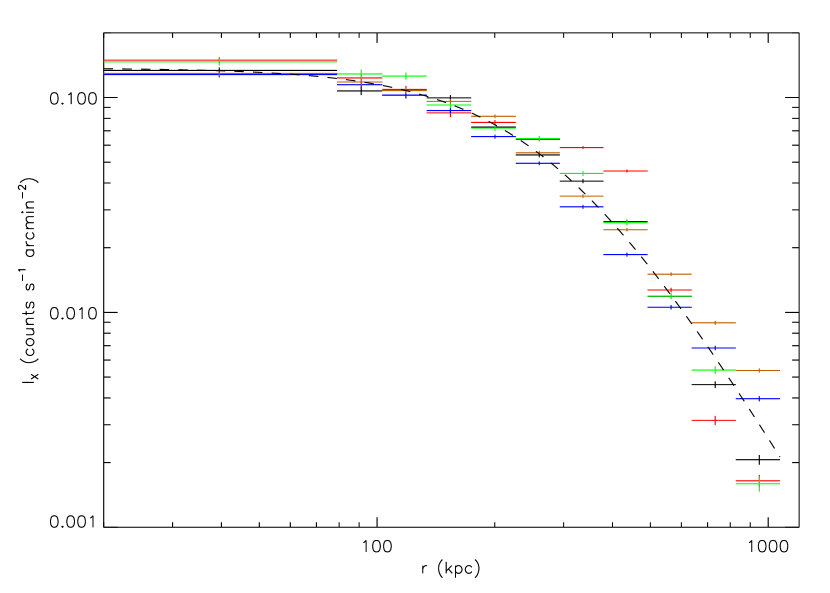
The southwest sector has a noticeably flatter profile with brighter emission at large radii due to the south excess region. The south excess may in fact be a separate, possibly more distant cluster seen in projection against Abell 2034, as we discuss in detail in §5. In Figure 5, we show the residuals after subtracting a -model from the Gaussian smoothed image shown in Figure 4a. Since the southeast sector is largely free of emission from the south excess and from other substructure within the cluster, we fit a -model separately to this sector for use in creating Figure 5. The resultant -model fit has kpc and , which is a significantly smaller core radius and flatter slope than the best fit to all the sectors including the south excess and internal substructure. As is evident in Figure 5, however, this still oversubtracts slightly the large-scale diffuse emission in the cluster, particularly at radii less than 800 kpc. This oversubtraction is probably due to the -model still being affected by a small contribution from the south excess and from the excess at the very center of the cluster.
4.2. Spectral Properties
To test the previous report using data from ASCA of a large cooling flow in Abell 2034 (White, 2000), we extracted a spectrum from a circular region with radius equal to the core radius determined in §4.1. We fit it with a single temperature MEKAL model (Kaastra, 1992; Liedahl, Osterheld, & Goldstein, 1995), and then with a single temperature plus a cooling flow. In both cases we fixed the absorption to the Galactic value of cm-2 (Dickey & Lockman, 1990). The single temperature fit determined a temperature of keV, and an abundance of times solar, with . This abundance is consistent to within the errors with that determined by White (2000) using data from ASCA. The addition of a cooling flow component, with the minimum temperature set to essentially zero and the maximum temperature and abundance tied to the values of the single-temperature component, did not improve the fit. The resultant cooling rate to low temperature was determined to be yr-1. With the low temperature as a free parameter, the fit was too poorly contrained to provide any useful limits. In short, we find evidence for only a small amount of cooling in the center of the cluster. It is likely that the large cooling rate measured by White (2000) was due to the presence of cooler gas in the cold front (see §6) and in the south excess (see §5) rather than in a classical cooling flow in the cluster core.
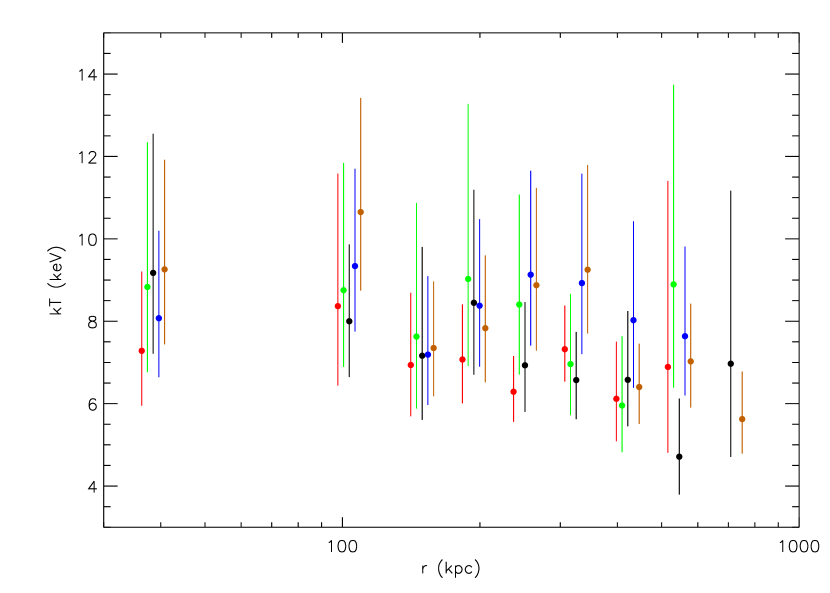
We extracted spectra in the same sectors as were used in §4.1, and fit them with a single temperature MEKAL model. For the initial spectral fits, we fixed the absorption at the Galactic value. We first allowed only the temperature and normalization to vary, with the abundance fixed at the mean value of 0.29 times solar determined above. We then allowed the abundance to vary and re-fit the spectra. Allowing the abundances to vary did not change the temperatures we measured by a significant amount, and the abundances we determined were not well constrained—in most cases they provided only upper limits. There is no evidence from these spectra, however, for any large abundance gradients across the cluster, and all the abundances we measured were consistent with the value of 0.29 times solar determined above. We therefore use the fits with fixed abundance in our subsequent analysis. The results of these fits are shown in Figure 6.
With the exception of the southwest quadrant, where contamination from the south excess is significant at large radii, we find no evidence for a large scale temperature gradient like that seen in some clusters (Markevitch et al., 1998). The temperature gradients reported by Markevitch et al. (1998), however, were generally at radii 1 Mpc, whereas our temperature profiles are only significant out to 700 kpc.
4.3. Temperature Structure
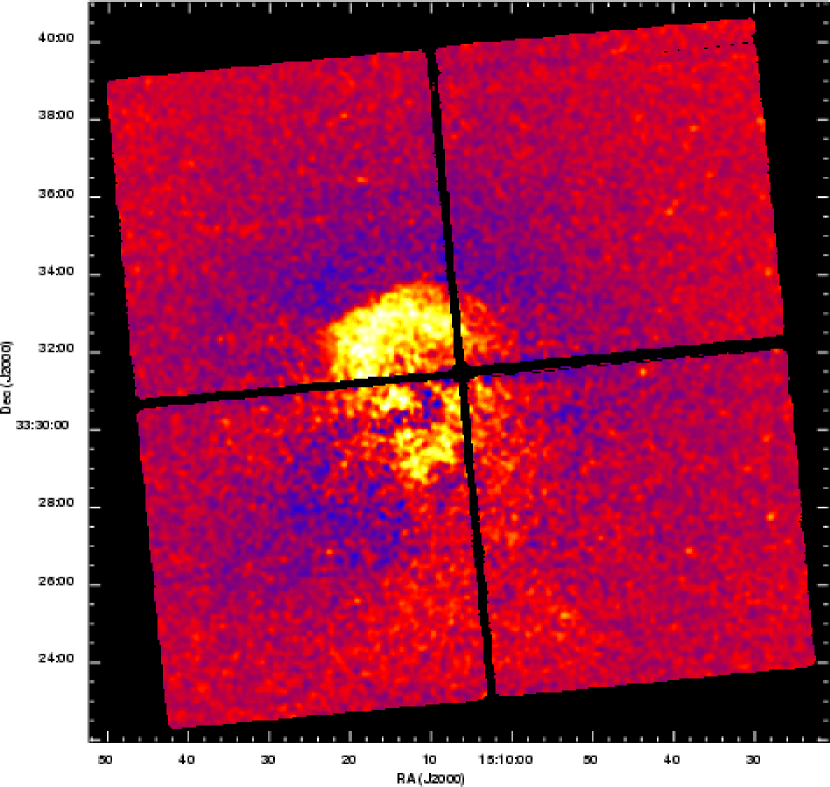
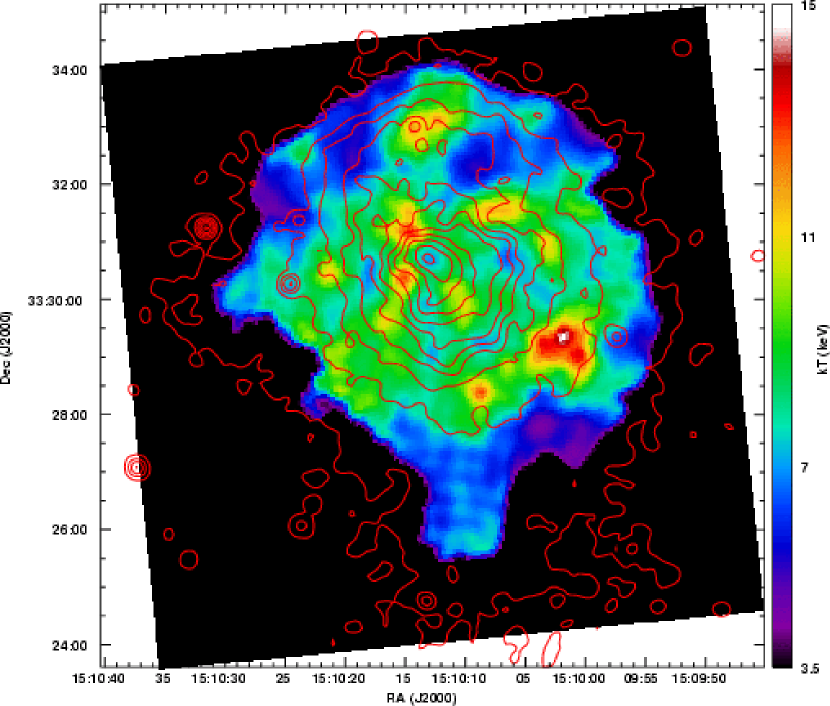
In Figure 7, we present an adaptively binned temperature map of the cluster. The temperature map was created using the adaptive binning algorithm described in Houck & Denicola (2000) and Houck, Wise, & Davis (in preparation). The algorithm extracts a spectrum at each pixel in the output map from a region which is as small as possible while containing at least 800 counts. The maximum extraction region was 63″63″. The smallest extraction region used was 266266. For pixels around which it was not possible to extract 800 counts from a region of this maximum size, no spectrum was extracted and no temperature was calculated. Each spectrum was corrected for background using a spectrum from a matching region in the blank sky background file discussed in §2. Regions containing point sources were eliminated from the event lists used for the source and background spectra. The spectra were grouped to have a minimum of 20 photons per bin, then fit by a single MEKAL model with absorption fixed at the Galactic value, and abundance fixed at . The negative errors in the temperature map are less than 15% everywhere. The positive errors are larger since the average temperature is close to or above the upper limit of the Chandra spectral band, i.e. keV. Where the temperature is less than 8 keV, the positive errors are between 15% and 30%.
The temperature map shows inhomogeneities on scales roughly the size of the binning scale and larger. Since the binning washes out any inhomogeneities on smaller scales, and since the inhomogeneities span a range of scales up to several times the binning scale, it is likely that better photon statistics would reveal variations on even smaller scales. The temperature variations show no correlation with surface brightness. Because of the overall high temperature of the gas relative to the useful upper limit of the Chandra energy range, the excursions in the map to lower temperatures from the ambient temperature of 9 keV are statistically significant, while the excursions to higher temperature are not. Thus, the hot spot to the southwest is not significantly hotter than the surrounding gas at 90% confidence. In contrast, the cold spot corresponding to the central brightness peak is cooler than the surrounding gas at 90% confidence. On the other hand, excursions to higher temperature in regions of lower ambient temperature, such as the extended hot region just inside the northern cold front, are significant. This hot region is coincident with the middle part of the cold front, which has a less well defined edge than the rest of the front. As we will discuss in §6, this feature may be related to the development of a hydrodynamic instability in the front. A detailed spectral analysis of this hot region shows that it is significantly hotter than the gas to either side of it: keV compared to keV elsewhere just inside the cold front for a single-temperature MEKAL model with the absorption and abundance fixed as above. We discuss this hot spot in greater detail in §6
4.4. Mass Distribution
Combining the surface brightness and temperature profiles from above, we produce two mass profiles of the cluster in each of the five sectors: a profile of the gas mass, and a profile of the total gravitational mass. The gas mass is determined primarily by the surface brightness profile, which is deprojected under the assumption that the cluster is spherically symmetric. The temperatures from the variable-abundance fits were used to derive the emissivity. The gravitational mass is calculated by deriving the pressure in each concentric annulus and applying the condition of hydrostatic equilibrium to derive the necessary mass interior to the given shell. The gravitational and gas masses are plotted in Figure 8.
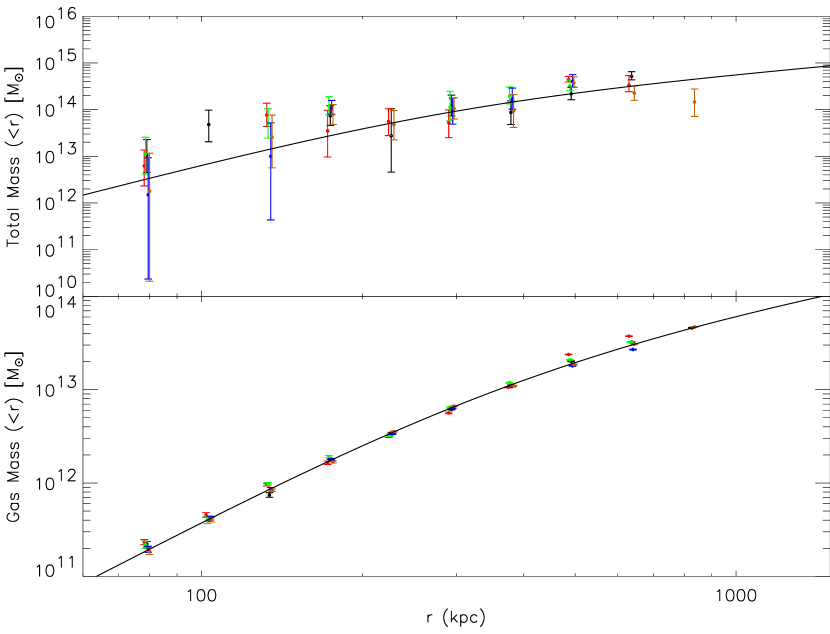
As can be seen from the figure, the gas masses determined from the different sectors are quite consistent. This should not be surprising given the similarities between the surface brightness profiles. The gravitational mass profiles are not as well determined as those of the gas mass, for several reasons. The first is the scatter in the temperature measurements, which contribute directly to the pressure calculations. The second is that the calculation of the gravitational mass assumes that the cluster is in hydrostatic equilibrium. Since it is undergoing a merger and shows evidence of relative motion between the gas in different parts of the cluster, such as the cold front in sector 2 (the red points in Figure 8), it is almost certainly not in hydrostatic equilibrium. Not only is the gas unlikely to be at rest relative to the gravitational potential, it has also probably been heated by the merger beyond the temperature one would derive simply by applying the hydrostatic condition to a cluster with the combined mass of the original subclusters (Randall, Sarazin, & Ricker, 2002).
Also shown in Figure 8 is a mass profile derived from the -model fit produced in §4.1, under the assumption that the cluster is isothermal. Here we used the mean temperature from the spectral models in §4.2 with fixed abundance. This model fits the data remarkably well, both for the gas mass and total mass profiles, particularly at large radii. At radii less than the core radius of the -model ( kpc), the fit to the gravitational mass is worse. In this region, however, the pressure gradient should be small, and since our method for determining the gravitational mass from the data involves computing pressure differences between points, the accuracy of mass at these radii is suspect.
Using the outermost bin for which we have estimates of both the gas mass and the gravitational mass, the gas mass fraction is 13%. The -model mass profile gives a similar fraction. This fraction is consistent with the typical value of 10–20% (David et al., 1995; Allen et al., 2002, all for km s-1 Mpc-1).
5. South Excess
As mentioned above, there is a faint, large scale excess of emission to the south and southwest on the cluster periphery. In the ROSAT image of the cluster (Figure 2, this excess appeared to be linear, leading us to believe that it was likely to be a merger shock. As mentioned in §3, the Chandra image of the cluster shows this region to be much more diffuse, and not a sharp feature at all. It appears much more round, and probably extends off the south edge of the detector. The ROSAT image, with its large field-of-view, shows that the south excess does indeed extend about 4′ past the edge of the ACIS-I detector. The excess is slightly more than 8′ across, so approximately half of the south excess is outside the field-of-view of the ACIS-I detector.
We fit the south excess with a two-temperature MEKAL model, with one component’s parameters fixed at the values determined at the same distance from the cluster center and to the northeast of the excess, and the other component’s temperature, abundance and normalization allowed to vary. This second component was found to have a temperature of keV and an abundance of . Thus, the south excess is cooler than the gas in the main body of the Abell 2034 cluster. The excess in this region therefore cannot be due to shock compression of this hotter gas.
One possible interpretation is that the south excess is a smaller cluster which is merging with Abell 2034, but which has not yet been shock heated by the interaction. This would explain the low temperature of the south excess. However, the flux from the south excess is much too low for a 4.9 keV cluster at , if it follows the standard – relation for clusters (e.g. Markevitch, 1998).
Another possible explanation of the south excess is that it was originally a relatively small, cool, and X-ray faint subcluster which has been shock heated to keV as a result of a merger with Abell 2034. There are two possible concerns with this explanation. First, there is no evidence for a strong interaction between the south excess and the main cluster in Abell 2034. Second, the observed temperature of the south excess is lower than might be expected for gas shocked while merging with the main cluster, given the very high temperature of Abell 2034. This is true even for the measured upper limit on the temperature of the south excess. However, it is possible that the merger shock was a weak oblique shock resulting from an offset merger (a merger with a large impact parameter), or that the south excess region originated as substructure within Abell 2034 and did not fall through the full potential well of the cluster. It is also possible that while the subcluster was initially shock heated, it has since had time to adiabatically expand as the center of its dark matter potential has moved ahead of the gas. This would require the subcluster either to have a very small mass or to be a quite advanced merger, probably having already fallen through the cluster. Otherwise, the cumulative effect of ram pressure over the lifetime of the merger would be insufficient to decouple the gas from the potential.
Alternatively, we consider the possibility that the south excess is a cluster at a considerably larger redshift than that of Abell 2034. By requiring that this cluster fit the – relation of Markevitch (1998), it must be at a redshift of . Unfortunately, there are no strong line features in the X-ray spectrum of the south excess region, so it is not possible to determine the redshift associated with this emission directly from the spectrum. There are only a handful of faint galaxies visible in the Digital Sky Survey 2 (DSS-2) red image in the region of the south excess. This would be consistent with the south excess being associated with a moderately distant cluster. Assuming the brightest cluster galaxy had an absolute magnitude of , it would have an apparent R magnitude at a redshift of , and would be only slightly above the sensitivity limit of the DSS-2. The bulk of the galaxies in the cluster would therefore be below the limit of the DSS-2. We assume a rest frame color and take -corrections from Coleman, Wu, & Weedman 1980. We have obtained moderately deep optical and near infrared images of the field, which will be described in a subsequent paper, along with a more detailed analysis of the X-ray emission from this region. Even deeper optical imaging and follow-up spectroscopy should also be done to verify the existence and proposed redshift of this background cluster.
6. Northern Cold Front
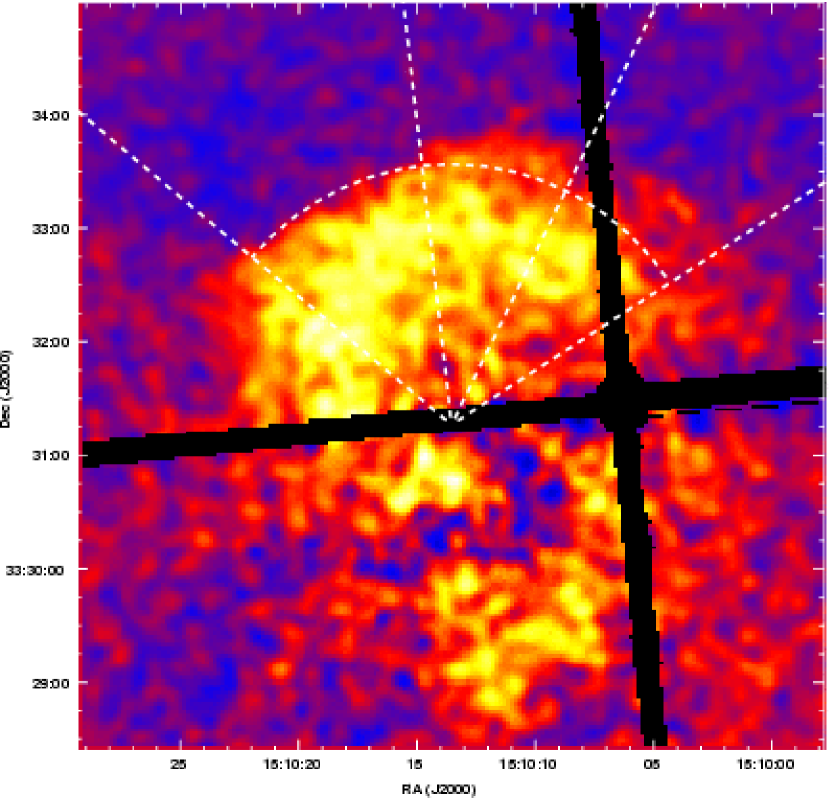
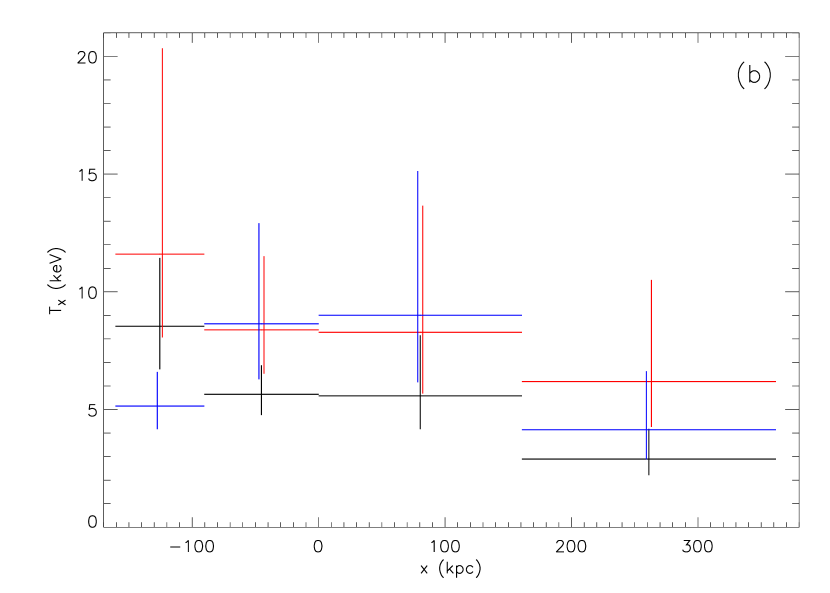
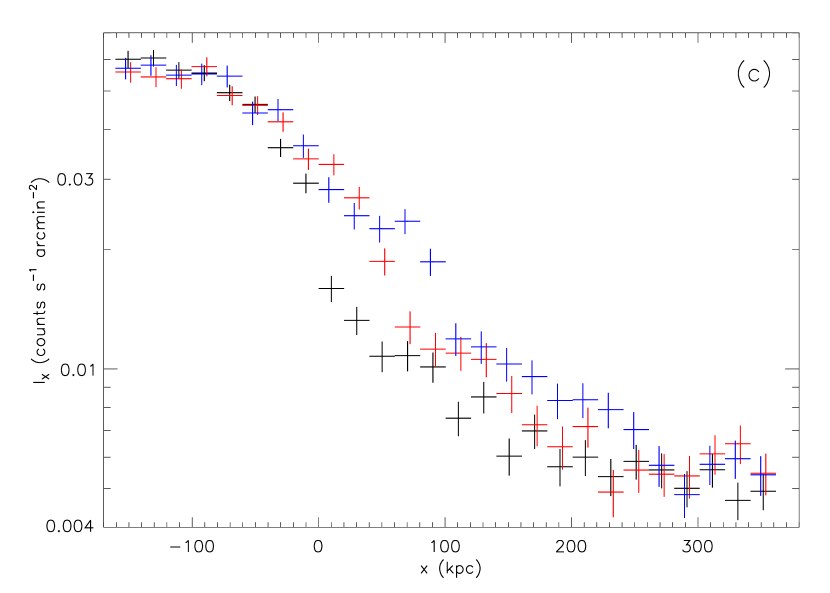
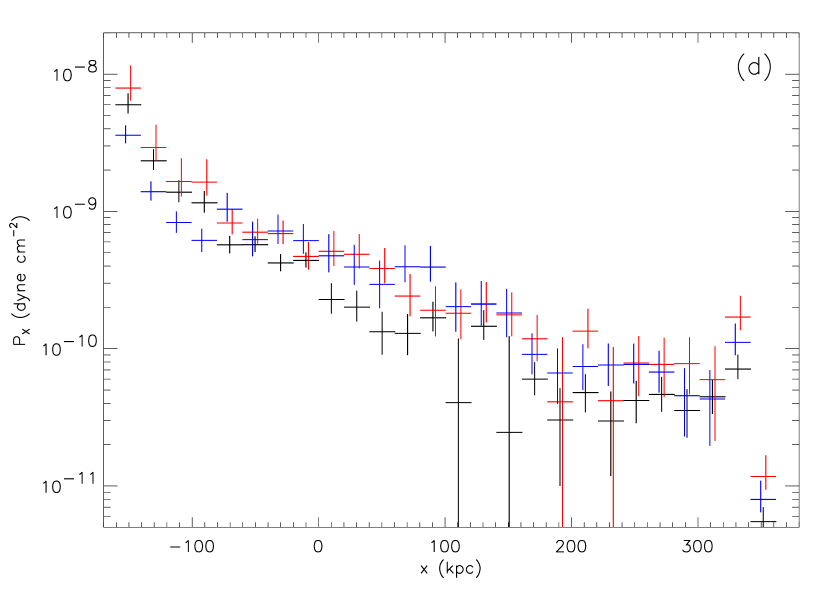
To the north, the cluster contains a sharp surface brightness discontinuity which was visible in an earlier ROSAT image (Fig. 2). As with other such features seen prior to Chandra, it was initially assumed to be a merger shock. Also like some other features of its kind, it in fact has turned out to be a “cold front” of the type first discovered in Abell 2142 (Markevitch et al., 2000), although the temperature contrast is small relative to Abell 2142 or other similar cases, and the front itself does not appear to be stable. In addition, the density contrast across the front is lower than in other clusters: it is at most a factor of 2, compared to factors of 2–4 observed in other cold fronts e.g. A2142, Markevitch et al., 2000; A3667, Vikhlinin et al., 2001a. The cold front in Abell 2034 may also be less regular than those observed in other clusters. The temperature contrast across the front is also low: the gas inside the surface brightness edge is not significantly cooler than that outside the edge. We conclude therefore that it is a cold front, since the high surface brightness side of the edge is hot hotter than the low surface brightness side, and therefore it cannot be a merger shock. As can be seen in Figure 9a, there is a region of excess emission ahead of the cold front to the north and northwest of the front. Moreover, the gas inside the center of the cold front is hotter than the rest of the gas inside the front (see Figure 9b), a further indication that the front may be unstable. The leading edge of the cold front is roughly circular within of its axis of symmetry. The axis of symmetry is at a position angle of approximately clockwise from North. The cD galaxy associated with the cold front is ahead of the front, west of the axis of symmetry. The projected direction of motion, then, is probably somewhere between these two values.
We extracted surface brightness and temperature measurements from a set of concentric circular annular wedges which were defined to match the curvature of the cold front as well as possible (see Figure 9a). These annuli were divided into three sectors so that the boundaries of the sectors bracketed the hot region in the center of the front. The projected temperature and surface bright profiles are shown in Figure 9b,c. We then deprojected the surface brightness profile separately for each sector under the assumption of spherical symmetry. The low surface brightness of the gas in these regions serves to minimize projection effects in the temperature profile, so the differences between the projected temperature profile and a deprojected one would be minimal. We therefore used the projected profile for simplicity. The deprojected surface brightnesses were then converted to electron densities, which, when combined with the measured projected temperatures, produced pressure profiles in each of the three sectors (Figure 9d). As mentioned above, the density contrast across the front is less than a factor of two. The pressures are consistent with being continuous across the cold front in each sector, and remain continuous out to large radii. Both within the cold front and at large radii past the cD galaxy, the pressures are the same in each sector to within the errors. Just outside the cold front, however, the pressure in the two sectors containing the excess emission is higher than the pressure in the sector without the excess, although not by more than 2-. In all three sectors, the pressure drops with increasing distance from the cluster center.
The overpressure in the region of the excess emission, combined with the surprisingly hot gas in the central sector lead us to believe that the front is unstable. While the overpressure is measured at a fairly low significance, the difference in temperatures between the sectors inside the front is significant at greater than 90% confidence. Therefore, we consider a mechanism for creating an instability in the front. As we discussed in §3, the cD galaxy associated with the cold front has moved ahead of the front, as it has not been slowed by the ram pressure forces that affect the ICM. Since the dark matter is also presumably collisionless, it too has moved ahead of the cold front. This creates a situation in which the gradient of the potential is inverted relative to the density and pressure gradients in the gas that used to be at the center of the potential. Thus, the dense gas which was formerly at the center of the cluster is now further out from the center of the potential than is the less dense gas. In the absence of a gravitational potential inside the front, a Rayleigh-Taylor instability should form along the front (e.g. Jones, Ryu, & Tregillis, 1996). Instabilities should be visible if the timescale for their formation is short compared to the timescale of the merger. The timescale for the formation of this instability is dependent on the acceleration due to the potential. Unfortunately, since the dark matter and the X-ray emitting gas are decoupled, it is not possible to reliably measure the potential, for example using the technique described in Vikhlinin & Markevitch (2002)
A further test of the stability of the cold front comes from a measurement of its specific entropy. In a stable cold front centered on the gravitational potential, the gas in the center of the cold core has a lower specific entropy than the surrounding gas. Therefore, a higher specific entropy in the center of the cold front would indicate that cold core has been disrupted. The specific entropy is defined as
| (1) |
where the subscripts denote the two regions of interest. Since this estimate of the entropy is only useful in a qualitative sense, we approximate as , where is the X-ray surface brightness in a given region. We find that the hot region has a higher specific entropy than the surrounding gas, with . Disruption of the core by Rayleigh-Taylor instability could induce turbulence in the gas, which could explain the heating and consequent increase in entropy.
We should note that hydrodynamic instability is by no means the only possible explanation for the increase in entropy at the center of the front. A hydrodynamic shock, such as a merger shock, increases the specific entropy of the shocked gas. It is possible that a small merger shock has heated the gas at the center of the front and left the rest of it untouched, thereby increasing the entropy only in this central region.
Another possible explanation for the heating is that a now-extinct AGN associated with the cD or one of the other nearby galaxies had heated this gas at some point in the past. We find this explanation to be quite unlikely, however, as there is no evidence for radio activity in any of these galaxies, nor is there any evidence for diffuse emission on the scale of the hot region, even at low frequencies. The radio relic, discussed in the next section, covers a much larger area, including the cold gas to either side of the hot region.
7. Radio Relic
Kempner & Sarazin (2001) reported a tentative detection of a radio relic in Abell 2034 near the position of the cold front. The radio emitting electrons that produce relics are also expected to produce X-rays by Inverse Compton (IC) scattering off of Cosmic Microwave Background (CMB) photons. The ratio of radio flux to IC flux is equal to the ratio of the energy density in the magnetic field to that in the CMB. Measuring both the radio synchrotron and X-ray IC emission would allow both the magnetic field strength and the energy density in relativistic electrons to be determined.
To measure the strength of Inverse Compton emission, we have extracted the X-ray spectrum from the region of the radio relic, and fit it with the sum of a MEKAL model and a power-law model, with the photon index of the power-law set to , where is the relic’s spectral index as determined by Kempner & Sarazin (2001). This analysis is complicated by the temperature structure discussed in §6. To account for this, we extracted spectra separately from the regions having different temperatures and fit their temperatures separately while requiring a single power law model for the different regions. The spectra are extremely well fit by a single-temperature MEKAL model, with . The addition of a power-law component improves the fit marginally. The power-law component has a 1–10 keV flux of ergs cm-2 s-1, which implies a mean amplitude of the magnetic field of G (90% confidence), including the 1- measurement errors in the radio flux (Kempner & Sarazin, 2001). This is consistent with the magnetic field strengths derived from analyses of radio halos in other clusters (e.g. Feretti & Giovannini, 1996; Govoni et al., 2001). The errors on this measurement are admittedly quite large, but improved calibration of the Chandra detectors at energies below 1 keV could reduce the errors on this measurement in a future re-analysis of the data.
8. Summary
Our analysis of the Chandra observation of the massive, moderate redshift cluster Abell 2034 has revealed a number of interesting features. We have determined that the temperature of the cluster is fairly constant out to a radius of at least about 800 kpc. This includes the central region of the cluster, which shows no evidence for the large cooling flow that had previously been claimed. In contrast, the cluster shows some strong signatures of an ongoing merger. We have shown that the surface brightness discontinuity on the NE edge of the cluster consistent with a cold front which is in the process of being disrupted by a combination of ram pressure and the decoupling of the gas from the dark matter potential. This decoupling of the gas from the dark matter has also been demonstrated to have occurred in 1E0657-56 (Markevitch et al., 2002). A large concentration of galaxies, including a cD galaxy, is visible just ahead of the cold front. We suggest that these galaxies, including a cD galaxy, are centered on the potential well of a subcluster, and that the gas in the cold front was the cooling core of this subcluster. The collisionless galaxies and dark matter have now moved ahead of the collisional gas, which has been slowed by ram pressure during the merger. This has caused the front to begin to develop Rayleigh-Taylor instabilities. In addition to the cold front and the lack of a centrally condensed cooling flow, other major evidence for the cluster being out of equilibrium includes the significant offset of the central cD from the center of the X-ray emission.
We have made a weakly constrained detection of IC emission from the region of the proposed radio relic. The magnetic field derived from this limit is consistent with other measurements of cluster magnetic fields using radio halos.
There is a region of excess emission at a cooler temperature (4.9 keV at the redshift of Abell 2034) to the south of the main cluster. There is no clear evidence for any interaction between this gas and the main Abell 2034 cluster. The south excess is too faint to be an undisturbed cluster at the redshift of Abell 2034 or closer, if it follows the normal – relation. It could be the remnant of a shocked subcluster, but this too would be too faint, as shock heating would boost its luminosity by an amount that would keep it more or less consistent with the normal – relation. Instead, we suggest that the south excess is a background cluster at an estimated redshift of . Much more work is needed to confirm both the existence of and distance to this new cluster, including deep optical imaging and spectroscopy. We have begun this follow-up work, which we will discuss in a future paper.
References
- Abell et al. (1989) Abell, G. O., Corwin, H. G., & Olowin, R. P. 1989, ApJS, 70, 1
- Allen et al. (2002) Allen, S. W., Schmidt, R. W., & Fabian, A. C. 2002, MNRAS, 334, 11
- Buote & Tsai (1996) Buote, D. A. & Tsai, J. C. 1996, ApJ, 458, 27
- Coleman et al. (1980) Coleman, G. D., Wu, C.-C., & Weedman, D. W. 1980, ApJS, 43, 393
- David et al. (1999) David, L. P., Forman, W., & Jones, C. 1999, ApJ, 519, 533
- David et al. (1995) David, L. P., Jones, C., & Forman, W. 1995, ApJ, 445, 578
- Dickey & Lockman (1990) Dickey, J. M. & Lockman, F. J. 1990, ARA&A, 28, 215
- Ettori & Fabian (2000) Ettori, S. & Fabian, A. C. 2000, MNRAS, 317, L57
- Feretti & Giovannini (1996) Feretti, L. & Giovannini, G. 1996, in IAU Symp. 175: Extragalactic Radio Sources (Dordrecht: Kluwer), 333
- Govoni et al. (2001) Govoni, F., Feretti, L., Giovannini, G., Böhringer, H., Reiprich, T. H., & Murgia, M. 2001, A&A, 376, 803
- Houck & Denicola (2000) Houck, J. C. & Denicola, L. A. 2000, in ASP Conf. Ser. 216: Astronomical Data Analysis Software and Systems IX (San Francisco: ASP), 591
- Houck et al. (in preparation) Houck, J. C., Wise, M. W., & Davis, D. S. in preparation
- Jones et al. (1996) Jones, T. W., Ryu, D., & Tregillis, I. L. 1996, ApJ, 473, 365
- Kaastra (1992) Kaastra, J. S. 1992, An X-Ray Spectral Code for Optically Thin Plasmas, Tech. rep., Internal SRON-Leiden Report, updated version 2.0
- Kempner & Sarazin (2001) Kempner, J. C. & Sarazin, C. L. 2001, ApJ, 548, 639
- Liedahl et al. (1995) Liedahl, D. A., Osterheld, A. L., & Goldstein, W. H. 1995, ApJ, 438, 115
- Markevitch (1998) Markevitch, M. 1998, ApJ, 504, 27
- Markevitch et al. (1998) Markevitch, M., Forman, W. R., Sarazin, C. L., & Vikhlinin, A. 1998, ApJ, 503, 77
- Markevitch et al. (2002) Markevitch, M., Gonzalez, A. H., David, L., Vikhlinin, A., Murray, S., Forman, W., Jones, C., & Tucker, W. 2002, ApJ, 567, L27
- Markevitch et al. (2000) Markevitch, M., Ponman, T. J., Nulsen, P. E. J., Bautz, M. W., Burke, D. J., David, L. P., Davis, D., Donnelly, R. H., Forman, W. R., Jones, C., Kaastra, J., Kellogg, E., Kim, D.-W., Kolodziejczak, J., Mazzotta, P., Pagliaro, A., Patel, S., Van Speybroeck, L., Vikhlinin, A., Vrtilek, J., Wise, M., & Zhao, P. 2000, ApJ, 541, 542
- Mohr et al. (2000) Mohr, J. J., Reese, E. D., Ellingson, E., Lewis, A. D., & Evrard, A. E. 2000, ApJ, 544, 109
- Randall et al. (2002) Randall, S. W., Sarazin, C. L., & Ricker, P. M. 2002, ApJ, 577, 579
- Struble & Rood (1999) Struble, M. F. & Rood, H. J. 1999, ApJS, 125, 35
- Vikhlinin et al. (2001a) Vikhlinin, A., Markevitch, M., & Murray, S. S. 2001a, ApJ, 551, 160
- Vikhlinin et al. (2001b) —. 2001b, ApJ, 549, L47
- Vikhlinin & Markevitch (2002) Vikhlinin, A. A. & Markevitch, M. L. 2002, Astronomy Letters, 28, 508
- White (2000) White, D. A. 2000, MNRAS, 312, 663