11email: paola, caccia, braito, rdc, tommaso, anna@brera.mi.astro.it 22institutetext: Dipartimento di Astronomia, Università di Padova, Vicolo dell’Osservatorio 2, I-35122, Padova, Italy 33institutetext: Subaru Telescope, National Astronomical Observatory of Japan
33email: kaz, sasaki, akiyama@subaru.naoj.org 44institutetext: Okayama Astronomical Observatory, NAOJ
44email: yoshida@oao.nao.ac.jp 55institutetext: X-ray Astronomy Group, Department of Physics and Astronomy, Leicester University, Leicester LE1 7RH, UK
55email: mgw@star.le.ac.uk 66institutetext: Instituto de Fisica de Cantabria (CSIC-UC), Avenida de los Castros, 39005 Santander, Spain
66email: barcons, carreraf@ifca.unican.es 77institutetext: Max-Planck-Institut fur extraterrestrische Physik, 85741 Garching, Germany
77email: wnp@mpe.mpg.de 88institutetext: Centre d’Etude Spatiale des Rayonnements, 9 avenue du Colonel Roche, 31028 Toulouse Cedex 04, France
88email: webb@cesr.fr
XMM-Newton observations expose AGN in apparently normal galaxies
We have performed a detailed analysis of 3 optically normal galaxies extracted from the XMM Bright Serendipitous Source Sample. Thanks to the good statistics of the XMM-Newton data, we have unveiled the presence of an AGN in all of them. In particular, we detect both X–ray obscured (N1022 cm-2) and unobscured (N1022 cm-2) AGNs with intrinsic 2–10 keV luminosities in the range between 1042 – 1043 erg s-1. We find that the X–ray and optical properties of the sources discussed here could be explained assuming a standard AGN hosted by galaxies with magnitudes MM∗, taking properly into account the absorption associated with the AGN, the optical faintness of the nuclear emission with respect to the host galaxy, and the inadequate set–up and atmospheric conditions during the optical spectroscopic observations. Our new spectroscopic observations have revealed the expected AGN features also in the optical band. These results clearly show that optical spectroscopy sometimes can be inefficient in revealing the presence of an AGN, which instead is clearly found from an X–ray spectroscopic investigation. This remarks the importance of being careful in proposing the identification of X–ray sources (especially at faint fluxes) when only low quality optical spectra are in hand. This is particularly important for faint surveys (such as those with XMM-Newton and Chandra), in which optically dull but X-ray active objects are being found in sizeable numbers.
Key Words.:
Galaxies: active - X-rays: galaxies1 Introduction
The existence of an intriguing population of galaxies with X–ray properties suggesting the presence of an AGN, but without any obvious sign of activity in their optical spectra, has been claimed some 20 years ago from the analysis of observations taken with the Einstein Observatory (e.g. Elvis et al. Elvis81 (1981), Maccacaro et al. Maccacaro1 (1987)). This discovery has been subsequently supported by ROSAT data (e.g. Griffiths et al. Griffiths (1995); Tananbaum et al. Tananbaum (1997); Pietsch et al. Pietsch (1998); Worrall et al. Worrall (1999); Lehmann et al. Lehmann (2001), Lehmann1 (2002)) and more recently also by Chandra (Fiore et al. Fiore (2000); Barger et al. 2001a , 2001b , Barger3 (2002)) and XMM-Newton (Comastri et al. Comastri1 (2001), 2002a , 2002b ) observations. These sources, characterized by high X–ray luminosities (L5x1041 erg s-1) and X–ray–to–optical flux ratios similar to those of AGN (-1Log(1), have been named in a variety of ways: Optically Dull Galaxies (Elvis et al. Elvis81 (1981)); Passive Galaxies (Griffiths et al.Griffiths (1995)) and more recently X-ray Bright Optically Normal Galaxies (XBONG, Comastri et al. 2002a ). If an AGN is really present in their nuclei, the lack of evident optical emission lines has to be justified. Different scenarios have been proposed so far: a) the AGN is a BL Lac object; b) the nuclear activity is outshone by the stellar continuum; c) the lines could not be efficiently produced or they could be absorbed by material beyond the NLR. Although the broad–band properties of one XBONG in the HELLAS2XMM survey (Brusa et al. Brusa (2002)) are consistent with the presence of a BL Lac object, which are usually X–ray unobscured sources, most of the optically dull galaxies seem to be obscured in the X–ray domain (Mainieri et al. Mainieri (2002)). This last finding is mainly based on the hardness ratio analysis (Barger et al. 2001a , 2001b , Barger3 (2002), Comastri et al. 2002b ). Recently, Moran et al. (Moran (2002)) have obtained integrated (i.e. nucleus+host galaxy) optical spectra of a sample of nearby Seyfert 2 galaxies obscured in the X–ray band in order to simulate ground-based spectroscopic observations of the more distant X–ray optically dull galaxies under investigation in deep Chandra surveys. They find that, due to the limitations of optical spectroscopic observations (e.g. wide slits, low resolution, low signal–to–noise, inadequate spectral coverage), optically type 2, X–ray obscured AGN could be easily undetected in the optical band. In this context, Comastri et al. (2002b ) have recently shown that the distribution of X–ray–to–optical flux ratio of XBONG sources could be well reproduced assuming that the underlying SED of the putative AGN is that of an X–ray Compton–thick AGN. In spite of this, the nature of this kind of sources is still far from being completely understood. Indeed, in the majority of the cases, the poor X–ray statistics obtained so far on this class of sources has not allowed us to unambiguously establish the presence of an AGN nor to study its nature.
In this paper we present new XMM-Newton and optical data for 3 sources belonging to the XMM Bright Serendipitous Sample (XMM-BSS hereafter, Della Ceca et al. DellaCeca_estec (2001); Della Ceca DellaCeca_como (2002)). On the basis of the optical spectra available from the literature or taken as a part of the AXIS111http://www.ifca.unican.es/xray/AXIS/ project (Barcons et al. 2002a , 2002b ), these three XMM–BSS sources were classified, at first glance, as normal galaxies. The same sources should be instead classified as AGN candidates on the basis of their X–ray luminosities and their X–ray–to–optical flux ratios (see Sect. 2). With the aim of investigating the true nature of these three objects we have studied, thanks to the good X–ray statistics of the XMM-Newton data, their X–ray spectral properties (see Sect. 3). This analysis has allowed us to develop a simple model (described in Sect. 4.1) which, starting from the X–ray properties of the AGN present in these sources, has allowed us to explain: a) why the nuclear emission is undetected in the optical spectra already available and b) what kind of optical observations are needed to unveil the AGN also in the optical domain. Subsequent spectroscopic observations performed with a more suitable observational set–up (i.e. narrower slits or larger spectral coverage) have allowed us to unveil the AGN features in the optical band. The main results obtained for each source are discussed in Sect. 4.2, 4.3 and the conclusions are reported in Sect. 5. Throughout this paper we assume H0=65 km s-1 Mpc-1 and =0.3, =0.7.
2 XMM-BSS Optical Dull Galaxies: broad-band properties
The XMM-BSS sample is an on–going project carried out by the XMM Survey Science Centre (XMM–SSC, Watson et al. Watson (2001)) with the aim of complementing the results obtained by the deep Chandra surveys (CDF-N, Brandt et al. Brandt (2001); CDF-S, Rosati et al. Rosati (2002), Giacconi et al. Giacconi (2002)) and by the deep (Lockman Hole, Hasinger et al. Hasinger (2001)) and medium–deep XMM-Newton surveys (AXIS, Barcons et al. 2002a , 2002b ; HELLAS2XMM, Baldi et al. Baldi (2002)). It is planned as a large (1000 sources), high Galactic latitude (20o) sample of bright (F10-13 cgs) serendipitous XMM-Newton sources. The sample definition and selection criteria are described in Della Ceca et al. (DellaCeca_estec (2001), DellaCeca_como (2002)).
| # | XMMJ | R | z | F0.5-4.5keV | F2-10keV | L2-10keV | Log (F2-10keV/Fopt)a |
|---|---|---|---|---|---|---|---|
| (mag) | (10-13 cgs) | (10-13 cgs) | (1042 cgs) | ||||
| 1 | 021822.3-050615.7 | 14.81 | 0.0442 | 0.39 | 3.013 | 1.3 | -1.23 |
| 2 | 031859.2-441627.6 | 16.74 | 0.13954 | 1.18 | 1.63 | 8.8 | -0.64 |
| 3 | 075117.9+180856.1 | 18.35 | 0.2552 | 1.32 | 1.64 | 30.6 | -0.03 |
a Fopt is the integrated flux in the Cousin R band system.
More specifically:
).
1 The magnitude reported for this source is in the Sloan r’ filter.
In order to calculate the
for this source the r’ magnitude has been transformed in
RCousin magnitude using (r’- RCousin)=0.25
(Fukugita et al. Fukugita (1995)).
2 AXIS project (Barcons et al. 2002a , 2002b ).
3 This source belongs only to the XMM–BSS sample defined in the 4.5–7.5 keV
hard band. The flux of the source in the hard band is:
F4.5-7.5keV=2.43x10⁻¹³ erg s-2 cm-2.
4 From the “ESO Nearby Abell Cluster Survey” catalogue
(Katgert et al. Katgert (1998),
ftp://adc.gsfc.nasa.gov/pub/adc/archives/journal_tables/A+AS/129/399/).
5 USNO magnitude.
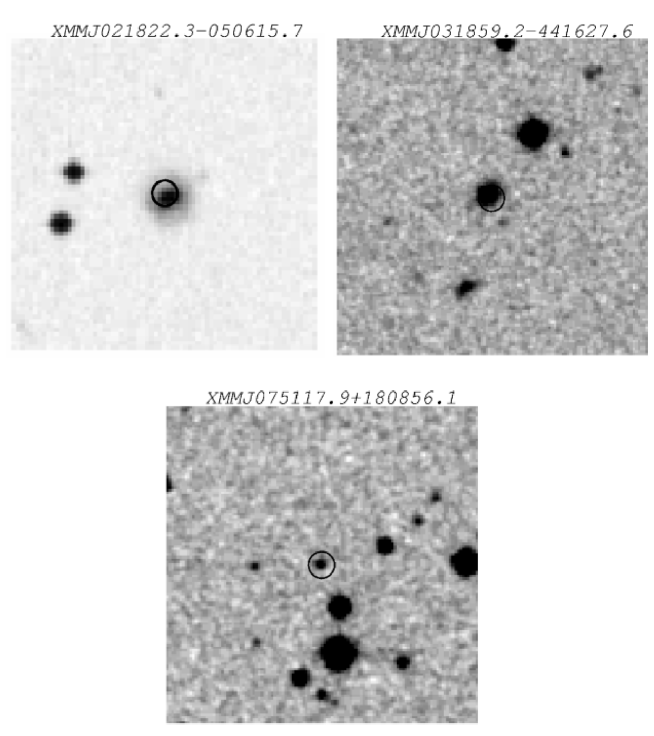
The relevant information on the optical and X–ray properties of the 3 sources discussed here are listed in Table 1. The first column gives an identification number that, for simplicity, will be used in this paper in place of the full XMM-Newton name reported in column 2. Columns 3 – 8 give: R magnitudes, redshifts, X–ray fluxes and luminosities corrected only for the Galactic absorption, and X–ray–to–optical flux ratios. Since the MOS calibration files are usually the best ones, the fluxes and luminosities used in this paper have been computed on the basis of the MOS data.
The optical finding charts are shown in Fig. 1 and more information on the individual sources are reported in the following sections. Sources #1 and #3 have been classified as normal galaxies on the basis of the optical spectra taken by the AXIS project (Barcons et al. 2002a , 2002b ), while the optical classification of source #2 is taken from Katgert et al. (Katgert (1998)). Only for source #1 the optical spectrum available covers the region where the H line is expected (6852 Å), while for the remaining two sources the H region is not sampled.
The X–ray properties of these three sources strongly suggest the presence of AGN activity: they have an X–ray luminosity L1042 erg s-1 (see Table 1) and an X–ray–to–optical flux ratio similar to the typical value of luminous AGN (-1Log()1; Maccacaro et al. Maccacaro (1988); Schmidt et al. Schmidt (1998); Akiyama et al. Akiyama (2000); Lehmann et al. Lehmann (2001)).
All the 3 sources presented here lie within the area covered by the Two Micron All Sky Survey (2MASS) and they have been detected in all near-infrared (NIR) bands (J, H, K). Only for source #2 the NIR magnitudes are not reported in the 2MASS cataloge yet. The colors of source #1 and #3 (2.8 and 3.0 respectively) are in agreement with those expected for an early–type galaxy (e.g. Mannucci et al. Mannucci (2001)).
For source #1 radio information is available from the Very Large Array (VLA) survey in the Subaru field region. The radio flux density is 32533 Jy at 1.4 GHz (Simpson et al. private communication), giving a power of 3x10²¹ W/Hz, typical of a radio-quiet AGN. Source #2 is not covered neither by the NVSS (NRAO VLA Sky Survey, Condon et al. Condon (1998)) nor by the FIRST (Faint Images of the Radio Sky at Twenty-cm, Becker et al. Becker (1995)) survey, while source #3, that lies within the area covered by the FIRST survey, does not have a radio counterpart within 20” radius (5 upper limit on the 1.4 GHz flux density of about 1.2 mJy).
3 XMM-Newton data
In this section we present the XMM-Newton data. The data have been processed using the SAS (Science Analysis System) version 5.3.3. Events files released from the standard pipeline have been filtered for high background time intervals. We have used the latest calibration files released by the EPIC team to create new response matrices that include also the correction for the effective area at the source position in the detector. The relevant information about the XMM-Newton observations are reported in Table 2. In particular the table lists: source identification numbers (col. 1), observation IDs (col. 2), exposure times after removing time intervals affected by background flares and taking into account all the instruments used (col. 3), net counts from all the instruments used (col. 4), detectors used for the scientific analysis (col. 5).
| Source | Observation ID | Exposure Time | Net Counts | Notes |
|---|---|---|---|---|
| [ks] | ||||
| #1 | 0112370101, 0112371001 | 281,0 | 148245 | MOS1+MOS2+PN |
| #2 | 0105660101 | 39,7 | 30522 | MOS2+PN |
| NO MOS1: source too close to a gap | ||||
| #3 | 0111100301 | 57,2 | 91346 | MOS1+MOS2 |
| NO PN: timing mode |
3.1 Spectral analysis
At the spatial resolution of XMM-Newton EPIC instruments, the 3 observed sources appear point–like. The X–ray spectra have been extracted using circular regions of appropriate radius (from 25″ to 30″). Background spectra have been extracted from larger (from 50″ to 60″) source–free circular regions close to the object. In order to improve the statistics, MOS1 and MOS2 data obtained with the same filter have been combined together and, finally, MOS and PN spectra have been binned in order to have at least 20 counts per energy channel.
The spectral analysis described in the following has been performed using XSPEC 11.0.1. Afterwards, unless otherwise stated, errors are given at the 90% confidence level for one interesting parameter (=2.71). For each source, the MOS and PN spectra have been fitted simultaneously in the 0.5–10 keV band, leaving free the relative normalizations. In the fitting procedure, the appropriate Galactic hydrogen column density along the line of sight has been taken into account (Dickey & Lockman Dickey (1990)).
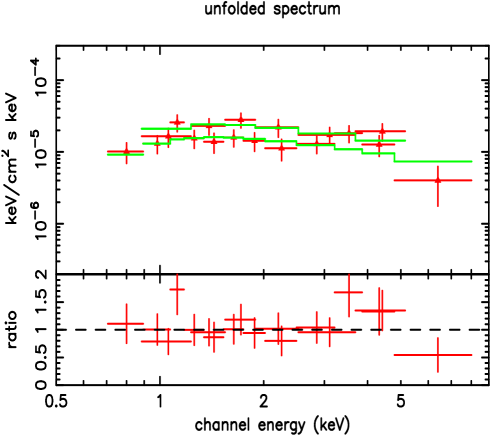
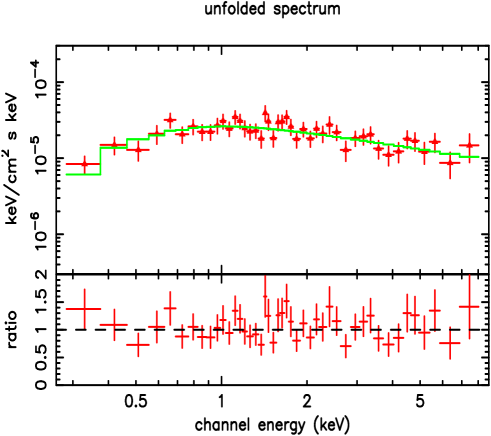
Two spectra (#2 and #3) are well described by a single absorbed power–law model. A pure thermal component is rejected for all the sources at more than 97% confidence level and the addition of a thermal component to the power–law model is not statistically required.
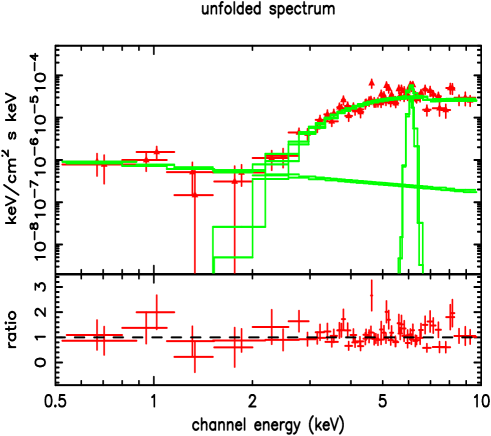
A good fit for source #1 is obtained with a two component model: a “leaky absorbed power-law continuum222 Consists of an absorbed plus an unabsorbed power-law with the same photon index.” plus a cold Iron 6.4 keV emission line; the addition of the latter improves the fit at more than 99% confidence level. A more detailed description of the X–ray properties of this source will be reported in a forthcoming paper by Watson et al. (in preparation). For all the 3 sources, the relevant best fit parameters, quoted in the rest frame, are summarized in Table 3 along with the unabsorbed luminosities. The best fit unfolded spectra and residuals are shown in Figures 2 to 4.
| Model: Leaky absorbed | L2-10keVa | ||||||
|---|---|---|---|---|---|---|---|
| power-law continua+ Gaussian Line | [keV] | [eV] | [1042 erg s-2] | ||||
| Source#1 | 2.47 | 1.66 | 20.54 | 6.36 | 300120 | 89.5/63 | 5.6 |
| Model: Single absorbed power-law | L2-10keVa | ||||||
| [1042 erg s-2] | |||||||
| Source#2 | 2.61 | 1.72 | 0.39 | 11/14 | 9.1 | ||
| Source#3 | 4.11 | 1.58 | 0.11 | 36/42 | 31.7 |
a MOS unabsorbed luminosity.
In summary, we find that all the spectra are well described by a power–law model. A thermal component is not required by the fit, in agreement with the point–like appearance of the X–ray emission and with the lack of evident clusters/groups in the optical images. These facts, combined with the high intrinsic X–ray luminosities of these objects, clearly suggest the presence of an AGN. A cold 6.4 keV Iron emission line component is required only for source #1. The equivalent width (300 eV) of this line is typical of a Compton-thin AGN (Bassani et al. Bassani (1999)). For the remaining two sources the upper limits on the are at least a factor 2 lower (at the 90% confidence level) than the typical value expected for a Compton-thick AGN ( 1 keV; Bassani et al. Bassani (1999)).
4 Discussion
4.1 Investigating the lack of optical emission lines
Having established, from the X–ray analysis, the presence of
AGN in the apparently normal galaxies
presented here, we now investigate if the lack of significant
emission lines in their optical spectra could be explained even
assuming a standard AGN.
To this end we use a simple model based on an AGN plus early-type galaxy
optical template333The noise is not included in our templates.
(Francis et al. Francis (1991), Elvis et al. Elvis94 (1994);
BC2000444The Bruzual & Charlot 2000
models have been retrieved via anonymous ftp: ftp.iap.fr)
to reproduce the available optical spectra.
The approach used for each source is summarized in the following steps:
1. the AGN template is normalized at 2500 Å on the basis
of the unabsorbed, rest-frame, 2 keV flux using a starting value of
555The
is defined here from 2500 to 2 keV in the rest frame:
log(f2500Å/f2keV)/log(/.=1.5 (the typical value of high-luminosity Seyfert and
quasars, Brandt, Laor, & Wills Brandt0 (2000));
2. assuming a Galactic standard value of
=1.7x10⁻²² mag cm-2 (Bohlin et al. Bohlin (1978))
and using the intrinsic NH value derived from the X–ray spectral analysis,
the
continuum and the broad line components of the AGN template are absorbed;
3. the AGN template is redshifted to the z of the source and
summed with a redshifted early–type galaxy template.
While the optical flux of the AGN template is then fixed on the
basis of the X–ray properties and the chosen ,
the optical normalization of the host galaxy is set
to reproduce the available spectrum. The latter is normalized
to the photometric
data in the R band (see Table 1) or, if possible, to the
fraction of the total light which has passed through the used slit,
taking into account also the atmospheric and seeing conditions
during the observations;
4. if in the final template (AGN+galaxy) evident emission lines are
present (i.e. visible at the S/N ratio of our observed spectrum),
the procedure is restarted from point 1, using a
lower value of
until a good reproduction of the available spectrum
is reached. The resulting represents then an upper limit
on the of the hidden AGN.
In the next sub–sections we discuss the results obtained for each of the 3 sources.
4.2 Source #1

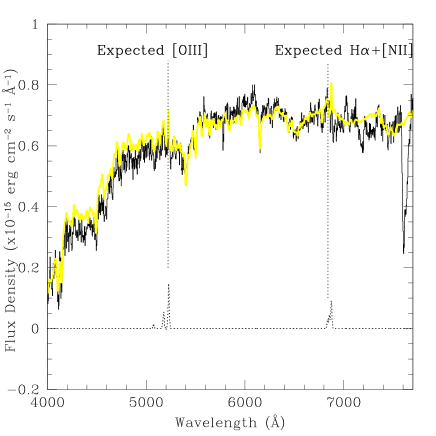
Source #1 has an X–ray spectrum typical of an obscured AGN. In this case the torus intercepts the line of sight and both the central engine and the Broad Line Region (BLR) should be hidden. On the basis of the AGN unified model (Antonucci et al. Antonucci (1993)) the optical spectrum should then be characterized by narrow emission lines produced by the Narrow Line Regions (NLR) placed outside the torus. However, no significant narrow emission lines are visible in the optical spectrum (left panel, Fig. 5) taken at the 3.58 m Telescopio Nazionale Galileo (TNG). The observed spectrum has been normalized to the fraction of the total light which has passed through the slit used (1.5″) under the atmospheric and seeing conditions (FWHM1″) during the observations. However the discrepancy between the X–ray properties and the optical spectrum could be only apparent. Indeed, using the approach described in Sect. 4.1, we find that an AGN with an intrinsic 1.3 and absorbed by an EB-V=350.1 mag (consistent with the measured N2x), could be completely undetectable in the observed optical spectrum. Actually, in this case no significant emission lines are expected to be detected, as it is shown in Fig. 5, right panel. Only hints of [OIII] (EW1 Å) and H+[NII] (EW1 Å) lines are present in the final model. At the signal–to–noise ratio (S/N) reached in the observed spectrum, these two hints of narrow emission lines are compatible with the intensity of the noise itself and they are not clearly detectable. In order to obtain a detection at about 10 of these two lines, a S/N higher than 70 should be reached. An alternative approach is to use a narrower slit in order to include a smaller fraction of the starlight of the galaxy and to make the nuclear emission lines detectable.
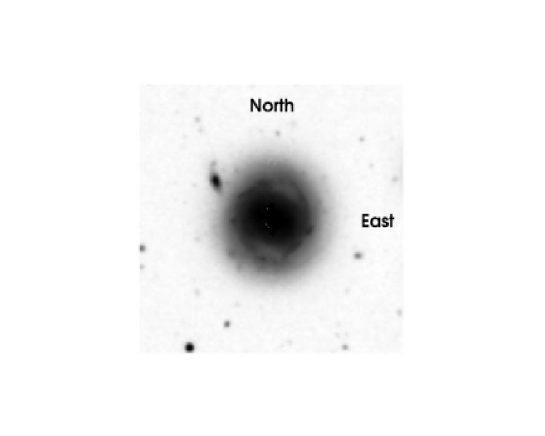
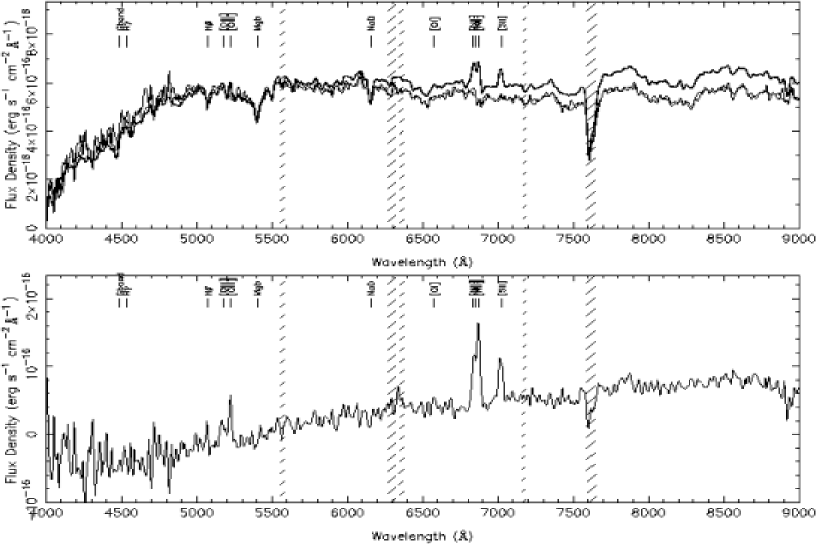
New imaging and spectroscopic observations for this source have been recently obtained with the 8.2 m Subaru Telescope. In Fig. 6 the R–band image of the galaxy obtained with the Subaru Prime Focus Camera (Suprime-Cam) is shown. The source looks like an early type barred galaxy with a weak nucleus and with a Magellanic Cloud like companion galaxy in the North-West direction. The spectroscopic observations, carried out with the Faint Object Camera And Spectrograph (FOCAS), has been performed using a 0.8″ slit under 0.6″ seeing conditions. The optical spectra obtained for the central region (total spectrum) and the host galaxy continuum are shown in the upper panel of Fig. 7. The host galaxy spectra have been extracted from north and south of the nuclear region and then normalized to the total spectrum at 5000Å. Weak emission lines can be seen in the total spectrum. When the host galaxy continuum is subtracted from the total spectrum (Total – Host, bottom panel), Seyfert 2 like emission lines can be clearly seen. This AGN detection technique (data with an adequate S/N ratio and a proper subtraction of the underlying starlight continuum) has been already used by Ho et al. (Ho (1995), 1997a , 1997b ) to search for Low Luminosity AGN. The Subaru data have thus allowed us to unveil the nuclear engine also in the optical band and to set more stringent constraints on its intrinsic optical–to–X–ray spectral index: 1.20.1. In this case, as in the following, the errors relevant on the values take into account the uncertainties on both the X–ray and the optical properties. We have estimated the ratio between the observed 2-10 keV flux and the strength of the [OIII]λ5007 narrow emission line. We have derived a F2-10keV/F[OIII] of 195160, which is consistent with the value expected for Seyfert galaxies (Bassani et al. Bassani (1999)). Moreover, this ratio combined with the EW of the measured Fe emission line ( 300 eV) clearly locates this source in the region populated by Compton–thin sources (see Fig. 1 in Bassani et al. Bassani (1999)), in agreement with our X–ray best fit model.
In summary, we conclude that a standard AGN, obscured by NH2x1023 cm-2 and with an intrinsic 2–10 keV luminosity of about 5x1042 erg s-1, can be completely misidentified using only optical spectroscopic criteria if it is hosted by an early–type galaxy of M22 mag (the M∗ value for a normal galaxy is about -21 mag, Brown et al. Brown (2001)). In particular, the AGN could be completely overwhelmed by the starlight of the galaxy if it is observed using too wide slits (which include more than 20% of the flux of the galaxy) and/or with a seeing and atmospheric conditions not good enough to reach an adequate S/N. It is worth noting that for more distant galaxies (0.4), that typically populate the deep Chandra and XMM-Newton surveys, it is almost impossible to get an optical spectrum that doesn’t include more than 20% of the flux of the host galaxy by using ground-based telescopes. At the moment, the presence of AGN in object like source #1 found in deep X–ray surveys can be unveiled in the optical band only using instrumentations on–board the Hubble Space Telescope.
4.3 Source #2 and #3
Sources #2 and #3 are respectively slightly obscured (N4x1021 cm-2) and unobscured (N1021 cm-2) in the X–ray domain and they should appear in the optical band as intermediate666Seyfert galaxies that have permitted lines with narrow and broad components of comparable intensities. (e.g. Maiolino et al. Maiolino (2001)) and/or broad line Seyfert galaxies.
Source #2 is located along the direction of the cluster Abell 3112 (v=19068 km/s) and its spectroscopic classification was taken from the “ESO Nearby Abell Cluster Survey” (ENACS) catalogue (Katgert et al. Katgert (1998), see the relevant footnote of Table 1 for the full web page address). This object was classified as a normal galaxy with no emission lines visible in the (unpublished) optical spectrum. The spectral range covered in the rest–frame was from 3940 to 5740 Å.
A first optical spectrum for source #3 was taken at the 3.58 m TNG Telescope as part of the AXIS project, covering a spectral rest–frame range from 3200 to 6400 Å. No evident emission lines were detected in this source and it was classified as an optically normal galaxy on the basis of the available optical spectrum.
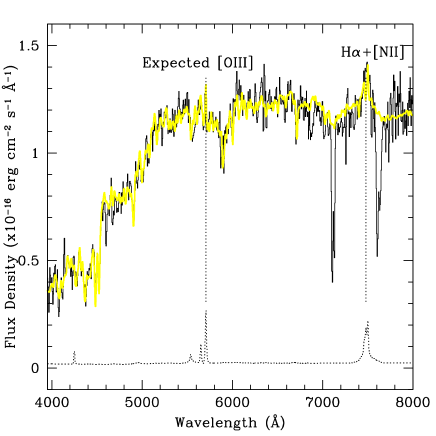
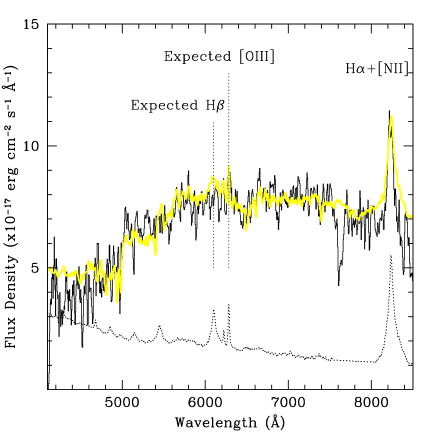
For these two sources (#2 and #3), AGN templates have been produced using the approach described in Sect. 4.1. Since we do not have enough information to normalize the AGN+galaxy template to the amount of light included in the slit during the observations, we have normalized both templates to their R band photometric point. In particular for source #2, for which we do not have in hand the observed optical spectrum, the type of the host galaxy template has been chosen so that the final composite template would match the photometric data in the B and R bands (Maddox et al. Maddox (1990); Katgert et al. Katgert (1998)). By assuming an intrinsic 1.5, we find that, although no evident emission lines are expected in the observed ranges, in both sources a prominent H emission line could be present in the yet unsampled region of the spectrum. For this reason, the two objects have been re–observed using a wider spectral coverage. In particular, source #2 has been re-observed with the 3.6 m ESO telescope (slit of 1.2″ and a seeing1.6″), while new observations for source #3 have been carried out at the UH 88 inches telescope (slit of 1.6″ and a seeing1.5″). In both spectra an evident H line emerges, unveiling the presence of an AGN in the optical band. The two new spectra are shown in Fig. 8 (black lines). They are normalized on the basis of the light included in the slit during the observations. Thanks to these new observations and using our model, an estimate of can be obtained: 1.250.2 and 1.20.2 for sources #2 and #3 respectively. In Fig. 8 the templates obtained are overlayed (grey lines) to the observed spectra.
Also for these two sources, the F2-10keV/F[OIII] ratios (118113 and 410400 for sources #2 and #3 respectively) are consistent with the values expected for Seyfert galaxies and the EWFe-Kα upper limits (EW 600 eV for source #2 and EW250 eV for source #3) indicate that these sources are located in the region populated by Compton–thin AGN (Bassani et al. Bassani (1999)), in agreement with the X–ray spectral analysis presented here.
On the basis of the quoted above, we have estimated the optical magnitudes of the nuclear engine and of the host galaxy: MR(AGN)18 mag, MR(host)22.5 mag for source #2 and MR(AGN)21 mag, MR(host)22 mag for source #3.
It is worth noting that while for objects like source #3 optical spectroscopy with an appropriate spectral coverage could easily allow us to recognize the presence of an AGN, this is not always the case. For instance, in the case of an object like source #2, but at a redshift greater than 0.2, the fraction of starlight included in the slit (e.g. 1.2″) is usually large enough to overwhelm the strongest lines, including H. Using our templates we have estimated that in such case (z0.2) the EW(H) would be 8 Å, i.e. the H line is extremely difficult to detect unless a very good S/N ratio is achieved.
5 Summary and Conclusions
In this paper we have presented the X–ray and optical spectra of 3 XMM–BSS sources selected using the criteria usually adopted to define the X-ray Bright Optically Normal Galaxies. The good statistics available for the XMM-Newton data has allowed us to unambiguously unveil the presence of an AGN in all of them. Once more, this result highlights how the X–ray data are the best way of finding AGN even for this kind of sources. In particular, we find that both X–ray obscured (N1022 cm-2) and unobscured (N1022 cm-2) AGN, covering a range of luminosities from 1042 to 1043 erg s-1, are hosted in these sources. No Compton–thick objects have been found.
Using the X–ray properties derived for each of the 3 sources, a simple model (developed in order to investigate the apparent lack of optical emission lines) and new optical observations, we find that:
-
– the AGN considered here are standard AGN hosted by galaxies with a magnitude MR brighter than M∗;
-
– X–ray obscured AGN with an intrinsic L51042 erg s-1 could be hidden in the optical band if they are hosted by a galaxy brighter than M22 mag;
-
– up to z0.2 slightly X–ray obscured AGN of L9x1042 erg s-1 could be partially overwhelmed by a host galaxy with M22.5 mag. The sampling of the H region should allow the AGN detection in the optical band. For z0.2 also the H line could be overwhelmed by the galaxy continuum using ground-based telescope observations;
-
– X–ray unabsorbed AGN of L31043 erg s-1 could be optically hidden if they are hosted by a galaxy with M22 mag and if the spectral coverage doesn’t include the H line.
In summary, we find that the X–ray and optical properties of the sources studied here do not require a non–standard AGN. The lack of significant emission lines in the optical spectra could be explained by an adequate combination of the absorption associated to the AGN, of the optical faintness of this latter with respect to the host galaxy and of an inadequate set–up and atmospheric conditions during the spectroscopic observations. In particular, the results reported here clearly show that in some cases a non appropriate wavelength coverage of the optical spectrum could be the cause of a misclassification, as an optically normal galaxy, of an X–ray source which is truly an AGN. A similar result was recently presented by Moran et al. (Moran (2002)) using a sample of nearby Seyfert 2 galaxies. In this respect, it is worth noting that from the X–ray deep surveys performed with Chandra (Barger et al. 2001a , 2001b , Barger3 (2002); Hornschemeier Hornschemeier (2001)) about 40–60% of the identified sources are optically classified as galaxies and for 70% of them the observed range does not include the H line. Our results, thus, remark the importance of being really careful in the optical identification of faint X–ray sources for which no good optical spectra are available. Moreover, even if the most likely explanation for the nature of XBONG galaxies proposed by different groups working on deeper surveys (e.g. Barger et al. Barger3 (2002); Comastri et al. Comastri1 (2001), 2002a , 2002b ) is the presence of heavily obscured AGN, our results suggest that XBONG galaxies could harbor X–ray unobscured AGN as well. Observational evidence supporting this last suggestion has already been presented from deep surveys by Page et al. (Page (2002)).
Acknowledgements.
We are grateful to M. Elvis and M. J. Page for useful comments. PS acknowledge financial support by the Italian Consorzio Nazionale per l’Astronomia e l’Astrofisica (CNAA). This work has received partial financial support from ASI (I/R/037/01) and from the Italian Ministry of University and Scientific and Technological Research (MURST) through grant Cofin 00-02-36. Part of the data presented in this paper have been accumulated through the AXIS project (http://www.ifca.unican.es/xray/AXIS/). XB and FJC acknowledge financial support from the Spanish Ministry of Science and Technology, under grant AYA 2000-1690. The NOT and TNG telescopes are operated on the island of La Palma by the Nordic Optical Telescope Scientific Association and the Centro Galileo Galilei of the INAF, respectively, in the Spanish Observatorio del Roque de Los Muchachos of the Instituto de Astrofísica de Canarias. We would like to thank also all of the staff members of the Subaru, ESO and Mauna-Kea Telescopes for their support during the observations and development of the instruments. The work reported herein is based partly on observations obtained with XMM-Newton, an ESA science mission with instruments and contributions directly funded by ESA member states and the USA (NASA). This publication makes use of data products from the 2MASS Two Micron All Sky Survey, which is a joint project of the University of Massachusetts and the Infrared Processing and Analysis Center/California Institute of Technology, funded by the National Aeronautics and Space Administration and the National Science Foundation. This research has made use of the NASA/IPAC Extragalactic Database (NED) which is operated by the Jet Propulsion Laboratory, California Institute of Technology, under contract with the National Aeronautics and Space Administration.References
- (1) Akiyama, M., Ohta, K., Yamada, T. 2000, ApJ, 532, 700
- (2) Antonucci R.R.J., 1993, ARA&A 31, 473
- (3) Baldi, A., Molendi, S., Comastri, A., et al. 2002, ApJ, 564, 190
- (4) Barcons, X., Carrera, F. J., Watson, M. G., et al. 2002a, A&A, 382, 522
- (5) Barcons, X., Carrera, F.J., Ceballos, M.T., et al. 2002b, Proc. of the ”X-ray surveys, in the light of the new observatories” workshop, Astronomische Nachrichten, in press
- (6) Barger, A.J., Cowie, L.L., Mushotzky, R., Richards, E.A. 2001a, AJ, 121, 662
- (7) Barger, A.J., Cowie, L.L., Bautz, M.W., et al. 2001b, AJ, 122, 2177
- (8) Barger, A. J., Cowie, L. L., Brandt, W. N., Capak, P., Garmire, G. P., Hornschemeier, A. E., Steffen, A. T., & Wehner, E. H. 2002, AJ, 124, 1839
- (9) Becker, R. H., White, R. L., & Helfand, D. J. 1995, ApJ, 450, 559
- (10) Bassani, L., Dadina, M., Maiolino, R., Salvati, M., Risaliti, G., Della Ceca, R., Matt, G., & Zamorani, G. 1999, ApJS, 121, 473
- (11) Bohlin, R.C., Savage, B.D., Drake, J.F. 1978, ApJ, 224, 132
- (12) Brandt, W. N., Laor, A., & Wills, B. J. 2000, ApJ, 528, 637
- (13) Brandt, W.N., Alexander, D.M., Hornschemeier, A.E., et al. 2001, ApJ, 122, 2810
- (14) Brown, W. R., Geller, M. J., Fabricant, D. G., & Kurtz, M. J. 2001, AJ, 122, 714
- (15) Brusa M., on the behalf of the HELLAS2XMM collaboration, 2002, Presented at AGN05: Inflows, Outflows and Reprocessing around black holes, Como (Italy), 11-14 June 2002.
- (16) Comastri, A., Brusa, M., Ciliegi, P. et al., Proc. Symposium “New Visions of the X-ray Universe in the XMM-Newton and Chandra Era”, 26-30 November 2001, ESTEC, The Netherlands (astro-ph/0203019)
- (17) Comastri, A., Mignoli, M., Ciliegi, P., et al. 2002a, ApJ, 571, 771
- (18) Comastri, A., Brusa M., Mignoli, M., the HELLAS2XMM collaboration, 2002, Proc. workshop ”X-ray surveys in the light of the new observatories”, to be published in AN (astro-ph/0211306)
- (19) Condon, J. J., Cotton, W. D., Greisen, E. W., et al. 1998, AJ, 115, 1693
- (20) Della Ceca, R., Maccacaro, T., Caccianiga, A., et al. Proc. Symposium “New Visions of the X-ray Universe in the XMM-Newton and Chandra Era”, 26-30 November 2001, ESTEC, The Netherlands (astro-ph/0202150)
- (21) Della Ceca, R., on the behalf of the XMM-Newton Survey Science Centre (SSC) CONSORTIUM, Proc. workshop ”AGN05: Inflows, Outflows and Reprocessing around black holes”, Como (Italy), 11-14 June 2002 (astro-ph/0211081)
- (22) Dickey, J. M. & Lockman, F. J. 1990, ARA&A, 28, 215
- (23) Elvis, M., Schreier, E. J., Tonry, J., Davis, M., & Huchra, J. P. 1981, ApJ, 246, 20
- (24) Elvis, M., Wilkes, B. J., McDowell, J.C., et al. 1994, ApJS, 95, 1
- (25) Fiore, F., La Franca, F., Vignali, C., et al. 2000a, New Astronomy, 5, 143
- (26) Francis, P.C., Foltz, C.B., Chaffee, F.H., et al. 1991, AJ, 101, 1121
- (27) Fukugita, M., Shimasaku, K., & Ichikawa, T. 1995, PASP, 107, 945
- (28) Giacconi, R., Zirm, A., Wang, J., et al. 2002, ApJS, 139, 369
- (29) Griffiths, R. E., Georgantopoulos, I., Boyle, B. J., et al. 1995, MNRAS, 275, 77
- (30) Hasinger, G., Altieri, B., Arnaud, M., et al. 2001, A&A, 365, L45
- (31) Ho, L. C., Filippenko, A. V., & Sargent, W. L. W. 1997b, ApJ, 487, 568
- (32) Ho, L. C., Filippenko, A. V., & Sargent, W. L. W. 1997a, ApJS, 112, 315
- (33) Ho, L. C., Filippenko, A. V., & Sargent, W. L. 1995, ApJS, 98, 477
- (34) Hornschemeier A. E., Brandt W. N., Garmire G. P., et al., 2001, ApJ, 554, 742
- (35) Katgert, V., Mazure, A., den Hartog, R., et al. 1998, A&AS, 129, 399
- (36) Lehmann, I., Hasinger, G., Schmidt, M., et al. 2001, A&A, 371, 833
- (37) Lehmann, I., Hasinger, G., Murray, S.S, Schmidt, M., 2002, Proc. of “The High Energy Universe at Sharp Focus: Chandra Science”, held in conjunction with the 113th Annual Meeting of the ASP, Eric M. Schlegel and Saeqa Dil Vrtile Eds., 2002, ASP Conf. Series, Vol. 262, p. 105
- (38) Maddox, S.J., Sutherland, W.J., Efstathiou, G., Loveday, J. 1990, MNRAS, 243, 692
- (39) Maccacaro, T., Gioia, I. M., Schild, R., Maccagni, D., & Stocke, J. 1987, IAU Symp. 121: Observational Evidence of Activity in Galaxies, 121, 469
- (40) Maccacaro, T., Gioia, I. M., Wolter, A., Zamorani, G., & Stocke, J. T. 1988, ApJ, 326, 680
- (41) Mainieri, V., Bergeron, J., Hasinger, et al. 2002, A&A, 393, 425
- (42) Maiolino, R., Marconi, A., Salvati, M., Risaliti, G., Severgnini, P., Oliva, E., La Franca, F., & Vanzi, L. 2001, A&A, 365, 28
- (43) Mannucci, F., Basile, F., Poggianti, B. M., et al. 2001, MNRAS, 326, 745
- (44) Moran, E. C., Filippenko, A. V., Chornock, R. 2002, ApJ, 579, L71
- (45) Page M. J., McHardy I. M., Gunn K. F., et al. 2002, Proc. of the ”X-ray surveys, in the light of the new observatories” workshop, Astronomische Nachrichten, in press (astro-ph/0212035)
- (46) Pietsch, W., Bischoff, K., Boller, et al. 1998, A&A, 333, 48
- (47) Rosati, P., Tozzi, P., Giacconi, R., et al. 2002, ApJ, 566, 667
- (48) Schmidt, M., Hasinger, G., Gunn, J., et al. 1998, A&A, 329, 495
- (49) Tananbaum, H., Tucker, W., Prestwich, A., & Remillard, R. 1997, ApJ, 476, 83
- (50) Watson, M. G., Auguères, J.–L., Ballet, J., et al. 2001, A&A, 365, L51
- (51) Worrall, D. M., Birkinshaw, M., Remillard, R. A., et al. 1999, ApJ, 516, 163