An X-ray Image of the Composite SNR G16.7+0.1
Abstract
We have observed the Galactic supernova remnant G16.7+0.1 for 13 ks using the EPIC cameras aboard the XMM-Newton X-ray Observatory, producing the first X-ray image of the remnant. This composite radio remnant has a core radio flux density of only 100 mJy, making it one of the faintest radio synchrotron nebulae yet detected, although the core-to-shell flux ratio at 6 cm is typical of the growing class of composite remnants. Our image is seriously contaminated by bright arcs produced by singly reflected X-rays from the X-ray binary GX17+2 which lies just outside the field of view, providing an interesting data analysis challenge. Nonetheless, the remnant’s synchrotron core is clearly detected. We report on the spectrum and intensity of the core emission as well as on our search for emission from the thermal shell, and describe the constraints these observations provide on the remnant’s distance, age, and central pulsar properties.
keywords:
supernova remnants; X-rays: general1 Introduction
Recently, imaging above 3.5 keV has led to a flurry of discoveries of X-ray synchrotron nebulae and, in some cases, to the pulsars which power them. Some nebulae, in common with the prototypical Crab Nebula, show no evidence of a surrounding shell created by the supernova explosion. But the majority of such objects are “composites” showing a flat-spectrum, polarized radio and power-law X-ray synchrotron nebula, presumably powered by a central pulsar, encircled by a typical supernova remnant (SNR) shell. X-ray observations of both Crab-like and composite remnants provide crucial information on the poorly known initial distribution of pulsar magnetic field strengths and spin periods, as well as on the ages and dynamics of the supernovae which created them.
G16.7+0.1 is a classic composite remnant with one of the faintest radio core components detected to date (Helfand et al. 1989). It has comparable radio luminosities in the core and shell components; the shell and core radii are ′ and ′, respectively. A recently published catalog of X-ray sources derived from the ASCA Galactic Plane Survey lists G16.7+0.1 as a detection (Sugizaki et al. 2001), although the ASCA angular resolution is insufficient to resolve the source. We undertook imaging spectroscopy of the source with XMM-Newton in order to separate the shell and core components, determine their luminosities, and search for the central pulsar.
In section 2 we describe our observations and the analysis procedures employed. Section 3 presents the results of this analysis for the remnant’s X-ray core, surrounding shell, and presumably associated (but undetected) pulsar. We conclude in section 4 with a discussion of the implications of these results for G16.7+0.1, and place this source in the context of the class of composite remnants.
2 Observations and Analysis Procedures
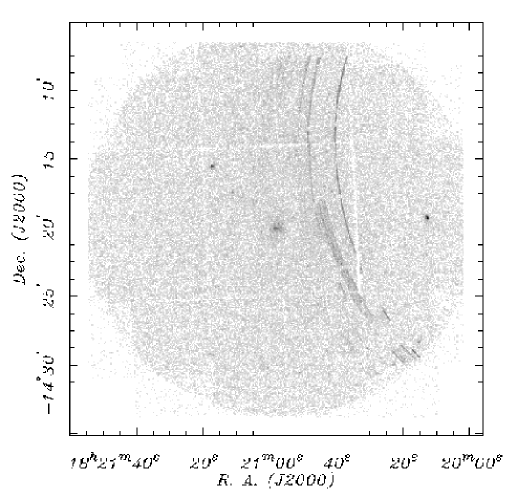
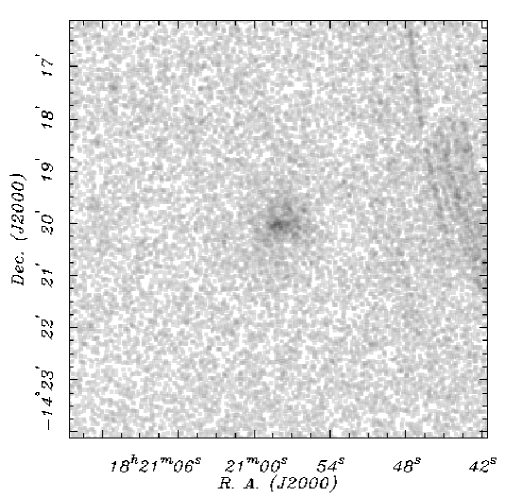
G16.7+0.1 was observed on 2001 March for 13 ks with the EPIC camera on board the XMM-Newton Observatory (Jansen et al. 2001) (see Figure 1). Data were obtained from all three cameras which comprise the EPIC (European Photon Imaging Camera) instrument. The two MOS cameras (Turner et al. 2001) and the PN camera (Strüder et al. 2001) are CCD arrays sensitive to photons with energies between 0.1 and 15 keV; the field of view is 30′ in diameter. The CCD pixel sizes are 1.1 and 4.1′′, respectively, while the mirror point spread function (PSF) is ′′ full-width half maximum. G16.7+0.1 was observed with the medium filter and in full-image mode, so that the time resolution is 2.5 s for the MOS data and 73 ms for the PN. We verified the images’ astrometric accuracy by optically identifying the bright source on the central MOS chip (at XMM reported RA(J2000) , DEC(J2000) for MOS1 and RA , DEC for MOS2). This source is coincident with a USNO catalog star; its position agreed with the average MOS position to within 0.01 s in Right Ascension and 3.15′′ in Declination, within the astrometric accuracy expected.
The XMM Standard Analysis System (SAS111version 5.2+, xmmsas-20010728-0329) allows one to filter the data for good events within the camera’s energy range, thereby removing most contamination from internal background and cosmic ray particles. In addition, we examined the light curves for each instrument and removed intervals corresponding to high background activity. The resulting filtering produced 8.8 ks of data for the two MOS cameras, and 5.5 ks for the PN camera.
The absorption column density to the remnant is high, suggesting a relatively large distance to the source. As a consequence, few source photons are detected at energies keV. Unless otherwise noted, all spectral fitting was done over the energy range of to keV, with the upper limit being slightly different for each camera. Furthermore, the position of the remnant on the PN camera was perilously close to the gap between two chips. These data were therefore used exclusively to verify consistency with our primary results, obtained from MOS1 and MOS2.
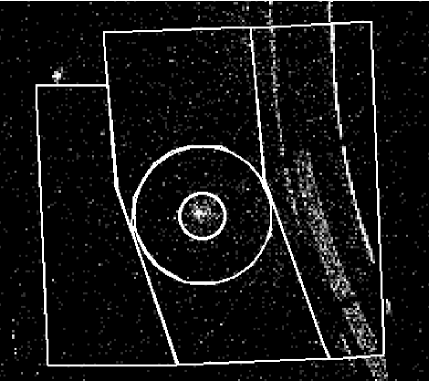
Bright arcs are easily visible in the data from all three EPIC detectors. We believe that these are due to single-scatter photons from the nearby (but outside the field of view) bright X-ray binary GX17+2. In order to characterize the contribution of these arcs to the source background (where they are dim but present), we first compared the spectra of different arc regions to detect possible variations. Finding none, we divided the central MOS chip into three polygonal areas. This geometry mimics the elliptical shape of the arcs, so that a given region contains a full section of any arc present in that part of the chip.
Figure 2 shows the central chip in the filtered MOS1 image. The area to the right of the remnant is used to characterize the arcs, and the area to the left to characterize the “normal” background (the bright USNO source is excluded from the latter region). These regions are defined exclusively on the central chip to avoid having to account for chip-to-chip variations. The central polygon corresponds to the source background, and encloses two circles centered on the source; the larger includes the entire radio remnant (R = 135), while the smaller zeroes in on the brightest emission region, comparable in size to the radio synchrotron core (R = 45). The circles are centered at RA(2000) , DEC(2000) , consistent with the SNR’s apparent geometrical center at 6 cm (Helfand et al. 1989). The areas are obviously not equal and scalings are applied when correcting or comparing them.
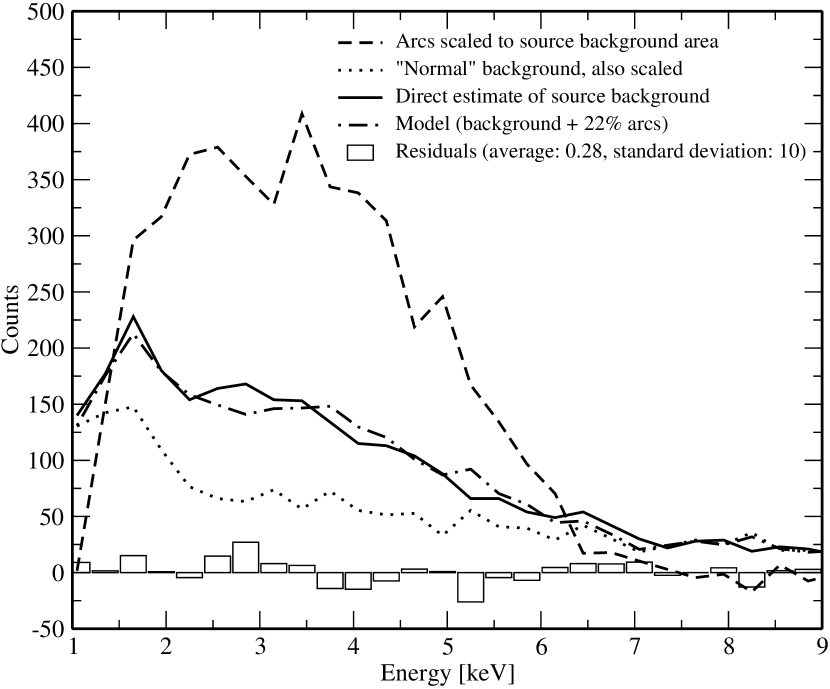
Figure 3 summarizes the process by which we modeled the arcs’ contribution to the source background. The dotted line corresponds to the normal field background; the dashed line is the arcs’ spectrum, corrected to remove the contribution of this “standard” noise. The supernova remnant is detected against a background which is a weighted sum of the arc and the normal background contributions. We therefore compared a number of spectra obtained by summing the two to a spectrum directly extracted from the central polygon (without the remnant). In Figure 3, the source background spectrum is the solid curve, while the dot-dashed curve corresponds to the best-fit, weighted sum of normal background and arc spectra (background spectrum + 0.22 arc spectrum). The residuals, obtained by subtracting this model from the direct estimate of the source background, are included. This process was repeated for MOS2, using regions defined similarly on the chip to enclose the arc and source emission and then weighting by factors appropriate to the region areas (background spectrum + 0.6 arc spectrum) to produce a model spectrum. The models obtained for the background allowed us to quantify and remove the contamination of our observation of G16.7+0.1 by the arcs due to GX17+2.
These background models were applied using locally generated RMF and ARF files, and spectra grouped to contain a minimum of . We also used the canned response files, available from the XMM-Newton website222http://xmm.vilspa.esa.es/ccf/epic/, to check for consistency. All errors are quoted for a 1- confidence range.
3 Analysis and Results
3.1 The X-ray core
We began by analyzing the bright X-ray core of G16.7+0.1 which we take to represent a pulsar wind nebula (PWN; see Figure 1). Spectra were extracted from the MOS images for a circular region of radius 45′′ as described above. We used the standard XSPEC spectral analysis software to fit the spectra simultaneously, with the energy range included being slightly different for the two data sets: 1 to 8.4 keV for MOS1 and 1 to 7.5 keV for MOS2. As noted above, the column density to the remnant is high, and few photons below 1 keV are detected; the upper limits are set by the data quality.
We found that a power-law spectrum modified by interstellar absorption provides an excellent description of our data for the X-ray core. We find a photon index and a column density , with a reduced (31 dof) for a fit using the background models created as described above and locally generated RMF and ARF files (see Figure 4); the results obtained using the canned response files are essentially identical, with (31 dof). Fixing and to these values when fitting the extracted PN spectrum (for a smaller circular area of R = 28′′ chosen to avoid portions of the source which fell in the interchip gap) produced a (12 dof) over the energy range 1 to 10 keV. The nominal power law slope for G16.7+0.1 is slightly flatter than that of any known PWN (see Gotthelf 2003 for a recent summary), although within the errors it is consistent with the slopes of the young pulsars in G11.2-0.3 and G54.1+0.3.
For comparison with these results, we retrieved the ASCA data from the HEASARC333This research has made use of data obtained from the High Energy Astrophysics Science Archive Research Center (HEASARC), provided by NASA’s Goddard Space Flight Center. archive and extracted the Gas Imaging Spectrometer (GIS) data in the 0.5-8 keV band within a radius of . We find a background-subtracted count rate of counts s-1 per GIS. Using the spectral parameters from the MOS fits, the HEASARC tool PIMMS predicts a 1–8 keV MOS count rate of 0.042 counts s-1, within of the observed value. Returning to the XMM data, we estimated the hardness ratio of the core for the two cameras (Table 1). The hardness ratio, defined as (N Nsoft)/(N Nsoft), where N is the number of counts, is , precisely that expected for the spectral parameters derived from our fits.
| Table 1: Core Hardness | ||||
|---|---|---|---|---|
| Observation | Counts (s-1) | Hardness | ||
| Length (s) | 1 to 3 keV | 3 to 8 keV | Ratio | |
| MOS1 | 8763.5 | 8.18 | 3.25 | |
| MOS2 | 8801.9 | 8.27 | 2.68 | |
The total Galactic HI column density in the direction of G16.7+0.1 is . Generally, the X-ray-derived value for is two to three times greater than the neutral hydrogen column density derived from 21 cm observations for a given object, owing to contributions from X-ray absorbing atoms in the molecular and ionized phases of the interstellar medium (Gorenstein and Tucker 1976). The high X-ray value we derive is comparable to that found for the composite remnant Kes 75 (Helfand, Collins, & Gotthelf 2003) which has a measured distance of 19 kpc. This suggests that the G16.7+0.1 is at the very least on the far side of the Galactic Center, and we adopt D = 10 kpc for our calculations. The unabsorbed flux for the SNR’s bright core is ergs cm-2 s-1 in the 0.5 to 10 keV band, corresponding to an X-ray luminosity of ergs s-1.
3.2 The extended nebula
In order to compare the outer regions of the X-ray remnant with the known radio shell component, we attempted to extract spectra for an area equivalent to the remnant shell as defined by the radio data (Helfand et al. 1989), an annulus with inner and outer radii of and , respectively. In all other respects the analysis was the same as for the core, with the background models being scaled appropriately for the the area of the annulus.
Unfortunately the small number of counts (roughly 100 for each camera) from the X-ray shell does not allow us to constrain the nature of this emission or even to comment on its hardness ratio relative to that of the core. The matter is further complicated by the likely presence of a dust-scattering halo from the pulsar wind nebula. As noted by Helfand et al. (2003) in their analysis of Kes 75, from 10-20% of the PWN flux in the 1-3 keV band is scattered into a halo with an angular diameter of for column densities similar to that measured here. From the count rates recorded in Table 1, and applying the technique outlined in Helfand et al. (2003), it appears that only of the photons recorded in our annulus are attributable to a dust-scattering halo in the soft band, while at higher energies the scattered fraction declines substantially. Thus, the remnant does appear to have a net flux associated with the radio shell. We therefore use PIMMS to determine the flux, over the 0.5 to 10 keV range, of a putative Raymond-Smith thermal plasma component (with solar abundances) responsible for emission from this SNR shell. Fixing the column density to our best fit value, we obtain the intrinsic luminosities listed in Table 2 for a range of possible temperatures (not including any correction for a dust halo).
| Table 2: X-ray Shell Luminosity | |
|---|---|
| kT | |
| (keV) | (D ergs s-1) |
| 0.5 | |
| 1 | |
| 1.5 | |
Assuming D = 10 kpc and R = 135′′ for the SNR shell gives a radius of 6.5 pc, while the R = 45′′ core has a radius of 2.2 pc. The distance-independent ratio of core-to-shell diameters is therefore 0.3, consistent with the ratios found from 6 cm observations of other composite remnants (Helfand & Becker 1987). Furthermore, assuming that it is in the free-expansion phase with km s-1, G16.7+0.1 is roughly 2100 years old.
3.3 A central point source
It is interesting to place an upper limit on any contribution from a point source to the flux detected from the bright X-ray core. Ghizzardi (2001) provides the best fitting parameters for in-flight measurements of the PSF shape444 and for the King profile and an on-axis source; the mean energy is 1.8 keV for this fit.. Comparing the PSF to the profile of the bright core for the MOS1 and MOS2 data over the 1 to 7 keV range for which the PSF parameters are very nearly constant, we find that a point source can contribute no more than 37% of the core’s flux. The consequent upper limit to the source luminosity of ergs s-1 is comparable to that of the young pulsar at the center of G11.2-0.3 (Torii et al. 1997) and fifty times less than that from the luminous, young pulsar in Kes 75 (Helfand et al. 2003).
4 Discussion
The PWN in G16.7+0.1 has a radio luminosity of ergs s-1. Thus we find a value for the core luminosity ratio , slightly above the mean value of 15 found for sixteen composite remnants compiled by Helfand (2002). It is similar to that of G11.2-0.3 () and CTB80 (), and intermediate between the very young and energetic objects such as Kes 75 (), and older remnants such as Vela (). Its X-ray shell to core luminosity ratio () is poorly constrained, but is roughly similar to that of G11.2-0.3, as is its shell to core diameter ratio (both are ); for a distance of 10 kpc, the physical diameters of both components are also comparable. Thus, the X-ray and radio properties of the remnant are consistent with that of an object with an age of a few thousand years housing a moderately energetic pulsar.
Seward & Wang (1988) have outlined a method for obtaining the characteristics of a pulsar from the PWN luminosity over the 0.2 to 4 keV range. Our observations of G16.7+0.1 yield a luminosity of ergs s-1 in this energy range; this produces an estimate that the unseen pulsar’s ergs s-1. Table 3 gives the characteristics of the pulsar derived from this as a function of age assuming the pulsar’s initial spin period .
| Table 3: G16.7+0.1 Pulsar Characteristics | |||
|---|---|---|---|
| Age | P | ||
| ( years) | (s) | ( s s-1) | ( G) |
| 2.1 | 0.332 | 2498 | 29 |
| 5 | 0.215 | 680 | 15 |
| 10 | 0.152 | 240 | 6 |
More recently, van der Swaluw and Wu (2001) have suggested a method of estimating the pulsar initial spin periods in composite remnants from the relative sizes of the PWN core and the remnant shell. For G16.7-0.3, they infer a value s for , which yields the quoted above. Using the well-know relations between the pulsar spin parameters and magnetic fields, and assuming a braking index of 3, this initial spin period and an age of 2000 years leads to a current spin period of 0.33 s and a rather high magnetic field strength of G. Such a pulsar would have a spin-down luminosity erg s-1 (as above), sufficient to drive the observed X-ray luminosity of the PWN if the efficiency for the conversion of rotational kinetic energy to X-rays was as low as 0.8%, significantly below that of the most efficient X-ray producers (e.g., G29.7-0.3 at 6.5%; Helfand et al. 2003). For a 5000-year old remnant, the current period and magnetic field strength would be s and a more moderate G.
In conclusion, this first X-ray image of G16.7-0.3 finds it to be consistent with a classic composite SNR with a central PWN driven by a pulsar with typical parameters. All that remains to confirm this picture is the detection of the pulsar itself and the measurement of its spin parameters. A scheduled Chandra observation should provide the detection and point-source strength, allowing a followup observation with XMM to detect the pulse period.
Acknowledgements.
Acknowledgments — D.J.H. acknowledges support from grant NAG5-9928. E.V.G. is supported by NASA LTSA grant NAG5-7935. We thank the XMM help desks for their assistance and the anonymous referee for a meticulous review that led to significant improvements in the manuscript.References
- (1) Ghizzardi, S., 2001, ‘In Flight Calibration of the On Axis and Near Off Axis PSF for the MOS1 and MOS2 Cameras’, Istituto di Fisica Cosmica “G. Occhialini”, Milan, Italy (available on the World-Wide-Web at “http://www.ifctr.mi.cnr.it/simona/pub/PSF_inorbit-MCT.ps.gz”)
- (2) Gorenstein, P. and Tucker, W. 1976, AARA, 14, 373
- (3) Gotthelf, E.V. 2003, ApJ (in press; astro-ph0303155)
- (4) Helfand, D.J., & Becker, R.H. 1987, ApJ, 314, 203
- (5) Helfand, D.J., Velusamy, T., Becker, R.H., & Lockman, F.J. 1989, ApJ, 341, 151
- (6) Helfand, D.J. 2002, High Energy Studies of Supernova Remnants and Neutron Stars Symposium–The 34th COSPAR Assembly, E1.4-0019-02
- (7) Helfand, D.J., Collins, B.F., & Gotthelf, E.V. 2003, ApJ 582, 783
- (8) Seward, F.D., & Wang, Z. 1988, ApJ, 332, 199
- (9) Sugizaki, M., Mitsuda, K., Kaneda, H., Matsuzaki, K., Yamauchi, S., & Koyama, K. 2001, ApJS, 134, 77
- (10) Strüder, L., Briel, U., Dennerl, K., et al. 2001, A&A, 365, L18
- (11) Torii, K., Tsunemi, H., Dotani, T., & Mitsuda, K. 1997, ApJ, 489, L145
- (12) Turner, M.J.L., Abbey, A., Arnaud, M., et al. 2001, A&A, 365, L27
- (13) van der Swaluw, E., & Wu, Y. 2001, ApJ, 555, L49