J-type Carbon Stars in the Large Magellanic Cloud
Abstract
A sample of 1497 carbon stars in the Large Magellanic Cloud has been observed in the red part of the spectrum with the 2dF facility on the AAT. Of these, 156 have been identified as J-type (i.e. -rich) carbon stars using a technique which provides a clear distinction between J stars and the normal N-type carbon stars that comprise the bulk of the sample, and yields few borderline cases. A simple 2-D classification of the spectra, based on their spectral slopes in different wavelength regions, has been constructed and found to be related to the more conventional c- and j-indices, modified to suit the spectral regions observed. Most of the J stars form a photometric sequence in the colour magnitude diagram, parallel to and 0.6 mag fainter than the N star sequence. A subset of the J stars (about 13 per cent) are brighter than this J-star sequence; most of these are spectroscopically different from the other J stars. The bright J stars have stronger CN bands than the other J stars and are found strongly concentrated in the central regions of the LMC. Most of the rather few stars in common with Hartwick and Cowley’s sample of suspected CH stars are J stars. Overall, the proportion of carbon stars identified as J stars is somewhat lower than has been found in the Galaxy. The Na D lines are weaker in the LMC J stars than in either the Galactic J stars or the LMC N stars, and do not seem to depend on temperature.
keywords:
Galaxies: Large Magellanic Cloud, Stars: carbon1 Introduction
The green-red optical spectra of carbon stars are dominated by the Swan bands of and bands from the red A –X system. Also present in some carbon stars are isotopic bands from the and molecules: stars showing strong isotopic bands are known as J-type carbon stars. In most carbon stars the molecular bands are so strong that they obscure most atomic lines in all but very high-resolution spectra. Despite this, carbon stars are recognised in four principal spectroscopic groups [Keenan 1993] – R, N, CH and J, plus several rarer types such as hydrogen-deficient carbon stars (H-d). The basic characteristics of the R stars are relatively strong fluxes in the blue-violet and moderately strong isotopic bands, whereas the N stars have heavy diffuse absorption in the blue, weak or absent isotopic bands, and show enhancements in the strengths of the lines of light s-process elements such as Ba. The CH stars are characterised by strong bands from the CH molecule and the J stars by strong isotopic bands. Abundance analyses show that J stars have : ratios as low as 4, whereas the common cool N stars have : ratios between 40 and the solar value of 80 [Lambert et al. 1986]. Like the R stars, the J stars do not show enhanced lines from the s-process elements. Some J stars exhibit infrared emission from oxygen-rich dust shells [Lloyd Evans 1990].
The types of Galactic carbon star are also associated with different stellar populations. According to Barnbaum, Stone & Keenan [Barnbaum et al. 1996]), Galactic N stars are bright giants with belonging to the thin disk, the R stars are normal giants with belonging to the thicker disk, indicating that they probably arise from lower mass, older progenitors, while most CH stars are bright with and belong to the Galactic halo, i.e., old Population II. In contrast, relatively little is known of the J stars. Abia & Isern [Abia & Isern 2000] have concluded that the evolutionary status of the J stars is still uncertain in that standard evolutionary AGB models are unable to explain properly the observed chemical properties of the J stars; they have also discussed various mechanisms for providing additional mixing within the stars. They mention the possible existence of two groups of Galactic J stars with different luminosities arising from stars of different initial mass and perhaps following different evolutionary mechanisms.
The stellar content of the Large Magellanic Cloud (LMC) includes a large population of about 8000 observable carbon stars [Kontizas et al. 2001b] which, being at a known distance and suffering from very little interstellar reddening, provides an excellent source for studying the photometric and spectroscopic properties of carbon stars. Carbon stars are much more common in the LMC than in the Galaxy, as measured by the ratio of C to late-M stars which is 2.2 in the LMC and 0.001 in the Galactic Bulge [Blanco & McCarthy 1983]; this is believed to be a consequence of the overall lower metallicity in the LMC, although a difference in star formation history may also be critical. Until now, most of the LMC J stars known were those identified as such by Richer, Olander & Westerlund [Richer et al. 1979] from an early catalogue of carbon stars [Westerlund et al. 1978] which naturally selected the brightest carbon stars. Some fainter J stars had been found and seen to lie photometrically near the lower envelope of the N star distribution (Richer [Richer 1981], Bessell, Wood & Lloyd Evans [Bessell et al. 1983] and Westerlund et al. [Westerlund et al. 1991]), but in all these cases the number of faint J stars was small. Hence, it was thought that the J stars were brighter than the N stars, but with a few faint exceptions. It is important to study the J-star population in the LMC in greater numbers and down to fainter magnitudes to determine how these stars are related to the other types of carbon star both photometrically and kinematically.
In order to address these and other issues, an extensive programme of spectroscopy of LMC carbon stars has been started, using the 2dF multi-object spectroscopy facility on the Anglo-Australian Telescope (AAT) [Cannon et al. 1999]. The new dataset includes more than 150 J stars. This paper describes these spectra. It is organised as follows: Section 2 describes the observations and Section 3 describes how the sample of J stars was selected. The J stars by no means form a homogeneous set of spectra. Consequently, they are divided into groups according to their overall spectral appearance. This is done in Section 4. Photometry in is available for most of the stars and is described in Section 5. Section 6 is a more detailed spectral study of the stars, and some individual stars are described in Section 7. The overall results are discussed in Section 8.
2 Observations
Most of the carbon stars observed with 2dF were selected from the newly completed catalogue of 7760 carbon stars by Kontizas et al. [Kontizas et al. 2001b] – KDMK01 (see also Dapergolas et al. [Dapergolas et al. 1996]). This catalogue was constructed by identifying the strong (1, 0) and (0, 0) Swan bands of carbon stars seen in low-dispersion spectra on an objective-prism survey taken in the blue-green with the 1.2 m UK Schmidt Telescope (UKST).
The 2dF instrument on the AAT enables up to 400 spectra to be recorded simultaneously, in a pair of identical fibre-fed spectrographs fitted with TEK 1024 CCDs [Lewis et al. 2002] – see http://www.aao.gov.au/2df/. Most of the spectra for this programme were obtained during January and November 1998. These spectra were taken in the red, centred on the = +2 Swan bands near 6200Å. The first set of observations covered four 2-degree diameter fields in the wavelength range 5675–6785Å, and the second set gave five fields in the wavelength range 5585–6700Å. Thus, the strong (0, 1) Swan band at 5635Å was included in the second set of observations but not in the first set, whereas the latter included the Li i 6708 line which is the subject of a separate paper [Hatzidimitriou et al. 2003]. One field was common to both sets of observations to provide checks on the system. Most of the stars observed fall in the brightness range . Altogether, 1600 carbon star spectra were obtained on eight field centres arranged approximately on a 10∘ long north-south strip across the central parts of the LMC.
The 1200R gratings were used, yielding spectra with 1.1Å per pixel or an effective resolution of Å. Several exposures were taken for each field, typically 3 900 s or 2 1200 s, together with offset sky, arc and flat field exposures. The data were reduced with the AAO’s 2dfdr data reduction package [Bailey et al. 2001] and the iraf package, and yielded spectra with signal-to-noise ratio (S/N) usually around 30 per pixel. Full details of the observations are given by Cannon et al. (in peparation).
One central LMC field was re-observed in January 2002, using the 1200B gratings to give blue spectra in the wavelength range 4190–5290Å at 1.1Å per pixel. This was done as part of the ATAC Service Observing Scheme.
Radial velocities of all the stars were obtained by using a cross-correlation technique in figaro. The high S/N usually attained for most stars, typically around 30 per pixel, and the large number of spectral features resulted in internal accuracies of a few km s-1, although external errors are larger.


3 J star identification
Fig. 1 shows sections of representative spectra of J and N stars in the 6000-6400Å waveband and is a good illustration of the quality of the 2dF spectra. The plots are the reduced spectra after wavelength calibration and sky subtraction but with no intensity or flux calibration (for details see Cannon et al. in preparation), and are scaled to their maxima within the plotted waveband. The principal molecular bands are marked on the figure. It was straightforward to make a visual inspection of the spectra and thereby note as J stars those stars with an obvious band at 6168Å. This inspection also allowed a simple three-fold categorisation of the remaining stars according to whether the strength of the C2 bands was strong, weak or very weak. The first of these groups typifies the common, cool N stars.
One of the difficulties in identifying when it is weak is the proximity of Ca i 6162 and various CN and bands. In order to make a systematic identification of J stars, the spectra were first adjusted to zero radial velocity using the measured radial velocities. In most carbon stars, the spectrum between 6159Å and 6175Å shows a broad absorption feature with a minimum at 6162–6164Å and a secondary minimum at 6158Å; in contrast, the J stars show a single minimum at 6168Å. (In stars where C2 is weak, the individual components are well separated with the Ca i 6162 line being the stronger.) This feature was then compared with two templates, one being a mean of stars already deemed to be normal carbon stars (N stars) and the other a mean of stars deemed to be J stars. These templates were constructed from stars in one field observed with CCD1 and included 115 N stars and 20 J stars. The spectra and templates were all normalized to local continua defined by the fluxes near 6156Å and 6175Å. By allowing the templates to be shifted in wavelength to allow for pixellation differences and then scaled in strength, the best fit of each template to each star was taken to be the minimum rms of the pixel-to-pixel difference between the stellar spectrum and the template ( or ). Fig. 2 shows an example of these fits for a typical J star (KDM 2348) and a typical N star (KDM 2109). The normalising continua are indicated by dashed lines.
J stars also show the (4, 0) band at 6260Å as well as the (4, 0) band at 6206Å. A procedure similar to the above was applied to this (much larger) waveband by fitting templates of the two types in the 6205-6290Å waveband. This was done twice for each template, first by maintaining the shape of the template throughout the band and secondly by allowing the scaling factor to be different in the two halves 6205-6250Å and 6255-6290Å. The splitting of the band was necessary to account for J stars with different relative strengths of these two isotopic bands. There is, of course, no benefit to be gained from splitting the waveband for a fit to the N stars. This procedure allowed the estimation of two further values: against . Fig. 3 shows the ratio / plotted against / on logarithmic scales. High positive numbers indicate a far better match of the star to the J template whereas high negative numbers are found when the star is better matched with the N-star template. The stars fall into two groups broadly following their initial classification, showing a good separation between N and J stars. It is clear that using two measures gives a better isolation of the J stars than can be achieved with just one axis (or spectral feature). It should also be noted that the C2-weak stars lie to the right-hand edge of the main body of non-J stars showing that they can be distinguished from the typical cool N stars through the shape of the CN bands in the 6200-6300Å wavelength range. The dominant cause of the overlap between the two types is the simplistic nature of the initial classification. The few stars which are seen in the border area between the J stars and the rest were checked individually and classified accordingly. The presence of stars in that area is mainly due to greater noise in their spectra. The set of open circles represents the sample of J stars used in this paper.
A set of stars associated with the main body of stars in Fig. 3 was chosen to represent non-J stars for use as a comparison with the J stars.

4 J-Type Spectral Groups
A pseudo-continuum was defined as two linear segments between maxima at 5722Å, 6202Å and 6620Å. These are points where C2 and CN band absorption is weakest. Ideally, a point at 6750Å would be used (see Westerlund et al. [Westerlund et al. 1991]) but the 2dF spectra do not extend this far into the red. For some stars, the maximum at 6180Å was greater than the one at 6202Å, so the pseudo-continuum was defined by that point instead. Minima associated with the principal lines and bands were then measured, as were maxima each side of these minima. Band strengths were calculated with respect to the pseudo-continuum and also to a local continuum defined by the nearby maxima. All this was done after applying a slight smoothing to the spectra using a 3-pixel box which is equivalent to the instrumental resolution.
Three important maxima lie immediately to the red of the heads of the (0, 2) and (1, 3) bands and the (0, 2) band, at 6202Å, 6134Å and 6180Å respectively. These are marked by arrows on Fig. 1. Fig. 4 shows the relationship between two spectral slopes relating these maxima, and , after normalizing to a flat pseudo-continuum. This normalisation is particularly useful here in order to remove instrumental effects in the 2dF spectra, due to errors in the CCD flat fielding and calibration procedures, and to chromatic effects inherent in the 2dF optics (see Lewis et al. [Lewis et al. 2002] for details). However, the corrections were relatively small here since the carbon star spectra are in the red spectral region and cover only a limited wavelength range.
It transpires that spectra within areas of this plot appear broadly similar and six broad groupings can be distinguished. These are identified by different symbols in Fig. 4 amd some subsequent plots. Typical examples of each group are shown in Fig. 5. These arbitrarily defined groups are maintained to aid the following discussion. Fig. 4 also shows the set of N-type comparison stars. These lie below the J stars in the plot, though there is some overlap, particularly towards the lower left-hand corner.

It is easy to see the key features of these groups by inspecting the spectra in Fig. 5. (These are unsmoothed spectra.) The 6134Å peak is stronger than the 6202Å peak in Group 1, these two peaks are at about the same level in Groups 2–3, whilst in Groups 4–6 the 6134Å peak is below the other. Spectral distinction within Groups 2–3 and Groups 4–6 is made by the level of the flux at the peak at 6180Å relative to the 6134Å and 6202 Å peaks. The best examples of these groups in the Galactic J-star spectra plotted by Barnbaum et al. [Barnbaum et al. 1996] are Group 1 – WX Cyg [J6 (C3- J4)] (though WX Cyg is peculiar in some respects), Group 2 – HO Cas [J4.5 (C5 J5-)], and Group 6 – T Lyr [J4:p (C5 J3.5)]. The terms in the square brackets are the MK classifications based on the revised sheme of Keenan [Keenan 1993] as quoted by Barnbaum et al. [Barnbaum et al. 1996]. There are no representatives of Groups 3–5.
5 Photometry
Near-Infrared (NIR) photometry of sources in much of the LMC is available through the Second Incremental Data Release of the Two Micron All Sky Survey – 2-MASS [Skrutskie et al. 1997] which is accessible on-line at http://irsa.ipac.caltech.edu. 2-MASS measurements were extracted for most of the carbon stars by matching catalogue coordinates. Only two J stars had ambiguous identifications in the 2-MASS database. The colour is related to the effective temperature – (Bessell et al. [Bessell et al. 1983], Bergeat, Knapik & Rutily [Bergeat et al. 2001]).
photometry is also available from the Deep Near-Infrared Survey of the southern sky – DENIS [Cioni et al. 2000] which is available on-line from the CDS at Strasbourg (http://cdsweb.u-strasbg.fr/denis.html). The and data were extracted for the J stars and used for those stars with no 2-MASS measurements. These magnitudes were made fainter by 0.15 mag and 0.17 mag respectively to bring them into alignment with the 2-MASS data. These corrections were calculated from the differences seen for the sample of J stars measured in both surveys. There was no magnitude dependence and the rms values were 0.13 mag and 0.10 mag.
photometry of the LMC stars is available from KDMK01. It was derived from measurements of direct UKST plates made with the SuperCOSMOS measuring machine; see KDMK01 for details. The photometry in general suffers more from the blending of the carbon star images with close line-of-sight companions than the infrared photometry because the neighbouring stars are usually bluer than the carbon stars. Nevertheless, the extraction software used to obtain the photometry copes with blended images in all but the severest situations. Also, a few stars suffer from contamination of due to H emission from background nebulosity.


An infrared , colour-magnitude diagram is shown in Fig. 6, again with the spectral groups as defined in Fig. 4 indicated. Superimposed are lines representing the sequence of LMC N stars (including the C2-weak stars). This sequence was obtained from the photometry of the N stars in the 2dF sample by contructing histograms in for each 0.1 mag interval in . The solid line is the mean and the dotted lines show the extents of the region containing 80 per cent of the stars in each bin. A full description of the work on the N stars will be presented elsewhere. What is clear is that most of the J stars form a sequence which lies about 0.6 mag fainter than the N-star sequence. This is certainly so for stars redder than = 1.2, but caution must be applied to this statement for the bluer stars which are much fewer in number. There are also some exceptions which are much brighter. These are almost all Group 1 stars; in fact, all but one of the Group 1 stars lie to the bright side of the mean N-star sequence. The sequence of faint blue stars is almost all from Group 2 and the reddest stars are predominantly from Group 6. Thus, there is a clear link between optical spectral characteristics on the one hand and temperature and/or luminosity (as determined from the NIR photometry) on the other.
The displacement of the J stars from the bulk of the N stars in Fig. 6 has been interpreted here as a change in luminosity, although the effect could also be due at least in part to changes in the spectra, caused by molecular bands in the near-IR. Only infrared spectroscopy can settle this but the luminosity interpretation is favoured since the shifts in colour would be very large for many stars, and because a similar effect is seen in the – CMD (see Fig. 7 below), where the loci are almost horizontal.
The possible existence of two groups of J stars with different luminosities arising from stars of different initial mass and perhaps following different evolutionary mechanisms has already been suggested (Lorenz-Martins [Lorenz-Martins 1996], Abia & Isern [Abia & Isern 2000]). The photometric separation of Group 1 stars from the rest lends support to this idea.
It will be useful in Section 6 to consider the dependence of various spectral parameters on the near-infrared photometry. Normal J stars will be taken to be those located in the broad band of stars centred on a sequence roughly parallel to but fainter than that of the N stars. Bright J stars are taken to be those more than 0.6 mag brighter in than this sequence. Three colour ranges will prove to be useful: , and .
Some of the carbon stars are likely to be variable, so the photometry has this additional uncertainty. However, with both infrared and visual observations having been almost always taken over short periods of time (see KDMK01 for details of the latter), stellar variations with typical periods of the order of several hundred days will not introduce large errors into either the or colours.
Fig. 7 is is the – colour-magnitude diagram with the N-star sequence shown. There is less spread in colour or magnitude than in Fig. 6, partly because the spectroscopy was carried out in the -waveband and introduces some bias. Nevertheless, the J stars are typically fainter than the N stars in as they were in and the Group 1 stars are generally brighter than others.
Fig. 8 is the equivalent near-infrared two-colour diagram. The slope of the J-star sequence is clearly steeper than that of the N-star sequence. i.e., the reddest J stars have more flux in than N stars of the same temperature ( colour) and the opposite is true for the bluest J stars. The Group 1 stars which are noteworthy in Fig. 6 as being bright do not distinguish themselves from the J-star sequences in this two-colour diagram.
The effect of interstellar extinction is minimal. The relevant extinction and colour excess per unit E() in the LMC estimated from OB stars [Morgan & Nandy 1982] are AK = 0.3, AI = 1.5, E() = 0.7 and E() = 0.75. Reddening measures, including foreground reddening, are typically E() = 0.1 [Westerlund 1997] so such levels would have little effect on Fig. 6. Larger extinction can be found in some associations, but this would not affect many of the carbon stars. Hence, there is no obvious group of reddened stars in either Fig. 6 or Fig. 7 (i.e. stars displaced to the right and slightly downwards).
Although the J and N stars follow different sequences in all these diagrams, the breadths of the sequences are too great to allow any photometric method of distinguishing between J and N stars.
6 Spectral Analysis
There are three main parameters in the classification of J stars [Keenan 1993]: temperature, c-index (carbon index) and j-index (isotopic index). The first is derived from atomic lines seen in the blue and cannot be directly applied to the bulk of the 2dF data. Moreover, it is particularly difficult for faint carbon stars because the emitted flux in the blue is very weak. However, the infrared colour can be used as a temperature indicator (Bessell et al. [Bessell et al. 1983], Bergeat et al. [Bergeat et al. 2001]). The c-index depends on the strong (0, 0) and (0, 1) Swan bands at 5165Å and 5635Å. The first of these is out of the 2dF spectral coverage and the second is difficult to determine because the flux on the blue side is weak and lies close to the edge of the detector. (Also, the Jan 1998 data do not include this band.) Nevertheless, there are many other C2 features that can be used for this purpose. The j-index is easier to determine because it is based on several bands which all lie within the wavelength range covered by the 2dF spectra. These indices and the other spectral features described in this section of the paper were measured from the spectra after being smoothed with a 3-pixel box, matching the resolution of the instrument.
6.1 j-index
A J star was for many years defined as one for which the strength of the band was at least half that of the band [Gordon 1968]. The definition in the revised classification scheme for carbon stars [Keenan 1993] is slightly different in that there the j-index is based on the ratios of the bands to , to and to .
The main difficulty in determining the j-index of a carbon star, and indeed other spectral parameters, is that defining the continuum is not straightforward. The local continuum and pseudo-continuum are greatly different in Group 6 stars for instance, as can be seen in Fig. 5. Clearly, the huge depression of the local continuum is not due to , so the local continuum is more appropriate for defining the j-index. Two measures are used in this paper to define the j-index. The first is the ratio of the (0, 2) bands and measured from the local continuum to the minimum (single pixel) of the band. The ratio of the equivalent widths (Wλ) of the (4, 0) and bands provides the second measure. W6260 and W6206 were determined from the template fitting procedure described in Section 3, using the mean J-star template. Fig. 9 shows the ratio of C2 band depths D6168 / D6192 plotted against the ratio W6260 / W6206. The two ratios are well correlated, in fact better than similar ratios based on other continuum levels. So a j-index was defined as the distance along the sequence as marked in the figure. It was chosen to be similar to the MK index [Keenan 1993] which runs from 3.5 to 7 in a J star [Barnbaum et al. 1996]. The stars with the lowest j-indices have bands slightly stronger than 0.5 times their bands as is expected from the older definition of the J star [Gordon 1968]. There is a slight divergence at high j-index levels between Group 1 and Group 5 stars which is probably due to difficulties in defining the continuum levels for such different types of spectrum.

Fig. 10 is Fig. 4 redrawn with symbols representing the j-index as determined from Fig. 9. It is clear that these spectral parameters are controlled by the j-index, with zones of constant j-index roughly given by sectors defined by straight lines through a point near the lower left-hand corner of the plot, with the j-index increasing in the anti-clockwise direction. As is to be expected, observational errors and probably real fluctuations in these parameters give rise to the considerable overlap between the different symbols. No discrimination is possible in the lower left-hand corner where the Group 1 stars are found.

6.2 c-index

The carbon strength can be treated in a similar way. For J stars, carbon needs to be measured from both isotopic bands rather than just one when the results would clearly be modified by the j-index. Thus, one measure of carbon strength is the sum of the (0, 2) and bands. Another is the complete absorption between 5722Å and 6202Å, whatever its precise cause. The equivalent width of this (W5722-6202) was measured relative to the pseudo-continuum. Fig. 11 shows the relationship between these two measures. The correlation is obvious and there is no lateral dependence on j-index. Hence, a c-index was set as the position along this sequence as indicated in the figure.
It transpires that the spectral groups are dependent on both the c-index and the j-index as can be seen in Fig. 12 which is Fig. 4 redrawn this time with symbols showing the c-index. In this case, the c-index increases clockwise in sectors of a circle centred near the point (1.4, 1.0). By comparing Figs 10 and 12 it is clear that the two spectral slopes () give a two-dimensional classification that can be related to the j- and c-indices and are more easily measured than the latter.

Fig. 13 shows the c-index plotted against (temperature). The trend is as expected; the cooler stars have the higher c-indices. It should be noted that the index here is purely a measure of the observed carbon strength and not a measure of that strength relative to a standard of the same temperature. There is considerable spread, but that is significantly reduced when the bright J stars are excluded. There is a distinct tendency for the brighter J stars to have weaker carbon bands (smaller c-indices) than the fainter (normal) J stars of the same colours.

6.3 C2 bands

Fig. 14 shows the expected correlation between the depths of the (1, 3) and (0, 2) bands at 6122Å and 6192Å respectively. The symbols mark the colour. It is clear that the relationship between D6122 and D6192 is different for each colour range in that it appears progressively to the right as colour increases (i.e. temperature decreases). This would give rise to a correlation between the ratio of the band depths, D6122 / D6192, and in the sense that the (1, 3) band is stronger with respect to the (0, 2) band for the bluer (hotter) stars. This ratio changes from 0.9 at to 0.6 at with a spread of . It is tempting to think that this is indeed the effect of temperature increasing the strength of the higher energy band. However, it is more likely that it is caused by the continual change in shape of the local continuum which occurs as the large absorption trough between 5720Å and 6200Å increases with overall carbon strength, which in turn changes with the temperature.
The strong (0, 1) band is only available for those stars observed during the November 1998 run and so is of limited use for this work. However, it was measured as an equivalent width between the spectral peak at 5590Å and the top of the band head near 5650Å using the latter point as the continuum level. There is a clear correlation between this band and both parameters used above to determine the c-index.

When the 13C abundance is very high, the (0, 2) 13C13C 6144 bandhead is often seen alongside the other (0, 2) bandheads at 6168Å and 6192Å. Fig. 15 shows that this band strengthens as the j-index increases, as is to be expected. However, there can also be minima in this region due to the various components of the (9, 4) band and, for border-line J stars, the Ba ii 6141 line. The J star spectra were inspected by eye and assigned a code according to whether was strong, moderate or undetectable. As expected, those stars with identified by eye are all in the upper-right part of the diagram and shown as open or filled squares. However, they are accompanied by a significant number of stars for which no feature had been identified by eye. Stars in the last category are shown as a plus sign in Fig. 15. Some shown as crosses have measured features displaced slightly redwards of the expected position of the band and are clearly due to another cause. Nevertheless, there remains a correlation in the figure for the plus signs. Inspection of the spectra for stars with moderately high j-indices and where no obvious band is visible shows that the band would be located near the centre of a broad depression of the spectrum between peaks near 6130Å and 6160Å (see the high resolution spectrum of Y CVn plotted by Barnbaum [Barnbaum 1994]). From Fig. 15 it would seem that this depression is due to , and the absence of an obvious band within it for so many stars would suggest that the ordinate is measuring a combined feature.
6.4 CN bands

Fig. 16 shows the ratio of the depths of the and bands plotted against the band depth with symbols identifying the bright and faint J stars. Most of the normal J stars lie along a broad sequence which shows a slight decrease in the strength of relative to as increases. A similar sequence is seen for the comparison N stars. More obvious is the observation that the bright J stars consistently have stronger bands than the fainter (more common) stars with the same band depth. This is in line with the statements by Keenan [Keenan 1993] that the CN bands show a positive luminosity effect. However, it may not be simply the effect of surface gravity but may be associated with the chemical evolution of these bright J stars.
Part of the explanation of the varying ratio might lie in the effect of the (9, 4) band. Its R1 and Q1 bandheads lie at 6197Å and 6202Å, coinciding with the maximum between the and bands. So, increasing the j-index reduces the local maximum which will cause a greater reduction of the weaker band - the CN band, thus reducing the ratio . On the other hand, the band has more effect redwards of this point than towards the blue [Marenin & Greene 1972]. However, the (9, 4) band is relatively weak and probably not the cause of what is seen.
6.5 Na D Lines
The Na D lines have been used as a temperature index in the past, but this is no longer considered reliable mainly because they fall in the middle of the broad absorption region between 5720Å and 6200Å which can significantly affect their appearance. Nevertheless, they could still provide useful information about the stars. One problem with fibre spectroscopy is the difficulty of sky subtraction for strong sky lines such as the Na D lines. However, the radial velocity of the LMC has the effect of shifting the Na D lines arising from the LMC so that the D2 line is blended with the D1 line from the sky and the D1 line is clear of both Na D sky lines.
The Na i 5896 line was measured in all the spectra by first fitting a polynomial to the region around 5900Å and secondly by fitting a gaussian profile to all features that diverged from that continuum. Any feature (line) found, after correcting for the LMC radial velocity, within 1.5Å of 5895.5Å was taken to be Na i 5896. The equivalent width of Na i 5896 – W5896 – was taken to be the equivalent width of the gaussian fit less any contribution from Na i 5890 in cases when the two lines did overlap.
Measurements of W5896 range from 0.0Å to 1.6Å with a mean and rms of 0.7 0.4 Å. There is one J star – KDM 2832 – with a stronger Na D line of W5896 = 2.4Å. This star also shows the strongest Li i 6708 line in the sample (see Morgan et al., in preparation), and in that sense at least is similar to the cool J star WX Cyg [Barnbaum et al. 1996]. The sample of comparison N stars have slightly stronger Na D lines with a mean and rms of 1.2 0.6 Å.
W5896 does not appear to depend strongly on (), j-index, c-index or spectral group. Perhaps the bluest stars have slightly weaker Na D lines but the effect, if real, is small. This is shown in Fig. 17 for (). W5896 is often set to zero when it is too small to be measured; so the gap seen in Fig. 17 at W0.2Å is not necessarily real. The evidence certainly does not support the idea that the Na D lines could be a good temperature indicator for LMC J stars.

It is interesting to compare W5896 for LMC and Galactic stars. The latter were measured using iraf from the spectra of stars presented by Barnbaum et al. [Barnbaum et al. 1996]. For the N stars, only one (the hottest) has WÅ. The Galactic J stars have W5896 mostly in the range Å which is indicated in Fig. 17. These levels are generally weaker than in Galactic N stars as was noted above for the LMC stars. The levels of W5896 for the Galactic J stars are close to or greater than the upper limits seen in the LMC J stars. W5896 in some of the the Galactic R stars is weaker again, the weakest being 0.9Å. Over half the values for the LMC stars of any type are smaller than this. Thus, W5896 is significantly weaker in the LMC than in the Galaxy. This is a consequence of the lower metallicity in the LMC, for Westerlund et al. [Westerlund et al. 1995] have already shown that the Na D lines are very much weaker in the metal-poor SMC than in the metal-rich Galactic Bulge. None of the LMC J stars has a Na D line strong enough to warrant the specification of the NaD-index [Barnbaum et al. 1996] in its classification.
6.6 Blue spectral data

The blue data from the 2002 service observations provided additional spectra of 300 stars in the wavelength range 4190–5290Å. These could, in principle, provide an alternative estimate of the j-index. Fig. 18 shows the ratio of the depths of the (1, 0) and bands plotted against the j-index with symbols indicating the c-index. The depths were measured from a continuum set near 4780Å. Each group of carbon stars plotted shows a trend of increasing (as measured by the ratio D4752/D4744) with j-index, but the ratio is systematically smaller for the C-weak stars. Thus, there is a discrepancy between the strengths measured from the blue bands and from the red bands (the j-index of this paper). This discrepancy arises because the strong blue bands, both normal and isotopic, are often heavily saturated and therefore less sensitive to the ratio, as was noted by Barnbaum et al. [Barnbaum et al. 1996] in relation to the band. This is far less of a problem for the weaker red bands. The features of the plot are consistent with this interpretation.
6.7 Repeatability
Seventeen stars were observed more than once. The mean differences between the indices obtained from pairs of spectra of the same star are 0.17 0.14 for the j-index and 0.28 0.21 for the c-index. These differences are 10 per cent of the overall spread of the indices which is 3.5. The errors are greater for the c-index because it is based on absolute line strengths and therefore more directly affected by the zero point errors that can arise in fibre-optic instruments. The j-index is based on line ratios. The spectral group classifications were the same in 14 of the 17 stars; two of the three different classifications were for stars found very close to the group boundaries.
6.8 Tabulated results
A list of the J stars is given in Table 2. Stars observed more than once have a single entry based on the better quality spectrum. Column 1 is the name of the star in the KDMK01. Columns 2 and 3 give the the photometry taken from KDMK01 and Columns 4–6 give either the photometry resulting from the cross-identification with the 2-MASS Survey or the photometry from the DENIS Survey, adjusted as described in Section 5. Column 7 is the spectral group number, Columns 8 and 9 are the c-index and j-index respectively, and Column 10 (labelled ) is a code noting the strength of the band (2 – strong, 1 – moderate, 0 – undetected) as plotted in Fig. 15. Finally, Column 12 marks some stars of special note: those with a ‘’ and ‘’ identify stars with weaker spectra – i.e., with counts at the 6200Å peak less than 600 and 300 respectively; and the ‘*’ identifies stars with a cross-indentification given in the footnotes: CRW – Crabtree, Richer & Westerlund [Crabtree et al. 1976], HC – Hartwick & Cowley [Hartwick & Cowley 1988] and Cowley & Hartwick [Cowley & Hartwick 1991], WORC – Westerlund et al. [Westerlund et al. 1978]. A photometric entry of ‘0.00’ indicates that no measurement was available. ‘ = 0.00’ identifies DENIS photometry.

7 Individual stars
Three of the LMC J stars have already been described in the literature; their 2dF spectra are plotted in Fig. 19 for comparison purposes. Fig. 19 also shows the 2dF spectra of two other extreme J stars.
KDM 3124 This is also WORC 131 and its spectrum has been published as Star 4-9 by Crabtree et al. [Crabtree et al. 1976]. It is said to ‘exhibit the most extreme J-star characteristics of any star known to the authors’. The 2dF spectrum has much higher resolution and S/N; points to note are: the extreme strength of the (4, 0) band, the very strong (0, 2) band, and the (0, 1) band located as a minor feature on the ‘side’ of the (0, 1) bandhead. Crabtree et al. [Crabtree et al. 1976] quote a class J4 (C4, J5+) and Richer et al. [Richer et al. 1979] quote J4 (C5, J5+); the present work has KDM 3124 as a Group 5 star – J (C5.3, J5.6). No star in the 2dF sample has the band stronger than KDM 3124, but a number of stars achieve j-indices that are just as high.
KDM 1814 This star is Star 6-6 [Crabtree et al. 1976] quoted as class J4 (C4, J4+). The present work has KDM 1814 as a Group 1 star J (C3.6, J4.8), i.e., a star with weak carbon. The difference could lie in the statement by Crabtree et al. [Crabtree et al. 1976] that the (0, 0) and (0, 1) bands are moderately strong, but the (0, 2) band and others in the = +2 series are weak. The star is also WORC 78 and its classification by Richer et al. [Richer et al. 1979] is the same as that by Crabtree et al. [Crabtree et al. 1976]. It is also HC 185 in the list of suspected LMC CH stars [Hartwick & Cowley 1988]. There is no evidence of significant photometric variation as seen in the infrared photometry from 2-MASS, DENIS and Feast & Whitelock [Feast & Whitelock 1992], and the photometry from DENIS and KDMK01.
KDM 2518 According to Richer et al. [Richer et al. 1979], this star which is WORC 106 is J4 (C4, J4). The present work has J (C4.2, J4.9) for a Group 1 star. KDM 2518 is also HC 160. As for KDM 1814, there is no evidence of significant photometric variation.
KDM 2419 Like KDM 3124, this star is an extreme j-star with a j-index of 6.5 and a c-index of 4.6. However, it belongs to spectral Group 1 rather than Group 5 as KDM 3124 described above. The most striking feature is the very large change in continuum gradient around the peak near 6180Å.
KDM 2832 This star has the strongest Na D lines in the 2dF sample, and, as noted in Section 6.5, also has the strongest Li i 6708 line. KDM 2832 has a j-index of 5.6 and a c-index of 4.2, and, like the three stars plotted immediately above it in Fig. 19, is a Group 1 star.
8 Discussion
8.1 Comparison with MK indices
The same analysis as used here for the LMC J stars can be carried out in a limited way on the eight J star spectra published by Barnbaum et al. [Barnbaum et al. 1996] and available from the CDS. Indices were adopted for these stars by comparing measured band ratios with those obtained for the LMC stars; in the case of the c-index, W5722-6202, W5565-5645 and D6192+D6168, and for the j-index, W6260/W6206, D6168/D6192, and D6168/D6122. The W6260/W6206 ratio was measured directly from the spectra rather than using the template fitting procedure. Table 1 provides a comparison of the indices measured here for these eight stars and the published MK indices. Some spectral group types are borderline.
| Star | MK class | Present class | Spectral group |
| HD10636 | J4(C5.5, J5.5) | J(C4.9, J4.9) | 2 |
| EU And | J5-(C5, J3.5) | J(C4.5, J4.6) | 1 (or 2) |
| T Lyr | J4(C5, J3.5) | J(C5.6, J4.6) | 6 |
| NQ Cas | J4.5(C5, J4) | J(C4.6, J4.2) | 2 |
| HO Cas | J4.5(C5, J5-) | J(C4.5, J4.7) | 2 |
| HD19557 | J4(C5.5, J5.5) | J(C4.9, J4.9) | 2 (or 5) |
| VX And | J4.5(C5, J5) | J(C5.6, J3.9) | 6 |
| WX Cyg | J6(C3-, J4) | J(C3.7, J5.9) | 1 |
It is clear from Table 1 that there is no obvious correlation between j-indices measured here and the published values. The c-indices do show some similarities in that a low value was found in both cases for WX Cyg (the unusually strong Na D absorption was excluded from W5722-6202). However, no such relationship exists for the other stars, though it should be remembered that the range in c-index covered by the sample is not large. It was therefore impossible to make a transformation between the two sets of indices. The reasons for the differences in classification can be seen by inspection of the published spectra. For example, EU And and T Lyr are both classified as (C5, J3.5) but have grossly different spectra. Some differences could be introduced by the fact that the MK c-indices were based on slightly different bands, but T Lyr certainly shows a strong band at 6260Å, not a weak one as predicted by the J3.5 classifier.
8.2 Indices

Fig. 20 shows the distribution of J stars according to c-index and j-index. The upper panel is for the normal J stars and the lower panel is for the bright J stars. In each case the symbols mark ranges in . For the normal (fainter) J stars, the reddest stars represented by the filled squares all have strong carbon bands and cover the full range of j-index. The bluer stars (open square then cross) have progressively weaker carbon bands and fewer representatives with a high j-index. The bright J stars generally have higher j-indices and weaker c-indices than normal J stars with the same colour.
8.3 Statistics
The number of stars observed with 2dF (excluding repeats) that gave spectra good enough to be given the first-pass classification was 1497. 156 of these are J stars which is ten per cent of the total. This is somewhat less than the fraction of 15 per cent [Abia & Isern 2000] seen in the Galaxy. However, this difference cannot be deemed to be significant until a full comparison of the selection effects is made. The set of J stars are divided into their six spectral groups in the following percentages: 12, 26, 2, 38, 11 and 11. The bright J stars make up 13 per cent of the total. Just over two thirds of the bright J stars belong to Group 1 and vice versa.
8.4 Location within LMC
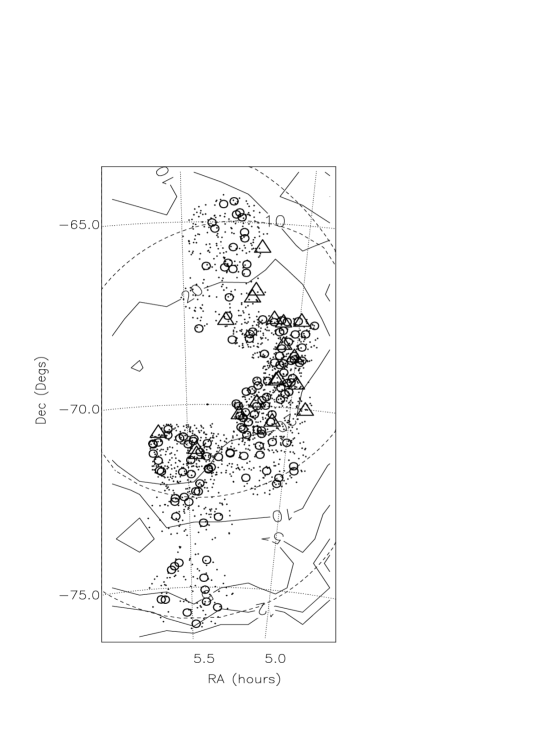
Fig. 21 shows all the carbon stars observed with 2dF plotted according to their position in the LMC, with the J stars identified and the Group 1 stars specially marked. Superimposed are the numbered surface density contours of the carbon stars in KDMK01. The surface density units are the numbers of carbon stars per arcmin2 box. Note that the catalogue is known to be incomplete in the very crowded region of the Bar. The cluster systems of the LMC appear to be found in a low density elliptical system offset to the east of the centre of the Bar and a more centrally located higher density region [Kontizas et al. 1990]; so too are the planetary nebulae [Morgan 1994]. Fig. 21 also shows two ellipses identifying these zones as determined from the clusters. It is within the inner system that all the young, metal-rich clusters are found (Kontizas, Kontizas & Michalitsianos [Kontizas et al. 1993], Kontizas et al. [Kontizas et al. 2001a]). It is clear that Group 1 stars are concentrated on the Bar and are absent from the southern part of the Cloud, and possibly from the NE part as well. No other spectral group shows this kind of behaviour. All but two of the nineteen Group 1 J stars are found in the central part of the LMC as defined by the contour labelled ‘20’ and comprise 17 per cent of the total number of J stars found there. If the population mix were uniform throughout the LMC, then the probability of obtaining this result is 0.01 whether considering the detection of no Group 1 stars beyond the ‘10’-contour or two beyond the ‘20’-contour. The location of one Group 1 star in the north suggests that Group 1 stars might be associated with the inner elliptical system rather than the Bar itself.
Similar exercises can be carried out with the other parameters. It turns out that none of the bright J stars are located in the south of the LMC (Dec ). The c-index, when plotted against Dec, also shows some variation with position in that the stars with a low c-index are also concentrated towards the central regions. These two considerations produce essentially the same result as noted in the paragraph above because 70 per cent of the bright stars are Group 1 stars and the bright stars generally have low levels of the c-index. No conclusions can be drawn for the bright stars or those with low c-index if the Group 1 stars are omitted because there are too few. There is no such result for the j-indices because the most common stars - the red end of the J-star sequence - are spread across all declinations and exhibit the full range of j-index (see Fig. 20).
8.5 CH stars
Hartwick & Cowley [Hartwick & Cowley 1988] and Cowley & Hartwick [Cowley & Hartwick 1991] have published lists of candidate CH stars in the LMC. It has been noted that most of these stars lie to the bright and blue side of the N stars in the colour-magnitude diagram [Feast & Whitelock 1992], a point that has led Suntzeff et al. [Suntzeff et al. 1993] to conclude that they are not members of the old stellar population in the LMC analagous to the Galactic Population II CH stars, but relatively young carbon stars. Since the Group 1 J stars have similar photometric characteristics, it is worth considering whether the Group 1 J stars and the Hartwick-Cowley ‘CH stars’ are the same. Although most of the Hartwick-Cowley stars lie in the outer parts of the LMC beyond the limits of the 2dF observations, eight were observed with 2dF: six are J stars (HC 143, HC 153, HC 160, HC 185, HC 192, and HC 198) and two are not (HC 200, HC 206). Two of these J stars belong to Group 1. Also, one (HC 165) has been reported to be a J star by Richer et al. [Richer et al. 1979]. With seven out of nine being J stars, the Hartwick-Cowley stars could easily be a sample of J stars, but not specifically a sample of Group 1 stars. Although isotope ratios in CH stars cover a wide range [Vanture 1992] overlapping that of the J stars, confusion between the two classes exists only at the ‘marginal J’ level [Barnbaum et al. 1996]. The Hartwick-Cowley stars seen by 2dF to be J stars are by no means ‘marginal’. The J stars do have a depression between 4330 and 4380 but the shape is quite different from the P-branch at 4352Å which is characteristic of CH stars (see Barnbaum et al. [Barnbaum et al. 1996]). HC 185 (KDM 1814) is the one star from the Hartwick-Cowley sample that was observed in the blue. Its spectrum between 4250Å and 4450Å matches well with other J stars such as NQ Cas, given that its carbon bands are relatively weak (c-index = 3.5); but there is no evidence of the 4352Å CH P-branch.
Six of the Group 1 stars were included in the sample of stars observed in the blue. These spectra were then examined to see whether they showed evidence of strong CH-bands. One spectrum is too weak to provide a good signal, but four of the others (KDM 2312, KDM 1814, KDM (1802 and KDM 1249) have strong G-bands and the spectral depression between 4350Å and 4380Å which is typical of J stars, but without the bandhead of the P-branch at 4352Å. The sixth Group 1 star (KDM 2832) has a weak G-band and no sign of the P-band. Nor did any show exhanced Ba ii 4554 or Ba ii 4934 as is usually seen in CH stars. These considerations support the conclusion that the Group 1 J stars are not CH stars.
9 Summary
(1) A large sample of 1497 LMC carbon stars has been observed using the 2dF facility on the AAT. Of these, 156 (10 per cent) have been identified as J stars. This is less than the fraction of 15 per cent [Abia & Isern 2000] seen in the Galaxy, but selection effects could be important.
(2) The spectra of the J stars are varied in appearance and have been subdivided into six spectral groups according to the slopes between the maxima at 6134Å, 6180Å and 6202Å.
(3) In the colour magnitude diagram, most of the J stars lie along a sequence parallel to and fainter than the sequence of N stars. Some stars (13 per cent) are brighter than this sequence: these are mostly of spectral Group 1. This is contary to the older notion based on shallower samples that most of the J stars were brighter than the N stars.
(4) A c-index and a j-index was assigned to each star to measure the strength of the C2 bands and the relative strengths of the isotopic bands. The spectral groupings are related to these indices. For the common stars on the J-star photometric sequence, the redder ones have high c-indices and cover the full range of j-index. The bluer stars have lower c-indices and fewer representatives with high j-indices. The bright stars generally have higher j-indices and lower c-indices than their fainter couterparts of the same colour.
(5) The band is strong in most stars with a high j-index, but is not always seen as an unblended feature.
(6) The ratio of the and bands is higher for the bright J stars than for those on the principal J-star sequence.
(7) The Na D lines are weaker in LMC J stars than in Galactic J stars, and, as in the Galaxy, are weaker in the J stars than in the N stars. The weakness of the Na D lines in the LMC is due to the lower metallicity there. The strengths of the Na D lines do not correlate with temperature as measured by ().
(8) Group 1 J stars are absent from the southern parts of the LMC and found in the inner regions where the young, metal-rich clusters are found. Bright J stars and those with low c-index are also concentrated towards the centre of the LMC, but no such effect is seen for the j-index.
(9) The small overlap between the 2dF data and the suspected CH stars of Hartwick and Cowley suggests that the latter include a high percentage of J stars.
Acknowledgements
The authors are grateful to the staff of the Anglo-Australian Observatory for assistance with the observations, to the Australian Time Assignment Committee for the allocation of telescope time, and to the 2-MASS, DENIS, CDS and IPAC project teams for making the infrared photometry available via the WWW.
References
- [Abia & Isern 2000] Abia C., Isern J., 2000, ApJ 538, 438
- [Bailey et al. 2001] Bailey J.A., Glazebrook K., Offer A., Taylor K., 2001, Submitted to MNRAS
- [Barnbaum 1994] Barnbaum C., 1994, ApJS 90, 317
- [Barnbaum et al. 1996] Barnbaum C., Stone R.P.S., Keenan P.C, 1996, ApJS 105, 419
- [Bergeat et al. 2001] Bergeat J., Knapik A., Rutily B., 2001, AA 369, 178
- [Bessell et al. 1983] Bessell M.S., Wood P.R., Lloyd Evans T., 1983, MNRAS 202, 59
- [Blanco & McCarthy 1983] Blanco V.M., McCarthy, M.F., 1983, AJ 88, 1442
- [Cannon et al. 1999] Cannon R.D., Offer A., Hatzidimitriou D., Croke B., Morgan D.H., 1999, in Whitelock P., Cannon R.D., eds, IAU Symposium 192, The Stellar Content of Local Group Galaxies, p480
- [Cioni et al. 2000] Cioni M.-R., Loup C., Habing H.J., et al., 2000, AAS 144, 235
- [Cowley & Hartwick 1991] Cowley A.P., Hartwick F.D.A., 1991 ApJ 373, 80
- [Crabtree et al. 1976] Crabtree D.R., Richer H.B., Westerlund B.E., 1976, ApJ 203, L81
- [Dapergolas et al. 1996] Dapergolas A., Morgan D.H., Kontizas E., Kontizas M., 1996, in Kontizas E. et al., eds, ASS 212, Wide-Field Spectroscopy, p181
- [Feast & Whitelock 1992] Feast M.W., Whitelock P.A., 1992, MNRAS 259, 6
- [Gordon 1968] Gordon C.P., 1968, PASP 80, 597
- [Hartwick & Cowley 1988] Hartwick F.D.A., Cowley A.P., 1988 ApJ 334, 135
- [Hatzidimitriou et al. 2003] Hatzidimitriou D., Morgan D.H., Cannon R.D., Croke B.F.W., 2003, MNRAS, in press
- [Keenan 1993] Keenan P.C, 1993, PASP 105, 905
- [Kontizas et al. 1990] Kontizas E., Morgan D.H., Hatzidimitriou D., Kontizas M., 1990, AAS 84, 527
- [Kontizas et al. 2001a] Kontizas E., Dapergolas A., Kontizas M., Nordstrom B., Andersen J., Prantzos N., Kalcheva N., 2001a, ApSSS 277, 333
- [Kontizas et al. 2001b] Kontizas E., Dapergolas A., Morgan D.H., Kontizas M., 2001b, AA 369, 932 – KDMK01
- [Kontizas et al. 1993] Kontizas M., Kontizas E., Michalitsianos A.G., 1993, AA 269, 107
- [Lambert et al. 1986] Lambert D.L., Gustafsson B., Eriksson K., Hinkle K.H., 1986, ApJS 62, 373
- [Lewis et al. 2002] Lewis I.J, Cannon R.D., Taylor K., Glazebrook K., et al., 2002, MNRAS 333, 279
- [Lloyd Evans 1990] Lloyd Evans T., 1990, MNRAS 243, 336
- [Lorenz-Martins 1996] Lorenz-Martins S., 1996, AA 314, 209
- [Marenin & Greene 1972] Marenin I., Greene A.E., 1972, ApJ 177, 841
- [Morgan 1994] Morgan D.H., 1994, AAS 103, 235
- [Morgan & Nandy 1982] Morgan D.H., Nandy K., 1982, MNRAS 199, 979
- [Richer et al. 1979] Richer H.B., Olander N.O., Westerlund B.E., 1979, ApJ 230, 724
- [Richer 1981] Richer H.B., 1981, ApJ 243, 744
- [Skrutskie et al. 1997] Skrutskie M. F., Schneider S.E., Stiening R., et al., 1997, in ASSL 210, p25
- [Suntzeff et al. 1993] Suntzeff N.B., Phillips M.M., Elias J.H., Cowley A.P., Hartwick F.D.A., Bouchet P., 1993, PASP 105, 350
- [Vanture 1992] Vanture A.D., 1992, AJ 103, 2035
- [Westerlund 1997] Westerlund B.E., 1997, The Magellanic Clouds, Cambridge University Press
- [Westerlund et al. 1978] Westerlund B.E., Olander N.O., Richer H.B., Crabtree D.R., 1978, AAS 31,61
- [Westerlund et al. 1991] Westerlund B.E., Azzopardi M., Breysacher J., Rebeirot E., 1991, AAS 91, 425
- [Westerlund et al. 1995] Westerlund B.E., Azzopardi M., Breysacher J., Rebeirot E., 1995, AA 303, 107
| KDM | R | I | J | H | K | Group | c-index | j-index | Note | ||
|---|---|---|---|---|---|---|---|---|---|---|---|
| 985 | 14.64 | 13.91 | 12.61 | 11.87 | 11.54 | 1 | 3.8 | 4.7 | 0 | ||
| 1008 | 15.27 | 14.17 | 12.66 | 0.00 | 11.14 | 4 | 5.3 | 5.0 | 0 | ||
| 1048 | 15.02 | 14.02 | 12.49 | 11.38 | 10.70 | 4 | 5.5 | 4.5 | 0 | ||
| 1067 | 15.54 | 14.45 | 13.06 | 11.86 | 11.29 | 5 | 5.8 | 5.5 | 1 | ||
| 1156 | 15.36 | 14.02 | 13.58 | 12.81 | 12.46 | 2 | 4.2 | 3.9 | 0 | ||
| 1169 | 14.69 | 13.68 | 12.28 | 11.18 | 10.70 | 2 | 4.8 | 5.8 | 0 | ||
| 1215 | 14.78 | 13.96 | 12.97 | 12.01 | 11.68 | 2 | 5.2 | 5.3 | 0 | ||
| 1232 | 15.44 | 14.36 | 12.76 | 11.40 | 10.80 | 5 | 5.2 | 6.3 | 0 | ||
| 1249 | 14.38 | 13.58 | 11.97 | 11.03 | 10.56 | 1 | 3.8 | 5.4 | 1 | ||
| 1290 | 14.95 | 14.06 | 12.97 | 12.07 | 11.80 | 1 | 3.9 | 4.5 | 0 | ||
| 1327 | 14.70 | 13.79 | 12.16 | 10.99 | 10.51 | 2 | 5.4 | 4.9 | 0 | ||
| 1365 | 15.19 | 14.28 | 13.28 | 12.21 | 11.77 | 2 | 5.1 | 5.2 | 0 | ||
| 1372 | 15.14 | 13.99 | 12.84 | 11.77 | 11.22 | 4 | 5.0 | 5.2 | 0 | ||
| 1378 | 15.32 | 14.07 | 12.97 | 12.01 | 11.61 | 1 | 4.8 | 5.1 | 0 | ||
| 1380 | 16.13 | 15.19 | 14.21 | 13.47 | 13.17 | 2 | 4.1 | 4.2 | 0 | ||
| 1389 | 14.87 | 13.88 | 12.51 | 11.43 | 10.86 | 4 | 5.7 | 4.7 | 0 | ||
| 1393 | 14.89 | 13.86 | 12.58 | 11.31 | 10.74 | 5 | 5.4 | 5.9 | 2 | ||
| 1410 | 15.28 | 13.89 | 12.58 | 11.49 | 10.96 | 4 | 5.8 | 3.9 | 0 | ||
| 1417 | 14.35 | 13.31 | 11.78 | 10.59 | 10.09 | 2 | 5.2 | 5.3 | 1 | ||
| 1450 | 14.76 | 13.89 | 12.83 | 11.56 | 11.02 | 4 | 5.4 | 5.0 | 0 | ||
| 1456 | 15.37 | 14.31 | 12.75 | 11.58 | 10.99 | 4 | 5.8 | 4.3 | 0 | ||
| 1504 | 14.85 | 14.01 | 13.00 | 12.04 | 11.73 | 2 | 5.1 | 5.2 | 0 | ||
| 1510 | 15.37 | 14.19 | 12.76 | 11.67 | 11.25 | 4 | 5.6 | 4.8 | 0 | ||
| 1529 | 15.78 | 14.53 | 13.12 | 11.94 | 11.33 | 4 | 5.4 | 4.6 | 0 | ||
| 1567 | 15.11 | 14.16 | 13.41 | 12.34 | 11.89 | 4 | 5.5 | 4.2 | 0 | ||
| 1608 | 15.02 | 14.30 | 13.54 | 12.73 | 12.46 | 4 | 4.8 | 3.6 | 0 | ||
| 1637 | 15.55 | 14.79 | 13.87 | 13.02 | 12.73 | 2 | 4.0 | 4.1 | 0 | ||
| 1641 | 14.77 | 12.96 | 12.96 | 11.94 | 11.55 | 2 | 5.1 | 4.5 | 0 | ||
| 1653 | 15.65 | 14.76 | 13.64 | 12.90 | 12.60 | 2 | 4.2 | 4.1 | 0 | ||
| 1660 | 15.44 | 14.44 | 12.95 | 11.79 | 11.27 | 2 | 5.2 | 4.8 | 0 | ||
| 1688 | 14.26 | 13.46 | 11.92 | 10.73 | 10.24 | 1 | 4.8 | 5.4 | 0 | * | |
| 1736 | 15.21 | 14.21 | 13.07 | 12.04 | 11.62 | 4 | 5.8 | 3.7 | 0 | ||
| 1737 | 15.14 | 14.14 | 12.63 | 11.59 | 11.20 | 4 | 5.8 | 4.1 | 0 | ||
| 1742 | 14.87 | 14.15 | 13.51 | 12.65 | 12.33 | 2 | 4.7 | 6.0 | 0 | ||
| 1745 | 14.60 | 13.94 | 13.01 | 12.19 | 11.96 | 1 | 3.8 | 6.2 | 1 | ||
| 1751 | 13.72 | 12.47 | 11.31 | 10.27 | 9.73 | 1 | 4.6 | 5.1 | 0 | * | |
| 1762 | 14.98 | 14.13 | 12.66 | 11.66 | 11.21 | 4 | 5.4 | 5.4 | 0 | ||
| 1767 | 15.08 | 14.02 | 12.73 | 11.53 | 10.93 | 4 | 5.8 | 4.0 | 0 | ||
| 1796 | 15.66 | 14.38 | 12.73 | 11.48 | 10.82 | 4 | 5.9 | 5.0 | 0 | ||
| 1802 | 13.95 | 13.36 | 11.94 | 10.93 | 10.62 | 1 | 4.2 | 5.3 | 1 | ||
| 1814 | 13.61 | 13.05 | 11.26 | 10.47 | 10.18 | 1 | 3.5 | 4.7 | 0 | * | |
| 1820 | 15.54 | 14.41 | 13.03 | 11.82 | 11.24 | 6 | 6.1 | 5.1 | 0 | ||
| 1849 | 14.86 | 13.99 | 12.56 | 11.55 | 11.03 | 4 | 5.2 | 4.5 | 0 | ||
| 1864 | 15.08 | 14.27 | 13.21 | 12.40 | 12.14 | 2 | 4.5 | 4.7 | 0 | ||
| 1880 | 15.08 | 14.35 | 12.82 | 11.86 | 11.44 | 4 | 5.4 | 5.2 | 1 | ||
| 1901 | 15.66 | 14.75 | 13.46 | 12.56 | 12.19 | 4 | 4.5 | 4.6 | 0 | ||
| 1988 | 15.31 | 14.12 | 12.71 | 11.52 | 10.99 | 4 | 5.8 | 5.3 | 0 | ||
| 1989 | 15.59 | 14.86 | 14.30 | 13.51 | 13.32 | 1 | 4.1 | 4.1 | 0 | ||
| 2035 | 14.82 | 13.91 | 13.01 | 11.97 | 11.64 | 2 | 5.5 | 5.1 | 0 | ||
| 2039 | 14.85 | 13.89 | 13.16 | 12.04 | 11.57 | 4 | 5.6 | 4.4 | 0 | ||
| 2043 | 14.33 | 13.52 | 12.79 | 11.76 | 11.37 | 2 | 5.3 | 5.4 | 0 | ||
| 2098 | 15.46 | 14.27 | 13.07 | 11.80 | 11.15 | 6 | 5.8 | 4.8 | 0 | ||
| 2099 | 15.33 | 14.25 | 12.68 | 11.57 | 10.99 | 4 | 5.4 | 4.7 | 0 | ||
| 2112 | 15.02 | 14.24 | 13.22 | 12.38 | 11.95 | 2 | 4.7 | 4.8 | 0 | ||
| 2135 | 15.76 | 14.56 | 13.31 | 12.09 | 11.45 | 4 | 5.6 | 5.1 | 0 | ||
| 2155 | 15.19 | 14.18 | 12.61 | 11.44 | 10.83 | 5 | 5.7 | 6.0 | 2 |
J stars in the Large Magellanic Cloud KDM R I J H K Group c-index j-index Note 2184 14.74 13.80 12.50 11.31 10.71 6 6.5 4.8 0 2244 15.18 14.17 13.15 11.95 11.41 6 5.4 5.2 1 2293 15.88 14.63 14.20 13.30 13.07 2 4.4 4.4 0 2310 14.70 13.89 13.16 0.00 11.49 4 5.4 4.6 0 2312 14.69 13.97 13.17 12.31 12.07 1 4.2 6.2 0 2313 14.74 13.78 12.46 11.33 10.89 4 6.1 4.4 0 2348 15.07 13.89 12.61 0.00 11.00 5 5.7 5.5 2 2364 15.44 14.38 13.04 11.85 11.20 5 5.5 5.3 1 2419 14.79 13.74 11.74 0.00 10.21 1 4.6 6.4 2 * 2475 14.98 0.00 12.70 11.57 10.96 4 5.9 4.5 0 2517 15.48 14.18 12.87 11.66 11.07 6 6.0 4.2 0 2518 13.33 12.63 10.93 10.02 9.60 1 4.2 4.9 0 * 2543 14.95 14.17 12.85 11.86 11.45 4 5.3 4.5 0 2561 15.14 14.20 12.88 11.89 11.60 2 4.6 4.9 0 2573 14.84 13.92 12.64 11.65 11.36 2 4.9 5.1 0 * 2614 15.06 14.04 12.32 11.28 10.88 1 4.5 5.3 0 2622 15.03 14.06 12.56 11.45 10.86 5 5.2 5.9 1 2630 15.04 14.18 12.79 11.74 11.39 2 5.0 4.9 0 2635 15.32 14.31 12.69 11.62 11.08 4 5.3 5.0 0 2646 15.65 13.85 13.06 11.91 11.37 4 5.8 4.8 0 2654 15.02 13.88 12.88 11.91 11.39 4 5.7 4.0 0 2696 14.68 13.69 12.29 11.17 10.73 5 5.6 5.1 1 2708 14.72 13.75 12.48 11.26 10.66 4 4.5 5.0 0 2752 15.89 14.79 13.44 0.00 11.83 6 6.2 4.6 0 2803 15.48 14.15 12.70 0.00 0.17 6 6.1 4.4 0 2806 14.78 13.66 11.72 10.53 10.06 5 0.0 0.0 0 2807 15.11 14.10 12.66 11.51 10.96 4 5.4 5.2 0 2832 14.60 13.71 11.76 10.74 10.34 1 4.2 5.6 1 2868 15.86 14.92 14.36 13.63 13.44 2 3.5 4.2 0 2882 15.26 14.08 12.78 11.60 10.92 4 5.4 4.8 0 2897 15.57 14.10 12.18 11.09 10.59 5 5.6 5.6 1 2946 15.19 14.02 12.87 11.75 11.27 3 5.2 4.3 0 2969 15.35 14.17 12.56 11.32 10.64 5 5.8 5.3 1 3036 15.25 14.12 12.92 11.69 11.13 4 5.5 4.9 0 3090 14.87 14.06 12.47 0.00 10.92 5 5.7 5.2 2 3093 14.97 14.25 13.42 0.00 12.39 2 3.9 5.1 0 3124 14.63 13.55 11.72 10.67 10.10 5 5.3 5.6 2 * 3135 15.35 14.18 12.47 0.00 10.66 4 5.2 5.2 0 3161 15.32 14.30 12.67 0.00 11.10 2 5.1 5.3 2 3171 15.65 14.28 12.94 11.57 10.83 6 5.8 4.4 0 3178 15.04 14.03 12.53 11.59 11.25 2 4.8 4.8 0 * 3226 15.18 14.10 12.48 0.00 11.03 2 5.1 5.5 0 3244 14.97 13.78 12.82 0.00 11.44 4 5.4 5.2 1 3263 15.32 14.49 13.70 0.00 12.50 4 5.2 4.1 0 3283 14.94 14.02 12.84 0.00 11.52 1 4.4 4.9 0 3339 15.19 14.17 13.00 0.00 11.54 2 5.1 4.9 0 3362 14.92 13.89 12.54 11.40 10.81 4 5.8 4.6 0 3389 15.17 14.20 12.67 11.69 11.31 3 4.7 4.1 0 3391 14.77 13.81 12.48 11.43 11.03 3 4.9 3.9 0 3425 14.59 13.72 12.46 0.00 11.07 2 5.0 5.8 0 * 3583 15.64 14.56 13.73 12.68 12.19 4 5.8 3.7 0 3643 14.13 13.12 11.69 10.67 10.16 2 5.3 5.0 0 * 3655 15.17 14.09 12.49 11.48 11.03 4 5.8 4.9 2 3726 14.56 13.74 12.45 11.47 11.06 2 4.8 6.6 1 * 3735 15.19 14.33 13.25 12.33 11.90 2 5.0 4.5 0 3762 14.84 13.92 12.73 11.48 10.89 5 6.0 5.7 1
J stars in the Large Magellanic Cloud KDM R I J H K Group c-index j-index Note 3786 14.86 14.05 12.24 11.26 10.76 2 4.4 4.2 0 3787 15.42 14.24 12.72 0.00 11.06 4 5.7 4.6 0 3794 15.30 14.20 12.50 0.00 10.59 5 5.5 5.5 1 3809 15.24 14.36 13.32 12.37 11.97 4 5.2 4.9 0 * 3865 15.19 14.17 13.03 11.81 11.16 6 5.5 4.7 0 3908 15.40 14.38 13.35 12.38 11.97 4 5.5 4.1 0 3909 15.76 14.46 13.03 11.84 11.24 6 5.6 5.0 1 3995 15.42 14.48 12.89 11.79 11.34 4 6.2 3.9 0 3998 15.29 13.93 12.69 11.42 10.65 6 5.6 4.1 0 4022 15.75 14.60 13.23 12.22 11.78 4 5.5 4.8 0 4081 15.44 14.53 13.13 12.24 11.90 2 4.4 4.7 0 4129 14.56 13.75 12.69 11.83 11.54 1 4.0 4.8 0 4141 14.40 13.60 12.06 10.93 10.56 1 4.6 5.4 1 4189 15.40 14.34 13.46 12.60 12.16 4 5.5 3.8 0 4219 14.52 13.65 11.95 10.89 10.40 2 5.3 4.8 0 * 4236 15.42 14.23 12.61 11.40 10.81 5 5.3 5.5 1 4271 15.28 14.47 13.19 12.20 11.77 2 5.4 5.5 0 4328 14.89 13.85 12.65 11.47 10.94 4 5.0 5.2 1 4332 15.24 14.38 13.03 11.89 11.50 4 5.6 4.6 0 4433 14.47 14.46 13.10 11.88 11.36 6 5.7 4.7 0 4453 15.10 14.05 12.68 11.62 11.08 4 5.5 4.2 0 4582 14.86 13.67 12.53 11.22 10.67 6 6.0 4.7 0 4626 15.91 14.34 12.82 11.50 10.84 6 5.6 4.8 1 4653 15.11 13.98 12.60 11.38 10.85 5 5.3 5.8 2 4675 15.01 14.02 12.45 11.32 10.75 5 5.4 5.8 1 4708 15.91 14.34 13.24 11.98 11.35 4 6.2 4.3 0 4944 14.89 14.03 13.19 12.20 11.75 2 5.2 5.5 1 4956 15.21 14.15 12.99 11.81 11.31 6 6.0 5.5 1 4976 15.24 14.41 13.59 12.79 12.46 2 4.1 3.6 0 5094 15.08 14.26 13.34 12.46 12.11 4 5.1 5.1 1 5111 14.91 13.94 12.73 11.57 11.03 4 6.0 4.0 0 5122 15.14 14.23 13.02 11.96 11.56 4 0.0 0.0 0 5246 15.01 13.90 12.19 11.09 10.47 4 5.6 5.3 1 5368 14.87 13.78 12.21 11.07 10.52 4 5.4 4.4 0 5391 13.95 13.00 11.80 10.79 10.43 1 4.2 5.1 1 5405 15.54 14.11 12.25 10.93 10.22 6 6.1 4.9 1 5433 14.99 14.10 12.94 11.98 11.62 2 5.0 5.0 0 5446 15.69 14.55 13.32 12.22 11.65 4 5.9 4.7 0 5544 15.34 14.34 13.31 12.15 11.59 6 6.0 5.0 0 5562 14.94 13.88 12.83 11.89 11.50 2 4.8 5.3 0 5574 15.02 14.02 12.83 11.75 11.24 4 5.4 4.1 0 5585 15.23 14.20 12.64 11.58 11.03 4 5.4 3.8 0 5703 14.97 0.00 12.79 11.78 11.28 4 5.6 5.4 0 6656 15.33 14.48 13.63 12.79 12.41 2 4.0 4.1 0 Notes: and – weaker spectra (see text); * – a cross-identification noted below KDM 1688 WORC 70 KDM 1751 WORC 74 KDM 1814 WORC 78 CRW 6-6 HC 185 KDM 2419 WORC 101 KDM 2518 WORC 106 HC 160 KDM 2573 WORC 109 KDM 3124 WORC 131 CRW 4-9 KDM 3178 HC 153 KDM 3425 HC 143 KDM 3643 WORC 146 KDM 3726 HC 198 KDM 3809 HC 192 KDM 4219 WORC 168