Statistical Test of Optical Fibers for use in PMAS, the Potsdam Multi-Aperture Spectrophotometer
Abstract
Focal ratio degradation measurements of optical fibers for the PMAS integral field instrument have been performed using the Photometric Testbench of the Potsdam Astrophysical Institute (AIP). An effort has been made to obtain sufficiently large statistical samples of individual fiber measurements. The optimization of the measurement process has made it possible to study quantitatively the effects of different coupling methods (air–glass vs. immersion) and of imperfections like defocus, lateral displacement, and angular misalignment. Furthermore, the effects of mechanical stress on focal ratio degradation have been investigated, confirming the presumed cause of modal noise which is known to limit the maximum signal-to-noise one can achieve with fiber-coupled echelle spectrographs.
1 Introduction
Optical fibers provide a versatile tool to conveniently re-arrange light coming from different places into a common spectrograph slit. In astronomical instrumentation, this property is being used successfully for multi-object spectroscopy, for integral field spectroscopy, and other applications. Similar to several new integral field spectrographs, which have been developed recently for visual and NIR wavelengths (INTEGRAL (Arribas et al., 1998), TEIFU (Haynes et al., 1998), GMOS-IFU (Allington-Smith et al., 1998), VIRMOS (Prieto et al., 2000), IMACS-IFU 111currently under development in Durham, CIRPASS (Parry et al., 2000), FLAMES (Pasquini et al., 2000)). PMAS, the Potsdam Multi-Aperture Spectrophotometer (Roth & Laux, 1998; Roth, 1998; Roth et al., 2000; Laux, 1999) was designed as a fiber-coupled instrument, connecting a lens-array to the spectrograph slit by means of a fiber bundle.
A basic requirement of the conceptual design consisted in a sufficiently stable opto-mechanical configuration which would allow for spectrophotometric measurements (Roth et al., 1997). However, based on the observation of “fiber noise” in the FOCES echelle spectrograph (M. Pfeiffer, priv. communication), there had been worries that the use of optical fibers might introduce instabilities, eventually compromising this requirement. Therefore, an optical testbench setup was devised for measuring the far-field light distribution in the output light cone of an optical fiber, illuminated under controlled conditions of focal ratio, angle of incidence, centering, wavelength, and other coupling details. By employing a cryogenic 16-bit CCD camera system, it was attempted to measure the behaviour of the output beam pattern, both for a sufficiently large statistical sample of fibers, as well as for the temporal behaviour of selected fibers under geometrically stable vs. variable conditions. The high dynamic range of the detector would allow to measure small differences between different zones (modal effects), and to determine with high precision the contribution of low surface brightness regions at large output angles (faint wings of the far field pattern), which are difficult to measure with simple video systems.
The far-field light distribution at the fiber output is known to exhibit, in general, a modal structure, and to suffer from Focal Ratio Degradation (FRD), i.e. the enlargement of the output light cone angle with respect to the input beam. Exceeding the focal ratio of the spectrograph collimator is equivalent to light loss and, possibly, increased stray light. Therefore, the FRD behavior of optical fibers is an important design issue for fiber-coupled spectrographs. FRD of a variety of fibers has been studied e.g. by (Avila, 1988), (Craig, Hailey & Brodie, 1988), (Ramsey, 1988), (Clayton, 1989), (Carrasco & Parry, 1994), (Avila, 1998). As a consequence of the results reported in these studies, the PMAS design was chosen (a) to operate with a collimator focal ratio of f/3 (the canonical value for FRD-optimized fiber spectrographs), (b) to avoid a bench-mounted spectrograph which would have required long fibers for any cassegrain-mounted IFU, and (c) to employ a type of optical fiber with already demonstrated useful performance.
Because of the problem of background subtraction, the presence of FRD and its variability over time has rendered fiber-coupled spectrographs sometimes less suitable for faint object spectroscopy than conventional slit spectrographs, although suitable methods for calibration are capable of improving the situation (Gilmore & Wyse, 1992). We suspected that temporal variation of the fiber output far-field light distribution is effecting response calibrations in two ways: throughput variation as the result of different FRD-induced vignetting over time, and a variable point-spread function as the result of redistribution of light within the spectrograph entrance pupil due to modal effects. For IFUs, such variations must be expected to be independent from fiber to fiber, thus introducing calibration errors similar to a limited CCD flatfield accuracy. In practice, quantitative end-to-end measurements of such effects are difficult to perform. It was considered to be reasonable, however, to optimize a fiber configuration for minimal FRD and minimal modal redistribution if one is interested in obtaining the highest possible stability of the whole system.
In order to optimize the performance of the PMAS baseline design fiber and to characterize the instrumental effects arising from fiber properties, the present study was conducted, including the consideration to obtain a reference for a future upgrade with 50 m fibers which are required to accomodate a 3232 element lens array.
2 Experimental setup
2.1 The Photometric Testbench
The Photometric Testbench (Roth, 1998) of the Potsdam Astrophysical Institute (AIP) uses several light sources and filters to create a light bundle with a known passband and central wavelength which passes the FRD setup. For our experiments a continuum white light source was used in combination with neutral density and interference filters (central wavelength 400900 nm in steps of 50 nm, 10 nm FWHM). For most of our measurements a central wavelength of 550 nm was used. Due to the fact that the testbench is operated under remote control from a VME controller under the VxWorks real-time operating system, and that all devices like filter wheels and the CCD detector can be accessed from the command line of a UNIX host computer, it was possible to obtain extended series of measurements automatically without human interaction.
2.2 The FRD setup
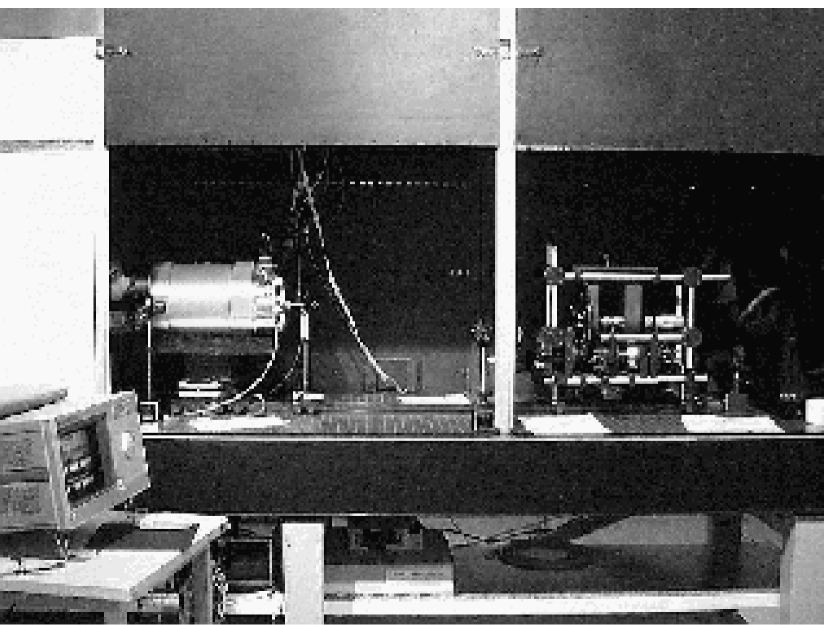
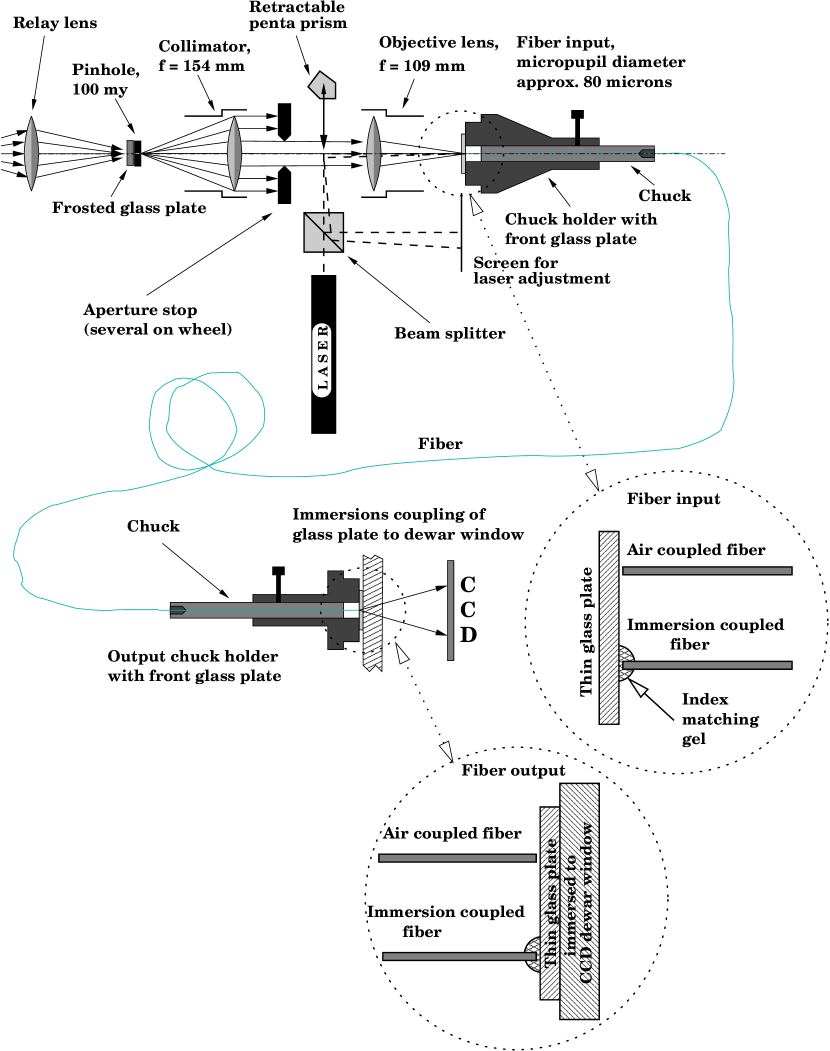
The optical setup which was used for FRD measurements can be considered as part of the Photometric Testbench and was accessible through remote control in the standard way (Fig. 1). As can be seen in Fig. 2, a pinhole behind a frosted glass plate is illuminated by light coming from the testbench, whose intensity and spectral passband is determined by a given selection of filters. The light emerging from the 100 m - pinhole passes through a collimator (f = 154mm, f/1.7). The input focal ratio is determined by a motorized filter wheel with different aperture stops. These stops are circular, producing f-ratios ranging from f/2 to f/12. In addition, a square aperture is available, simulating the square lenslet input as used for PMAS. A second lens (f = 109mm, f/1.5) focusses the light onto the fiber, which is mounted in a holder and can be adjusted in x, y, z, tip and tilt. The fiber itself is mounted inside of a standard Newport fiber chuck. For the majority of measurements the fiber was immersed to a thin glass plate using immersion gel (Cargille type 6307), whose index of refraction n=1.459 is very similar to quartz. The fiber output was prepared in a similar fashion. The fiber was immersed to an output glass plate and the glass in turn to the window of the CCD dewar. While the FRD setup itself is in principal identical to those used by other authors (Ramsey, 1988; Guerin & Felenbok, 1988; Carrasco & Parry, 1994), a major advance was achieved by using a science grade LN2-cooled CCD camera (SITe TK1024, backside illuminated, UV-visual AR-coating). This camera provides high sensitivity and, in particular, a high dynamic range, which is important for the precise measurement of intensities in the faint wings of the illuminated spot at the fiber output, as well as for the detection of modal noise features.
2.3 Measurements and data analysis
Measurement control, data acquisition, reduction and analysis is provided automatically using the IDL 222IDL by Research Systems Inc., Boulder, CO, USA based code PMASFIB which was specifically written for this application. After input of a list of desired focal ratios, wavelengths and light intensity levels the measurement cycle starts. The UNIX-workstation communicates with the CCD camera and the filter/aperture stop wheels through a VME controller. Several user-defined features may be invoked like pauses between exposures (e.g. for testing the long-time stability of fiber setups), different angles of incidence onto the fiber (realized by small offsets of the aperture stop wheel), and other expandable functions. When the data acquisition is finished, the reduction process starts automatically. Each exposure is background subtracted using pixels far away from the maximum spot size as determined by the nominal fiber numerical aperture. A set of concentric circles with increasing radii is defined around the center of gravity. The light within these apertures is integrated and normalized to the total amount of light reaching the CCD. As a result, the fraction of light falling into the aperture corresponding to the focal ratio of a virtual collimator as a function of input focal ratio is determined for each measurement. Also wavelength, angular input and other parameters of interest are recorded for each dataset.
In what follows, the f/3 coupling efficiency is defined as fraction of light reaching a virtual f/3 collimator, normalized to the total amount of light reaching the chip. For PMAS the square lenslet input (f/3.5 along diagonal, f/5 along one side, referred to as f/3.5 5 in the following) was simulated by a square aperture stop of adequate size.
3 Improved Test Procedure
After several first runs of an early version of the setup the advantages of immersion coupling became readily apparent. Preliminary measurements of fibers with cleaved ends were performed in unmatched and index matched versions. The observation was a considerable increase of performance of the matched fibers with respect to fibers without immersion coupling (Schmoll, Popow & Roth, 1998). As an explanation, it was speculated that surface irregularities due to the insufficient cleaving process had been healed out and therefore the apparent FRD was reduced significantly. Also it was observed that the variation from fiber to fiber was significantly reduced. This gave rise to investigate the behaviour on polished fibers as they were used in the final instrument.
After these preliminary tests several measures were undertaken to obtain a better degree of reliability for the results from FRD measurements:
-
•
A laser adjustment ensured normal on-axis incidence of the input beam to the chuck holder front glass plate.
-
•
Centering of the illuminating beam on the fiber input end face was monitored by means of a photo diode, connected to the fiber output.
-
•
The integrity of the coupling surfaces on both fiber ends was checked by observing one end with a microscope while illuminating the other end, and vice versa.
-
•
All fibers were polished and checked for visually flawless end faces.
-
•
A subset of fibers was measured several times using the same procedure, in order to verify the reliability of the process.
-
•
Large samples of fibers were measured.
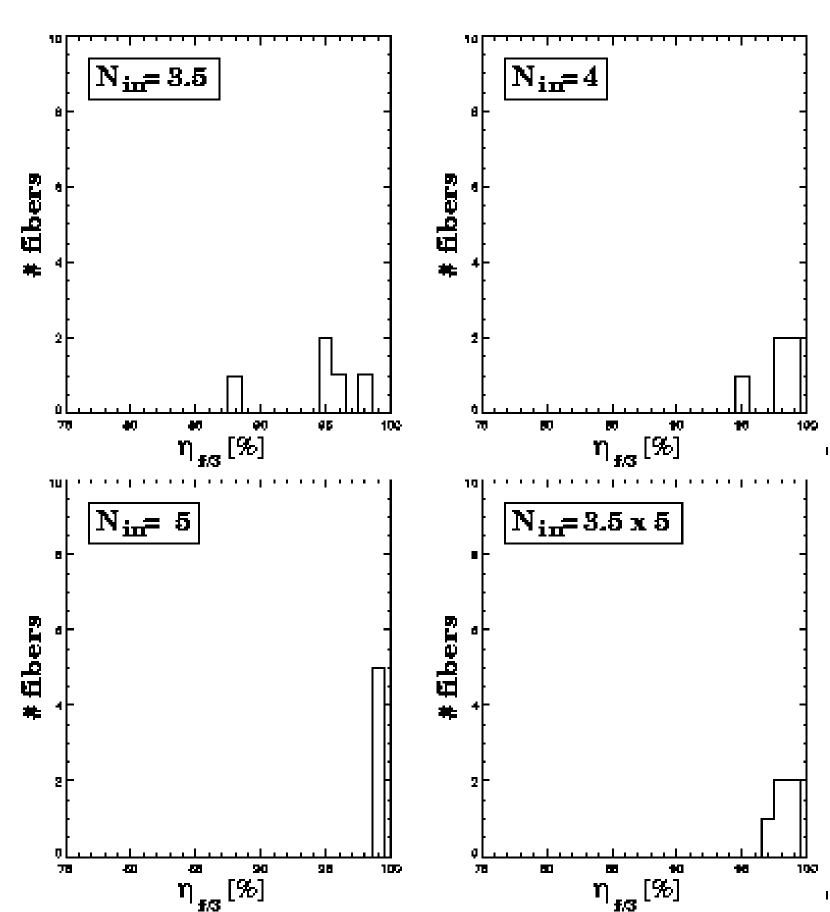
Finally, a sample of 65 fibers (Polymicro FVP100/120/140) was measured using the improved FRD setup. The f/3 frequency of coupling efficiencies is now sharply peaked, especially when slow input focal ratios are used (see Fig. 3). Table 1 shows the mean and median values. In order to quantify the width of these distributions, and are introduced as the the widths of these distributions, including 100 % and 85 % of all values around the median, respectively.
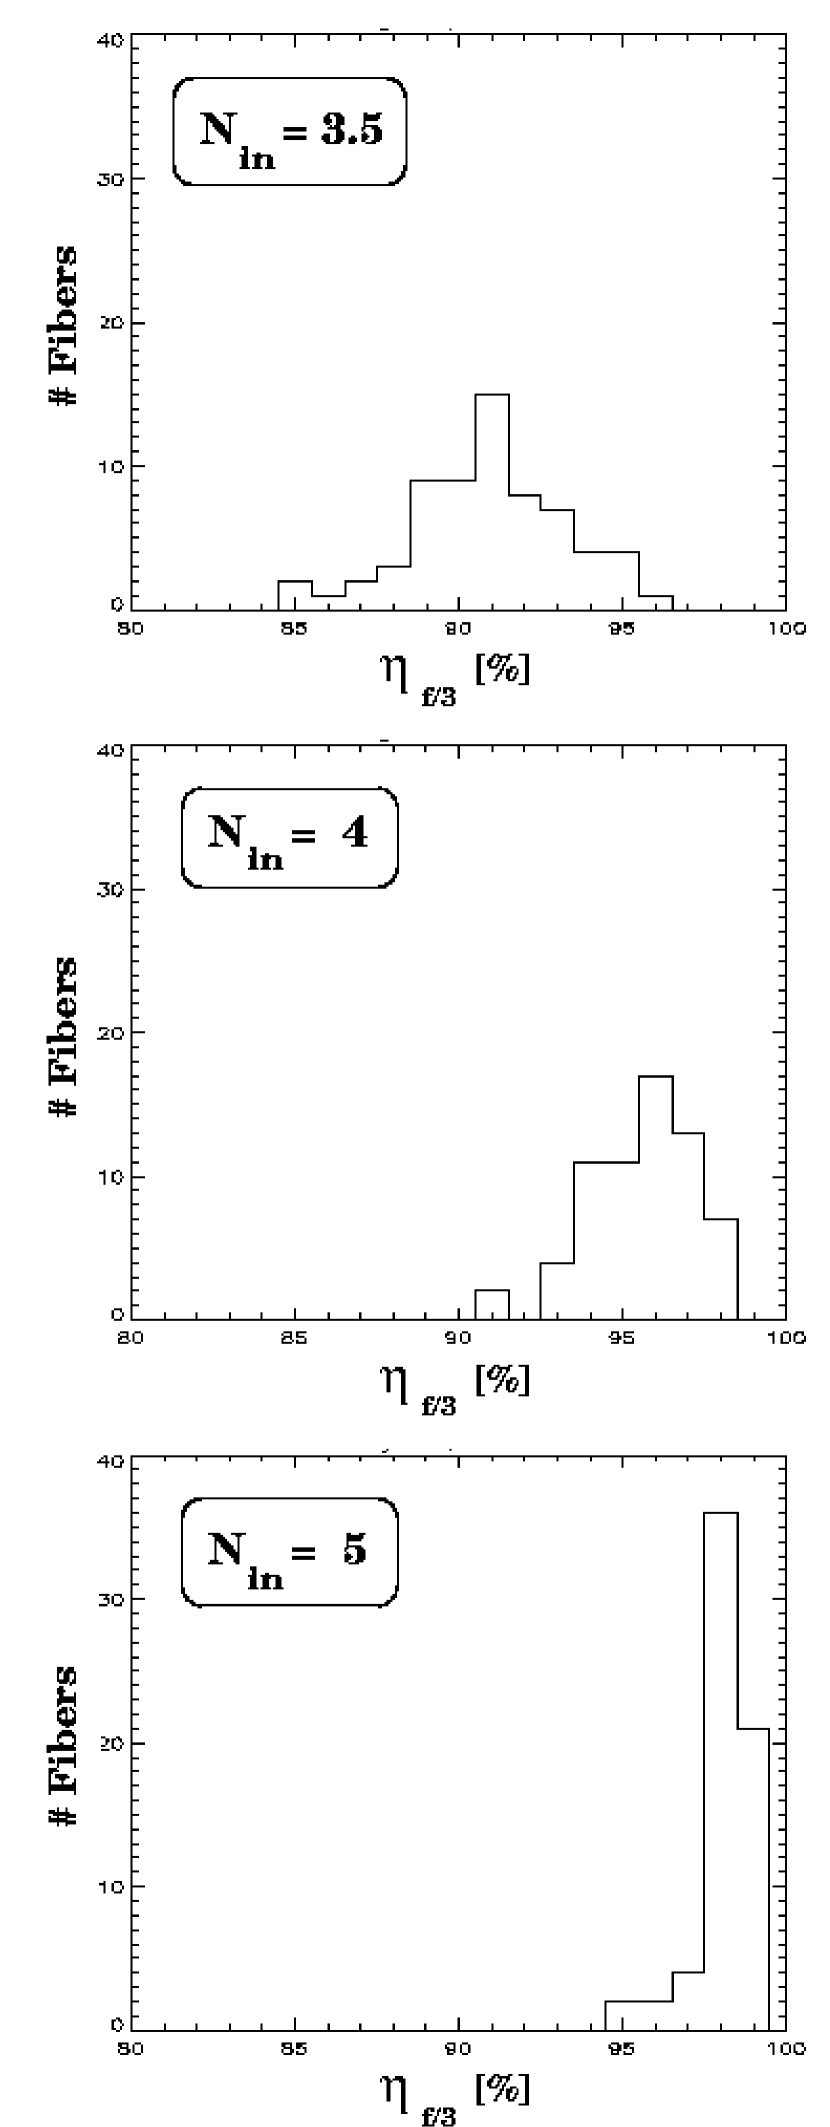
| MEAN | MEDIAN | |||
|---|---|---|---|---|
| % | % | % | % | |
| 3.5 | 90.91 | 91 | 11 | 7 |
| 4 | 95.57 | 96 | 8 | 6 |
| 5 | 98.11 | 98 | 5 | 3 |
To check the reliability of the measurements, three fibers from the sample above were chosen for ten consecutive cycles of new measurements. The choice included one with relatively low, one with mediocre and one with high coupling efficiency. During the measurements some conditions were changed (path of fibers, input and output ends, chucks).
Table 2 shows that the results are not very different from the large sample statistics despite of the higher degree of manipulation.
| MEAN | MEDIAN | |||
|---|---|---|---|---|
| % | % | % | % | |
| 3.5 | 91.89 | 92 | 13 | 10 |
| 4 | 95.85 | 96 | 9 | 7 |
| 5 | 98.00 | 99 | 5 | 4 |
During the tests, it became obvious that the fiber chucks, holding the fibers in a groove by means of a thin metal blade, have a significant effect on FRD.
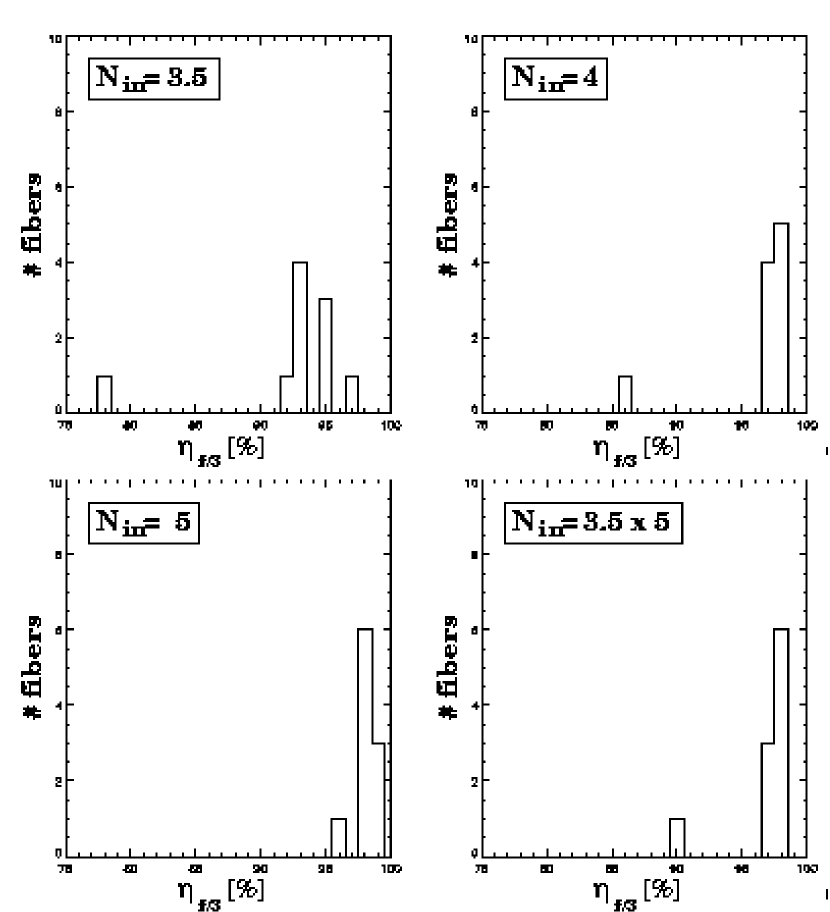
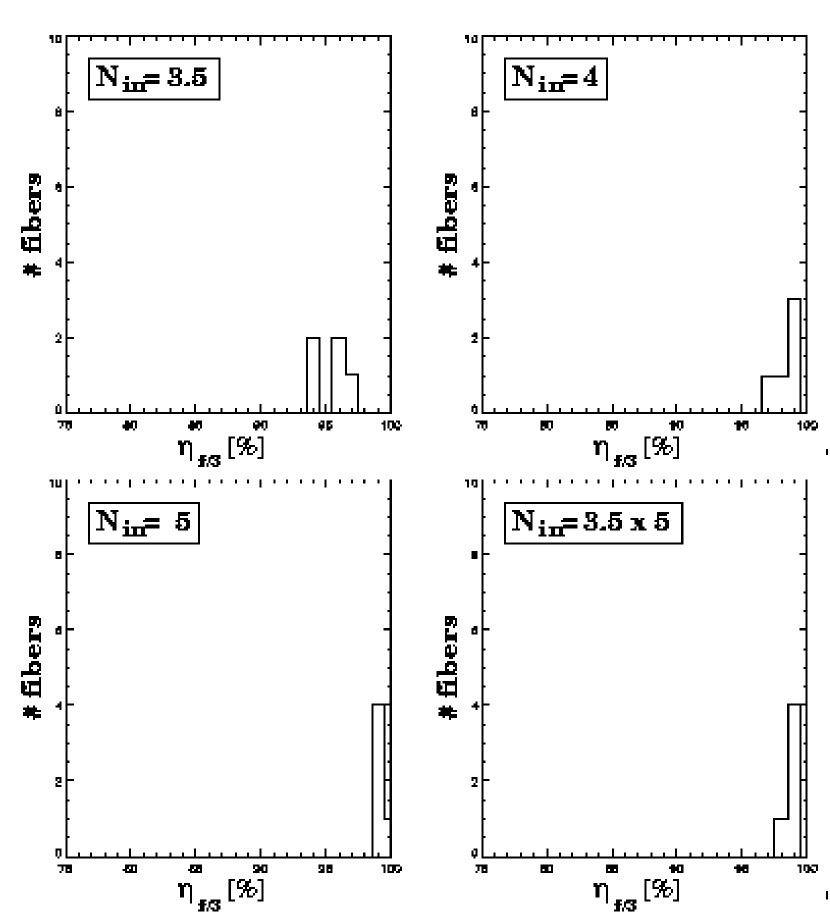
Glueing the fibers into steel tubes made the results more stable, and the coupling efficiencies increased again (see Fig. 4 and Table 3) 333We applied two different types of glue, namely EPOTEK 301-2 and a very soft multi-purpose glue (UHU), which essentially produced the same results. For long-term stability, the preferred choice is the EPOTEK 301-2.. This observation came as a surprise, because other authors have used mechanical holders precisely in order to avoid the stress normally introduced by glue (Avila, 1988). On the other hand, the effects of stress from mechanical holders was already mentioned (Ramsey, 1988).

| MEAN | MEDIAN | |||
|---|---|---|---|---|
| % | % | % | % | |
| 3.5 | 94.00 | 94 | 9 | 9 |
| 4 | 97.95 | 98 | 4 | 4 |
| 5 | 98.95 | 99 | 3 | 1 |
| 3.55 | 98.30 | 98 | 3 | 3 |
4 Final results
4.1 Efficiency gain by immersion coupling
After optimizing the test setup performance, 18 of the polished fibers glued in tubes were used to perform a final comparison between both coupling methods. The glass plates of the chuck holders were cleaned and the fibers attached, leaving a tiny air gap. In this way, the glass plates simulated the PMAS lens array on the input side, and the first collimator lens at the output. The output glass remained immersed to the dewar window to yield equal conditions for each test. The data in Table 4 show again a larger coupling efficiency when immersion coupling is applied. The coupling efficency increases by nearly three percent, which is not as high as the observed increase of the first test. Our explanation was that this time the fibers were not cleaved, but polished. Also the variation between different fibers is smaller due to polishing, but still decreases under immersion (Fig. 5). The photometric result shows that the total amount of light increases in immersion (Fig. 6). This was expected, because the saving of two glass-air interfaces should reduce Fresnel losses. Therefore, the fraction of light reaching the f/3 collimator (), becomes significantly larger and the photometric variation between fibers decreases. The light output over all fibers was fairly equal, except for fiber # 28 whose defects were not compensated by the immersion method. For the PMAS configuration () the predicted gain of light is 22 4 %.


| Method | () | I | |
|---|---|---|---|
| % | ADU | ADU | |
| AIR | 95.6 (9;6) | 3.36 0.09 | 3.21 0.10 |
| OIL | 98.5 (3;2) | 3.98 0.02 | 3.92 0.03 |
4.2 Influence of surface defects
The observed fact that surface perturbations were healed out under immersion raised the question about the required final fiber surface quality. To obtain an answer to this question, several fibers were polished to different states. For the polishing process a manual polishing tool was used on abrasive paper with different grain sizes. Grain sizes of 63, 9, 1 and 0.3 micrometers were employed. As seen in Fig. 7, 8 and 9, the effect of coarse polishing is quite obvious down to 1 m grain size. The statistics for 1 m - polished fibers (Table 5) shows, albeit the poor statistics of only five fibers, no difference with respect to normal fibers which had been polished down to 0.3 m. All these measurements were performed at a wavelength of 550 nm. The overall result is that high quality polishing is still necessary when using index matched fibers.
| Grain | MEAN | MEDIAN | ||
|---|---|---|---|---|
| m | % | % | ||
| 63 | 3.5 | 92.40 | 93 | 20 |
| 4 | 96.40 | 98 | 13 | |
| 5 | 98.10 | 98 | 4 | |
| 3.55 | 96.90 | 98 | 9 | |
| 9 | 3.5 | 94.4 | 95 | 11 |
| 4 | 97.8 | 98 | 5 | |
| 5 | 99.00 | 99 | 1 | |
| 3.55 | 98.20 | 98 | 3 | |
| 1 | 3.5 | 95.40 | 96 | 4 |
| 4 | 98.40 | 99 | 3 | |
| 5 | 99.20 | 99 | 2 | |
| 3.55 | 98.80 | 99 | 2 |
4.3 Influence of misalignment
The input of light into fibers is critical, considering the mechanical tolerances of fiber positioning. The consequences of misalignment were investigated using an immersed fiber. The effects of defocus, translation perpendicular to the optical axis and angular misalignment have been studied.
4.3.1 Defocus
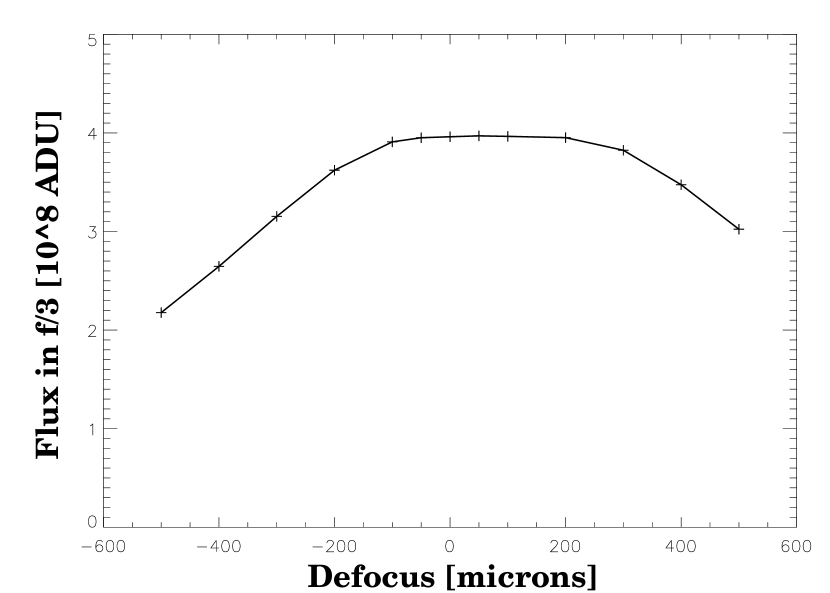
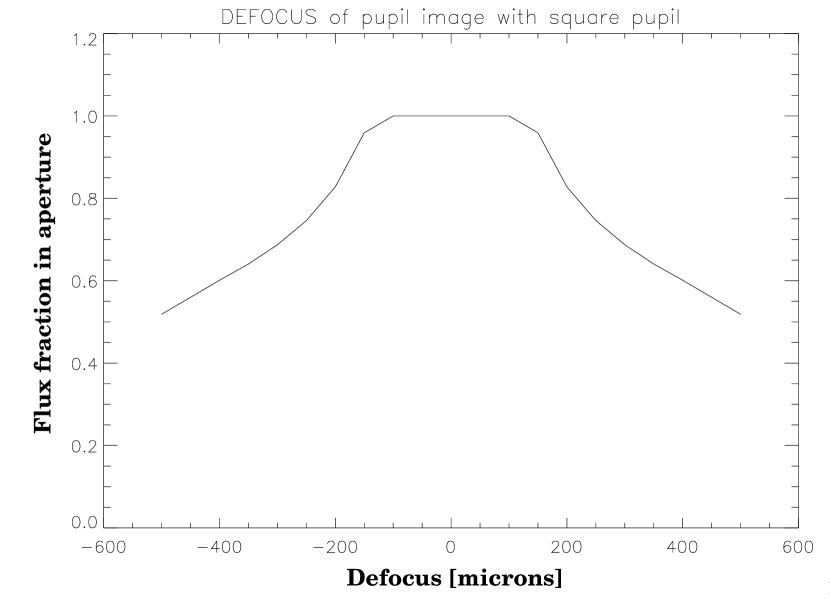
Defocus is introduced in an immersion coupled system when the sandwich of lenslet array, substrate and immersion medium layer does not exactly end at the true focal plane where the fibers are attached. Oversizing the fiber helps against errors, as seen in Fig. 10. In our example, the geometrical pupil size at the fiber input is about 71 m. Some tolerance is allowed for the focal position before light is lost at the limb of the 100 m fiber core. While in principle FRD should not change since the angle of incidence remains the same, light loss sets in as soon as the tolerance of about 100 m is exceeded. A simulation of geometric vignetting predicts fairly well the resulting light losses (Fig. 11) when compared with the observed behaviour. Since diffraction and optical aberrations were not taken into account, some details are notably different at small displacements, but the overall picture is correct. At a defocus of 500m, about 50% of the light is lost without any FRD changes.
4.3.2 Lateral translation
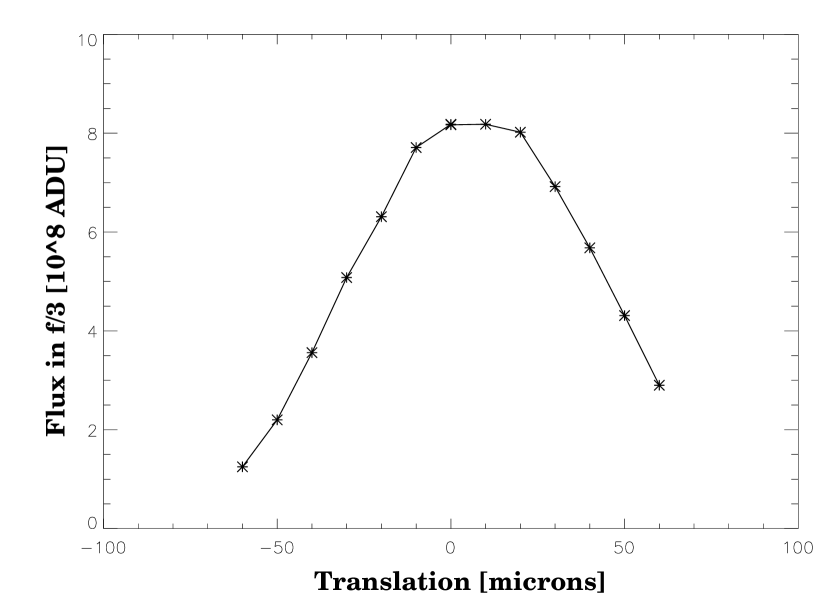
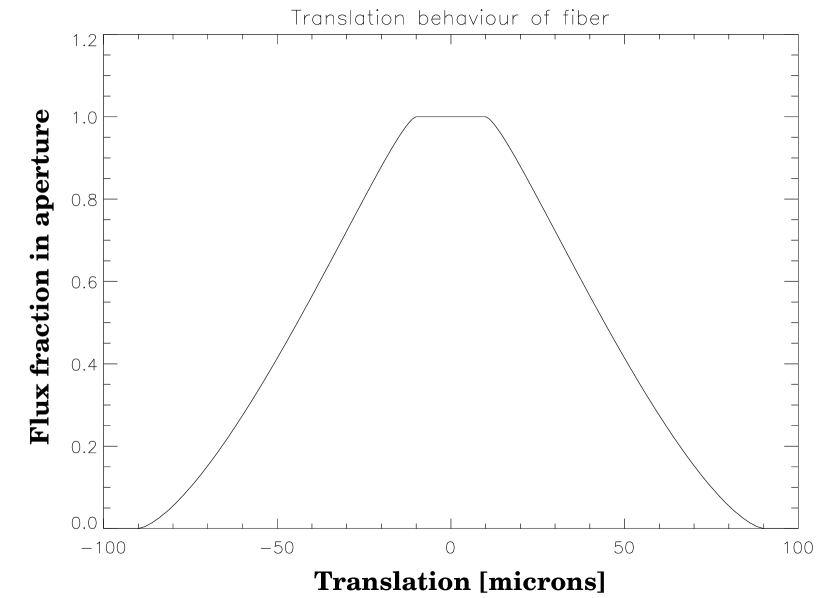
Lateral misalignment is caused by pitch variations of the lenslet array and inaccurate fiber positioning. For most modern monolithic arrays, the former source of error is negligible, while the latter remains a challenge. Errors are introduced by the mask which holds the fibers, the way the fibers are mounted in the mask and the degree to which the fibers are mounted concentric to their ferrules. Our measurement (Fig.12) is consistent with the allowable tolerance of 10 m, which is obtained when a round 80 m spot is moved inside a 100 m circle as simulated in Fig. 13. Note a slight misalignment of the zero point which was due to the limited accuracy of the adjustment with a photo diode. The shape of the light loss behaviour is consistent with the theoretical prediction and very steep. Even small lateral misalignments have strong effects on the overall efficiency. In this example, more than 50% of the light are lost as soon as the lateral misalignment is exceeding 45m. Due to the fact that the fiber surface is not much larger than the image projected on, no FRD changes are observed.
4.3.3 Angular misalignment
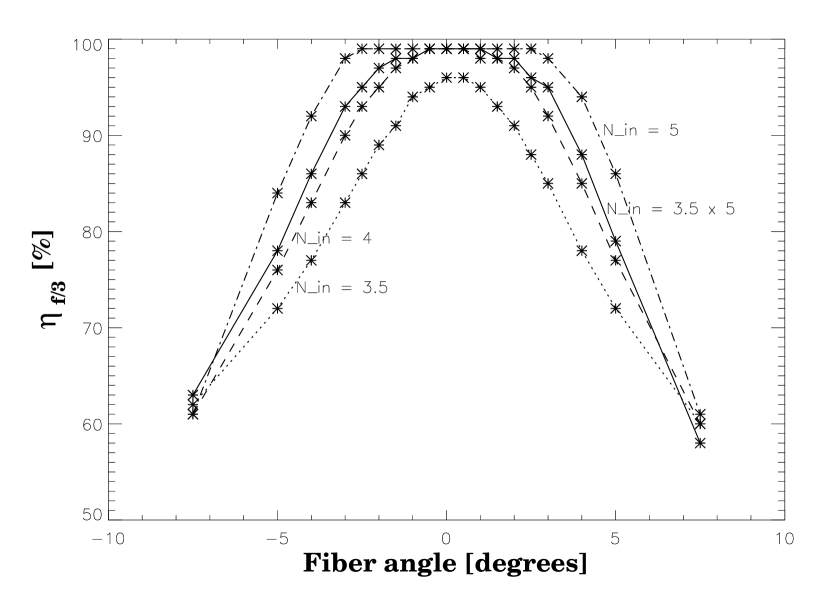
An angular misalignment occurs when the fibers are tilted slightly in their mask or when the whole lenslet array is tilted during the alignment to the fore-optics. In our setup we simulated angular misalignment by turning the aperture stop wheel in small increments. Fig. 14 shows that FRD losses become significant for deviations larger than two degrees, which is consistent with other measurements (Taylor & Gray, 1993). As expected, faster input focal ratios are more sensitive to angular misalignments. In our example, a fraction of more than 30% of the light is lost when the angular misalignment exceeds 7 degrees. This loss is not geometric but a pure FRD loss, as the change of in fig. 14 indicates.
4.4 Wavelength dependence
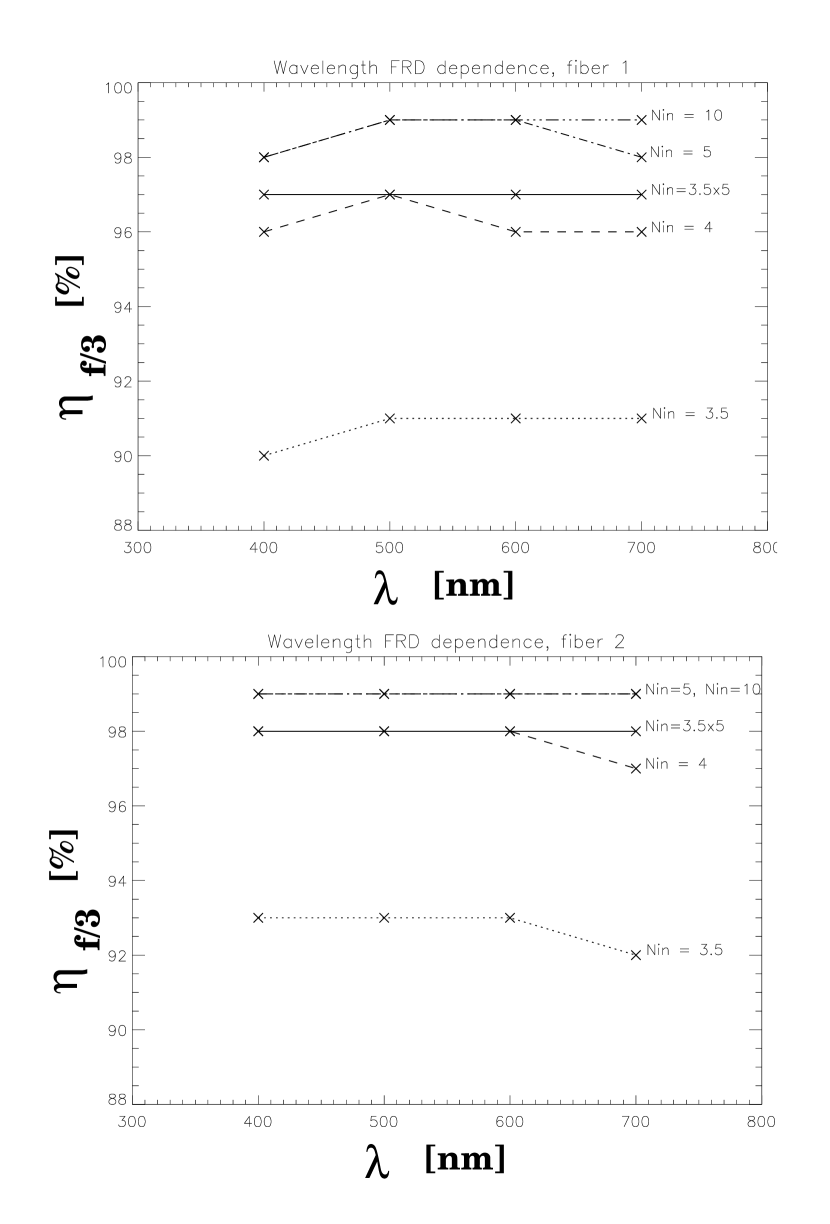
The measurements from above were performed at a wavelength of 550 nm with a bandpass of 10 nm FWHM. A possible dependence of FRD with wavelength was investigated. Theoretically, no wavelength dependence is to be expected (Lund & Enard, 1984). Chromatic aberrations of the objective lenses resulting in focus changes with wavelength were measured and compensated as far as possible during the measurements. The results of two fibers measured (Fig. 15) show that the theoretical expectation is fulfilled in a range between 400 and 700 nm. For wavelengths larger then 700 nm the coupling efficiency is totally dominated by the lens aberrations of the test setup and the results are no longer meaningful.
4.5 Modal Noise Tests
In the picture of waves propagating through an optical fiber, FRD is the change of modal distribution from lower to higher and to lossy modes. In bench-mounted spectrographs, connected to the telescope focal plane with a long fiber cable, the motion of this cable during tracking may give rise to a change of this modal distribution, caused by variable mechanical stress. Baudrand&Walker (2001) have measured the effect and attributed the observed S/N limit for high resolution spectroscopy (“modal noise”) to the occurance of this phenomenon. The same effect had been observed to set in with FOCES (Calar Alto 2.2m Telescope) when the telescope was tracking, but to vanish when the telescope stopped (M. Pfeiffer, priv. communication).
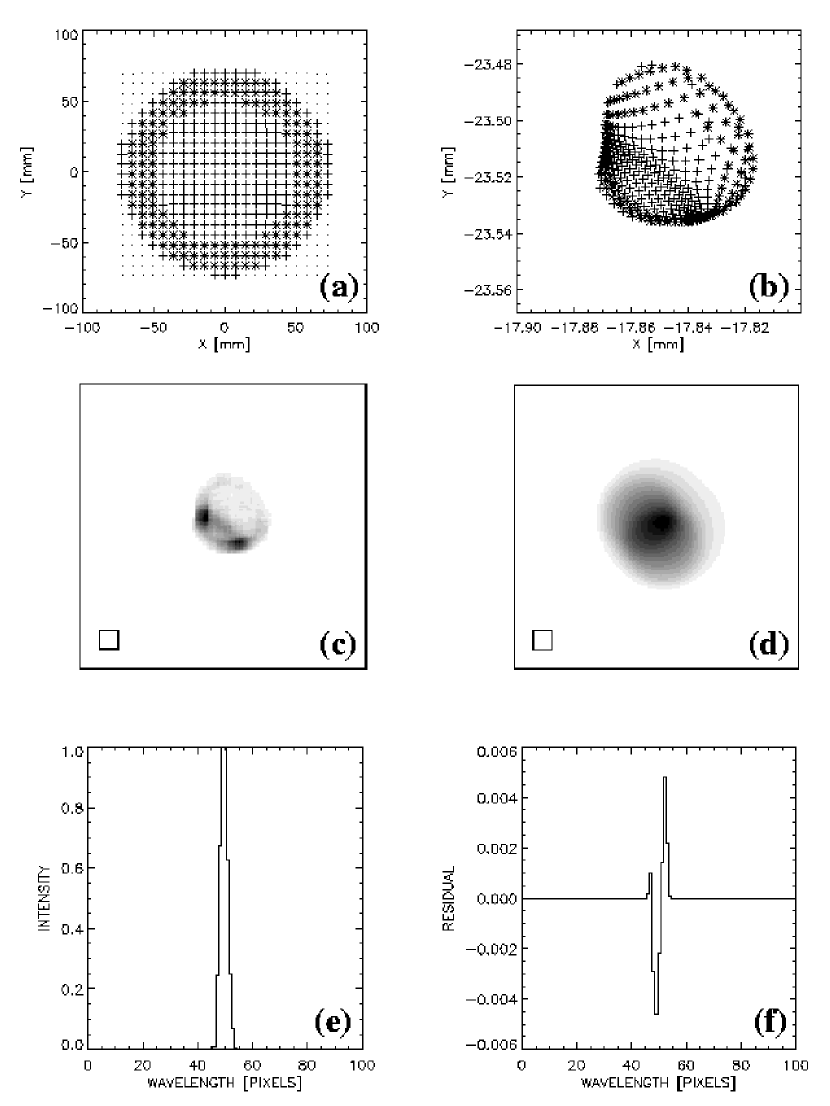
We have investigated whether modal redistribution of light in the output of a fiber is capable of producing measurable variations of the final spectra, e.g. comparable to the typical inaccuracy of sky-subtracted deep spectra at the wavelength of bright night sky emission lines. We performed a simulation, using the optical design data for the PMAS fiber spectrograph (Roth et al., 2002). An example is shown in Fig. 16 for a fiber located at a collimator field angle of 4.1 degrees, corresponding to a position of 82% of the half length of the pseudo-slit, counted from the center. The raytracing was performed for a wavelength of 852nm in the red part of the spectrum, where the night sky emission lines are known to present problems for accurate sky subtraction. Fig. 16a presents the orthogonal distribution of rays in the spectrograph pupil plane, excluding those rays outside of the circular pupil (dots). The rays which are entering the spectrograph focal plane (Fig. 16b) are plotted as crosses and asterisks, the latter symbolizing all rays originating from a pupil annulus whose intensity is modulated with a constant weight of (1X%) as an approximation to the observed redistribution of light in the output cone of a fiber. Not surprizingly, the spot diagram (Fig. 16b) reveals that the annulus rays, i.e. non-paraxial rays, are predominantly contributing to the wings of the spot, whose image (point-spread-function, PSF) is shown in Fig. 16c. For comparison, a 15m CCD pixel is outlined as a square in the lower left corner or the image. The PSF shows the onset of astigmatism and coma near the edge of the field. The present configuration of PMAS employs 100m diameter fibers, which are projected onto a demagnified diameter of 60m (4 pixels) on the CCD. The fiber image, represented by a circular disk of the projected fiber diameter, was convolved with the PSF, yielding the picture shown in Fig. 16d (modulation 0%). This image was taken as a model for an unresolved night sky emission line, which was extracted from the simulated CCD image by coadding pixels along the columns. The resulting spectrum, normalized to 1, is plotted in Fig. 16e. Repeating the simulation with a pupil annulus modulation of 10%, and subtracting the spectrum from the unperturbed spectrum produced the residual of Fig. 16f, having an amplitude of 0.5% with respect to the normalized emission line. The shape and order of magnitude resembles closely the typical appearance of a less than perfectly subtracted night sky emission line in deep spectra of faint objects.
For simplicity, the simulation was performed along the direction of dispersion. We have not further investigated the effects perpendicular to the direction of dispersion, depending largely on details like the width and spacing of spectra, and the method of extraction. We note qualitatively, however, that the expected cross-talk variance due to 10% modal redistribution is potentially capable of contributing a small error of order of 1%.
We note also that the preponderance of non-paraxial contributions to the wings of the PSF favours (a) refractive fiber spectrographs over optical designs with central obstruction, and (b) a high degree of scrambling of the telescope beam by means of a fiber, since any increased ring pattern of illumination in the pupil plane would magnify the effect.
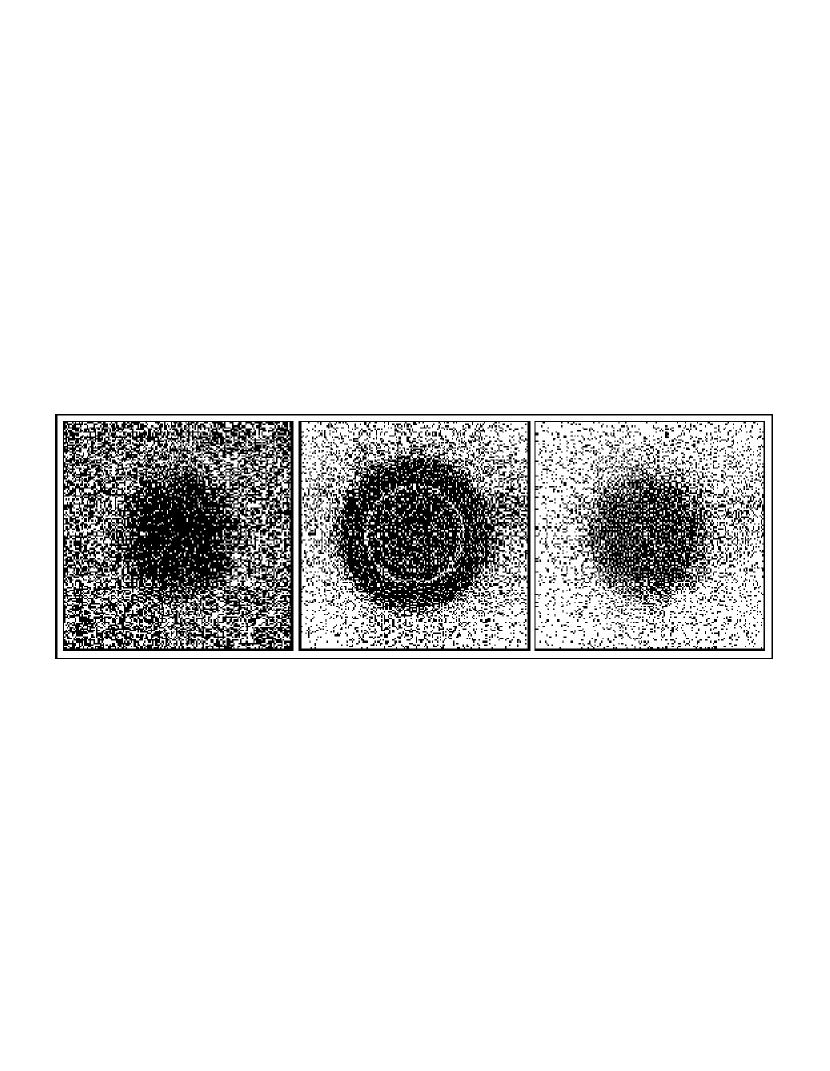
Our fiber testbench experiments included a stability test to verify the presence and order of magnitude of modal redistribution under controlled conditions. A series of CCD images of the fiber far field output pattern was obtained and the fiber manipulated in different ways. The test was performed under illumination with a 550nm central wavelength, 10nm bandwidth filter. Since the expected modulation must be observed over a large range of intensities and is expected to be small, we chose a differential approach, comparing our test images with a reference frame of an undisturbed fiber. A low-noise, cryogenic 16-bit CCD camera is an ideal tool for the required accuracy of about 0.1%. Fig. 17 shows results from a first qualitative test, comparing an undisturbed fiber with two cases of strong and weak perturbation (left, middle, right frame). Strong perturbation was imposed by pressing the fiber gently between two fingers, while weak perturbation was the similar with less pressure, but shaking the fiber rapidly. The static, strong stress situation caused a modal distribution in favor of some distinct, strongly amplified modes which created an annulus.
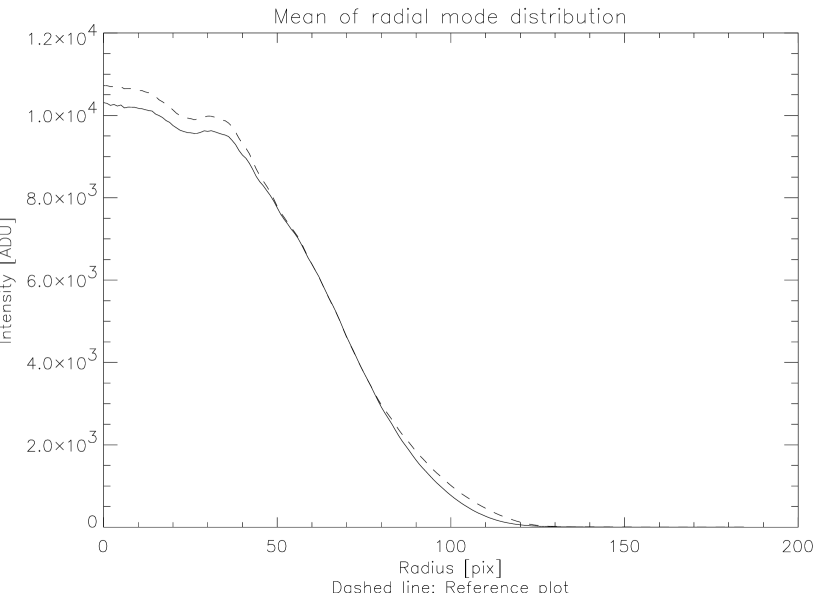
We also simulated the modal noise situation described by Baudrand&Walker (2001) with a 20m long Polymicro FHP 100/120/140 fiber and a mechanical telescope tracking simulator, consisting in a clock driven portable amateur telescope mount. Over a period of 6 hours, the simulator was tracking with the fiber, and a CCD exposure was taken every 15 minutes. Again, the series of CCD frames was analyzed differentially against a reference frame to observe deviations from this reference. The most striking example is shown in Fig. 18, revealing a drop in flux of 1.4% near the core, and of 2.9% in the wings, i.e. a total loss of flux of 4.3%. Neglecting the variation in intensity, the modal redistribution is seen as a relative enhancement within a zone similar to the annulus of our simulation from above.
5 Summary and Conclusions
We have designed and built a laboratory testbench for optical fibers, featuring a light source, filter wheels, a fiber illumination and adjustment device, and a cryogenic, low-noise 16-bit CCD camera system. Fiber measurements at different wavelengths and with different input focal ratios are performed automatically under remote control from a workstation which is also used for data reduction and analysis.
A sample of Polymicro FVP100/120/140 fibers was tested in this setup for use in the PMAS instrument. The far field of the fiber output was recorded with the CCD and the light collection efficiency within the projected nominal f/3 focal ratio of the collimator derived as a figure of merit for fiber FRD properties. The viability of this approach was verified with a repeatibility test.
As a practical result, it was found that immersion coupling, glueing fibers into ferrules, and polishing the fiber end faces improved on average the f/3 light collecting efficiency, and reduced the scatter among the samples under study.
Defocus at the fiber input was found to cause a slow decrease of beyond 100m. Decentering is very sensitively producing a rapid loss of efficiency beyond a tolerance of 15m. Deviation of the input beam from normal incidence, depending on input focal ratio, caused the onset of losses at angles of and for focal ratios of F/5 and f/3.5, respectively. As expected, there was no wavelength dependence found for FRD between 400nm and 700nm.
A qualitative test of fiber behaviour under stress showed that modal redistribution of light within different zones of the fiber output pattern occured at a level of typically 1% peak intensity for illumination at 550nm with a bandwidth of 10nm. Tracking a fiber with the telescope was simulated over a period of 6 hours, reproducing the effect of “modal noise”, which has been discussed in the literature as the reason for a limiting S/N for high resolution spectroscopy below the expected value due to photon shot noise. The net effect in our test was a maximal loss of intensity of 4%, and a redistribution of light in the output beam pattern of order several percent. On the basis of a ray tracing model, we demonstrate that modal redistribution is noticeable effecting the shape of the PMAS fiber spectrograph PSF when aberrations are present. The model is capable of reproducing typical night sky emission line residuals.
The results of this study have entered into the design and construction of the PMAS fiber module, but may prove useful also for other applications. We believe that the avoidance of modal noise is mandatory for the development of fiber coupled high resolution echelle spectrographs and spectropolarimeters at 8-10m class telescopes, which are expected to yield very high S/N ratios up to 104, see e.g.(Strassmeier et al., 2003).
References
- Allington-Smith et al. (1998) Allington-Smith, J., Haynes, R., Content, R. 1998: ASP Conf. Ser. 152, Fiber Optics in Astronomy III (San Francisco: ASP), 213-219
- Arribas et al. (1998) Arribas, S., et al. 1998: ASP Conf. Ser. 152, Fiber Optics in Astronomy III (San Francisco: ASP), 149-154
- Avila (1988) Avila, G. 1988, ASP Conf. Ser. 3, Fiber Optics in Astronomy (San Francisco: ASP), 63-73
- Avila (1998) Avila, G. 1998, ASP Conf. Ser. 152, Fiber Optics in Astronomy III (San Francisco: ASP), 44-49
- Baudrand et al. (1998) Baudrand, J., Guinouard, I., Jocou, L., Casse, M. 1998: ASP Conf. Ser. 152, Fiber Optics in Astronomy III (San Francisco: ASP), 32-43
- Baudrand & Walker (2001) Baudrand, J., Walker, G.A.H. 2001: PASP 113: 851-858
- Carrasco & Parry (1994) Carrasco, E., Parry, I.R. 1994: MNRAS 271 (London: Royal Astronomical Society), 1-12
- Clayton (1989) Clayton, C.A. 1989: Astron. Astrophys. 213 (Heidelberg: Springer), 502-515
- Craig, Hailey & Brodie (1988) Craig, W.W., Hailey, C.J., Brodie, J.P. 1988, ASP Conf. Ser. 3, Fiber Optics in Astronomy (San Francisco: ASP), 40-51
- Gilmore & Wyse (1992) Gilmore, G.G., Wyse, R.G. 1992: MNRAS 257 (London: Royal Astronomical Society), 1-10
- Guerin & Felenbok (1988) Guerin, J., Felenbok, P. 1988: ASP Conf. Ser. 3, Fiber Optics in Astronomy (San Francisco: ASP), 52-62
- Haynes et al. (1998) Haynes, R., Doel, A.P., Content, R., Allington-Smith, J.R., Lee, D. 1998: Optical Astronomical Instrumentation, Proc. SPIE Vol. 3355 (Washington: SPIE), 788-797
- Laux (1999) Laux, U. 1999: Astrooptik, Spektrum Akademischer Verlag, ISBN-Nr.3827413052 (Heidelberg: Spektrum), p. 192
- Lund & Enard (1984) Lund, G., Enard, D., 1984: Instrumentation in Astronomy V, Proc. SPIE 455 (Washington: SPIE), 65-76
- Parry et al. (2000) Parry, I.R., et al. 2000: Optical and IR Telescope Instrumentation and Detectors, Proc. SPIE Vol. 4008 (Washington: SPIE), 1193-1202
- Pasquini et al. (2000) Pasquini, L., et al. 2000: Optical and IR Telescope Instrumentation and Detectors, Proc. SPIE Vol. 4008 (Washington: SPIE), 129-140
- Prieto et al. (2000) Prieto, E., Le Fevre, O., Saisse, M., Voet, C., Bonneville, C. 2000: Optical and IR Telescope Instrumentation and Detectors, Proc. SPIE Vol. 4008 (Washington: SPIE), 510-521
- Ramsey (1988) Ramsey, L.W. 1988: ASP Conf. Ser. 3, Fiber Optics in Astronomy (San Francisco: ASP), 26-39
- Roth et al. (1997) Roth, M.M., Seydack, M., Bauer, S.M. 1997: Proc. Optical Telescopes of Today and Tomorrow, ed. A. Ardeberg, SPIE Vol. 2871 (Washington: SPIE), 1235
- Roth (1998) Roth, M.M. 1998: ESO Workshop Optical Detectors in Astronomy, Proceedings Kluwer Academic Publishers (Boston: Kluwer), Vol 228, 153
- Roth & Laux (1998) Roth, M.M., Laux, U. 1998: ASP Conf. Ser. 152, Fiber Optics in Astronomy III (San Francisco: ASP), 168-173
- Roth (1998) Roth, M.M., et al. 1998: Optical Astronomical Instrumentation, SPIE Proc. Vol. 3355 (Washington: SPIE), 798-809
- Roth et al. (2000) Roth, M.M. et al. 2000, ASP Conf. Ser. 195, Imaging the universe in three dimensions (San Francisco: ASP), 581-584
- Roth et al. (2002) Roth, M.M., Laux, U., Heilemann, W. 2000: Proc. Optical and IR Telescope Instrumentation and Detectors, eds. M. Iye, A.F.M. Moorwood, SPIE VOl. 4008 (Washington: SPIE), p. 485
- Schmoll, Popow & Roth (1998) Schmoll, J., Popow, E., Roth, M.M. 1998: ASP Conf. Ser. 152, Fiber Optics in Astronomy III (San Francisco: ASP), 64-67
- Strassmeier et al. (2003) Strassmeier, K.G., Hofmann, A., Woche, M., Rice, J.B., Keller, C., Piskunov, N.E., Pallavicini, R. 2003: SPIE4843, in press (Washington: SPIE).
- Taylor & Gray (1993) Taylor, K., Gray, P. 1993: ASP Conf. Ser. 37, Fiber Optics in Astronomy II (San Francisco: ASP), 379-391