First Stars Contribution to the Near Infrared Background Fluctuations
Abstract
We show that the emission from the first, metal-free stars inside Population III objects (PopIIIs) are needed to explain the level of fluctuations in the Near Infrared Background (NIRB) recently discovered by Kashlinsky et al. (2002), at least at the shortest wavelengths. Clustering of (unresolved) Pop IIIs can in fact account for the entire signal at almost all the 1-30 arcsec scales probed by observations in the J band. Their contribution fades away at shorter frequencies and becomes negligible in the K band. “Normal”, highly clustered, galaxies undergoing intense star-formation such a those found in the Hubble Deep Fields can ’fill in’ this gap and provide for the missing signal. It is in fact found that their contribution to the intensity fluctuations is the dominant one at m, while it gradually looses importance in the H and J bands. The joint contribution from these two populations of cosmic objects is able, within the errors, to reproduce the observed power spectrum in the whole Near Infrared range on small angular scales ( for Pop III protogalaxies). Signals on larger scales detected by other experiments instead require the presence of more local sources.
keywords:
galaxies: clustering - galaxies: infrared - cosmology: theory - large-scale structure - cosmology: observations1 Introduction
Different authors have reported the discovery of an excess in the Near Infrared Background (NIRB) which cannot be accounted for by normal galaxies (see Hauser & Dwek 2001 and references therein). This unaccounted excess can be well fitted by the redshifted light of the first population of stars born inside the so-called Population III objects (Pop IIIs) (Santos, Bromm & Kamionkowski 2001, Salvaterra & Ferrara 2003 [SF03]). More recently, Kashlinsky et al. (2002) have observed small-scale NIRB fluctuations in the J, H and K bands, which cannot be due to local or low redshift sources.
The aim of this paper is to show that PopIIIs are indeed required to account for the observed small-scale () background fluctuations at least in the J band. Their contribution – dominant for m – is found to rapidly decrease at longer wavelengths until it becomes negligible for m. We will also show that “normal”, high () redshift and highly clustered star-forming galaxies of the kind found in the Hubble Deep Fields can provide for the ’missing’ power in the H and K bands, so that the joint contribution from these two populations can reproduce, within the errors, the observed power spectrum of intensity fluctuations at all NIR wavelengths. Note that, due to the high redshifts of the two candidate populations (, as found by SF03, for PopIIIs and for “normal” star-forming galaxies), this is only true at small angular scales. Signals on intermediate-to-large scales detected by other experiments (; see e.g. Kashlinsky & Odenwald 2000; Matsumoto et al. 2000) are instead expected to require populations of more local sources.
The outline of the paper is as follows: in Sec. 2 we briefly describe the adopted model for the birth and evolution of Pop III protogalaxies. Sec. 3 presents our predictions for the intensity fluctuations of the NIRB due to the clustering of Pop III sources, while Sec. 4 compares such predictions with the available data and discusses the results. Finally, Sec. 5 summarizes our conclusions.
2 The Model
SF03 have shown that the NIRB data (see e.g. Hauser & Dwek (2001) and references therein) are well fitted by a model in which the contribution from PopIIIs is added to the “normal” galaxy background light as obtained from the Hubble Deep Field (Madau & Pozzetti 2000) or from the Subaru Deep Field (Totani et al. 2001). We now briefly summarize some of the many aspects of the SF03 model.
The mean specific intensity of the background due to PopIIIs , as seen at a frequency by an observer at redshift , can be written as
| (1) |
(Peebles 1993). Here , is the effective optical depth at of the IGM between redshift and , is the proper line element, and is the redshift when the sources begin to shine; is the comoving specific emissivity in units of erg s-1 Hz-1 cm-3, given by
| (2) |
where is the specific luminosity of the population at redshift , computed using the spectra for metal-free stars obtained by Schaerer (2002); is the comoving number density of dark matter halos of mass at redshift given by the Press & Schechter formalism (Press & Schechter 1974). The integral gives the dark matter mass per unit volume contained in dark matter halos with mass greater than , where (computed by Fuller & Couchman 2000) is a cutoff mass below which halos cannot form stars due to the lack of cooling. and are the total matter and baryon density111 We adopt the ‘concordance’ model values for the cosmological parameters: , , , , , and , where is the dimensionless Hubble constant, km s-1 Mpc-1 in units of the critical density . The ratio converts the integral into baryonic mass which is then turned into stars with an efficiency . This latter quantity is constrained by the contribution of the redshifted light of PopIIIs to the NIRB (SF03). The PopIII star formation efficiency required to match the NIRB data depends essentially only on their initial mass function (IMF), being in the range (the top-heaviest requiring lowest efficiency). The redshift at which the formation of metal-free stars ends is tightly constrained to be by the J band data (SF03).
3 Contribution of clustering to background fluctuations
The angular correlation function of intensity fluctuations due to inhomogeneities in the space distribution of unresolved sources (i.e. with fluxes fainter than some threshold ) is defined as:
| (3) |
where and identify two positions on the sky separated by an angle . The above expression can be written as the sum of two terms, and , the first one due to Poisson noise (i.e. fluctuations given by randomly distributed objects), and the second one owing to source clustering (De Zotti et al. 1996 and Magliocchetti et al. 2001 for a detailed discussion). In the case of strongly clustered sources, as the NIR data seems to indicate (Kashlinsky et al. 2002), the Poisson term is found to be negligible when compared to (see e.g. Scott & White 1999). We can therefore safely assume (hereafter simply called ), whose expression in the case of Pop III sources is given by
| (4) |
where is the comoving radial coordinate, (for a flat universe and in the small angle approximation), the comoving specific emissivity at the frequency , and and are defined as in Sec. 2.
The spatial two-point correlation function of a class of galaxies ’’, , in general results from a complicated interplay between the clustering properties of the underlying dark matter and physical processes associated to the formation of such galaxies (see e.g. Peacock & Smith 2000; Scoccimarro et al. 2001; Magliocchetti & Porciani 2003). However, at high enough () redshifts, the probability for a dark matter halo to host more than one galaxy is negligible (see e.g. Somerville et al. 2001), and one can write:
| (5) |
where is the mass-mass correlation function and the bias associated to all dark matter haloes massive enough to host a galaxy at redshift .
In equation (5), has been obtained following the work by Peacock & Dodds (1996; see also Moscardini et al. 1998 and Magliocchetti et al. 2000), which provides an analytical way to derive the trend of the dark matter correlation function both in the linear and non-linear regime. Note that only depends on the underlying cosmology and on the normalization of . The effective bias factor of all haloes with masses greater than some threshold (quantity which generally may depend on the look-back time) is instead obtained by integrating the quantity - representing the bias of individual haloes of mass - opportunely weighted by their number density :
| (6) |
where, in this case, the mass function is obtained according to the Press & Schechter (1974) approach and we take the functional form for from Jing (1998) (but see also Scannapieco & Barkana 2002).
If we then plug into equation (4) the expressions obtained by SF03 (see Sec. 2) for the specific emissivity , the halo cutoff mass , and use as the minimum redshift at which these sources contribute to the background the value (corresponding to the epoch at which metal-free star formation ends – note that we are making the reasonable assumption that no such a source can be resolved by current observations), then, by also making use of expressions (5) and (6), we can derive predictions for the contribution of the clustering of (unresolved) PopIIIs to the background fluctuations at different wavelengths.

The cases for m, m and m (respectively corresponding to J, H and K bands) are presented in Figure 1 by the solid, dashed and dotted lines. Since these wavelengths at the redshifts under exam are always greater than the rest-frame Ly, the contribution from the term in equation 4 can be neglected in the calculation of (see SF03).
The first feature to be noticed in the plot is the sharp drop of all the curves at arcsec. This is due to the fact that such an angular scale corresponds to distances Mpc (with the minimum value corresponding to in the adopted cosmology), where the spatial correlation function has already steepened from its power-law behaviour and rapidly approaches the zero value. As a first conclusion of this work we can then say that the clustering of unresolved PopIII sources cannot account for any of the observed fluctuations on scales arcsec, which instead require much more local objects (for the Matsumoto et al. 2003 results the maximum acceptable redshift turns out to be ).
The second point to stress is the remarkably different amplitude of the intensity fluctuations as evaluated at different frequencies. More specifically, is found to decrease by about two orders of magnitude when going from m to m. As already argued by SF03, the reason for this decrement has to be found in the extremely strong Ly nebular emission line – responsible for a considerable fraction of the PopIII emissivity – which, once redshifted to the present time, gives its maximum contribution in the J band and rapidly disappears at the other two wavelengths under exam. We discuss the implications of these findings in the next Section.
4 Comparison with the data
Kashlinsky et al. (2002) and Odenwald et al. (2003) have recently reported the first detection of
small angular scale fluctuations in the Near Infrared Background. Their
measurements were obtained by using long integration data constructed from
2MASS (Two Micron Sky Survey) observations and by then coadding images
in order to produce a field, divided into
seven square patches 512′′ on the side. In each patch,
individual stars and galaxies were removed down to a magnitude limit which
slightly varied from patch to patch, due to variations in the background level
and associated noise. The clipping algorithm was applied for a mash size of 3 by 3 pixels
(corresponding to 9 square arcsecs). However, in order to test for its stability, the above procedure
was also repeated with increasing mask sizes (up to 5 by 5 pixels) and the corresponding results were
found in agreement with each other (S. Kashlinsky, private communication). Such an approach ensures the
effective removal of entire galaxies at all redshifts but the lowest ones in which case more extended
objects were identified by eye and removed by the clipping algorithm regardless.
The remaining diffuse light was then Fourier
transformed, with the resulting power spectrum showing a positive signal
at all 1-30 arcsec scales and in all the seven patches.
The authors estimate contributions to the observed power spectrum from
possible non-cosmological components such as atmospheric fluctuations,
remaining Galactic stars, cirrus emission, zodiacal light (expected to be the largest
source of uncertainty in the treatment of NIRB data), instrument noise
and extinction, and conclude that they all have different slopes and
negligible amplitudes when compared to the observed signal. Odenwald et al.
(2003) and Kashlinsky et al. (2002) identify the measured power spectrum as
due to clustering of faint (K 18.5-19 mag), high redshift, galaxies
undergoing significant star-formation.
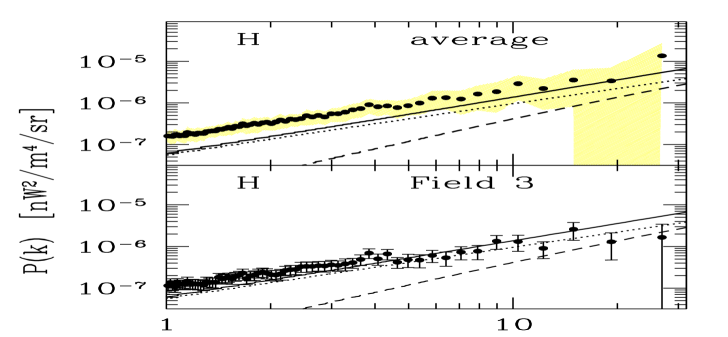
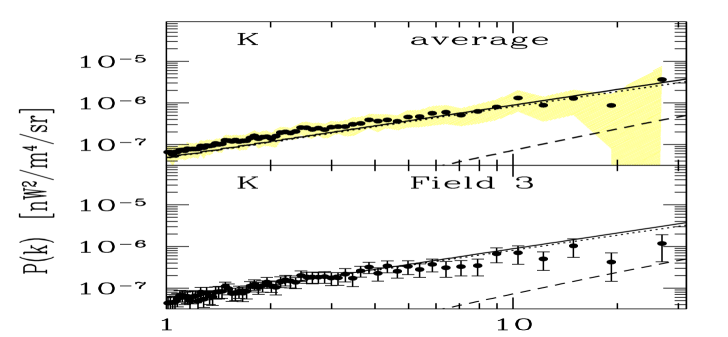
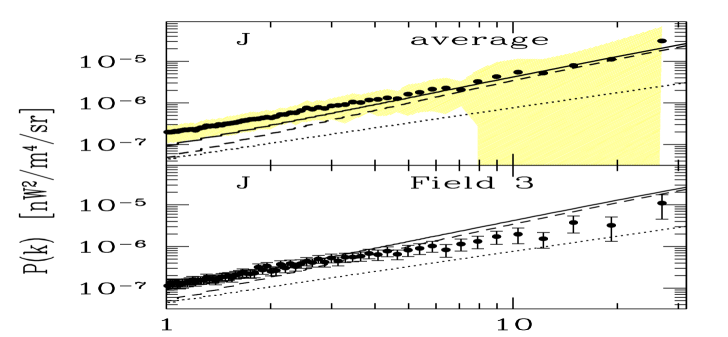
Their results (kindly provided by S. Kashlinsky in electronic form) are presented in Figures 2, 3 and 4 respectively for the J, H and K bands. The lower panels show the power spectrum as measured at the different wavelengths from Field 3, considered by Odenwald et al. (2003) as the most representative one due to its depth (limiting magnitudes for sources removal: J=20, H=19.2, K=19). The upper panels instead report the signal obtained by averaging measurements in all their seven fields. The shaded areas illustrate the levels of uncertainty due to both statistical (Poissonian) errors (corresponding to the errorbars in the lower panels) and field-to-field variations, found to be the dominant effect possibly because of the small area covered by each of the patches (cosmic variance). Note that the data has already been corrected for the atmospheric contribution.
In order to compare these measurements with predictions from Sec. 3, we have converted our results for the intensity fluctuations due to PopIIIs into the corresponding signal in the angular wavenumber space, , where
| (7) |
with zero-th order Bessel function.
The resulting power spectrum at the different wavelenghts is illustrated in Figures 2, 3 and 4 by the dashed lines. As it is clear by comparing data with model predictions in both panels of Figure 2, the clustering properties of PopIIIs can nicely explain the observed fluctuations in the J band, even though there seems to be some discrepancy at the smallest angular scales. The situation however gets increasingly worse when one goes to longer wavelengths and it is found that, while in the H band this class of sources can only (possibly) account for the observed spectrum at the highest angular scales probed by the data, their contribution in the K band falls short by at least one order of magnitude. Also, especially in the H and K bands, the predicted slopes for the power spectrum result too steep when compared to the measured ones.
The missing ingredient to this analysis has to be searched amongst “normal galaxies” which can at least partially account for the extragalactic light emitted at the wavelengths under exam (see Madau & Pozzetti 2000; Totani et al. 2001). In their work, Kashlinsky et al. (2002) and Odenwald et al. (2003) remove from the maps all resolved sources up to K which, they claim, corresponds to the removal of possibly all resolvable galaxies to redshifts (with some allowance made for low-surface brightness systems). However, we argue that the population of galaxies responsible – together with PopIIIs – for the observed NIRB fluctuations must reside at redshifts 222The possibility for a non-negligible part of the unaccounted signal to be due to residual disk emission from low-redshift galaxies whose nuclei have been removed can be discarded with a high confidence level both on the basis of the arguments introduced in this section re the clipping procedure and also by noticing that (relatively local) galaxies up to the clipping threshold K contribute only a very small fraction of the CIB at this wavelength (see e.g. Kashlinsky et al. 2002). So, even if some (outer) parts of these galaxies were to remain, their contribution to the observed signal would be extremely small.. The argument supporting this conclusion goes as follows.
The power spectrum of fluctuations as measured by 2MASS features a remarkable power-law behaviour down to angular scales of 1 arcsec. Under the hypothesis for this signal to be generated by large-scale structure, one has that – since the correlation function of dark matter haloes (see equation 5) must drop to -1 on distances smaller than two virial radii due to spatial halo-halo exclusion (see e.g. Magliocchetti & Porciani 2003) – the power-law trend exhibited by the data down to 1 arcsec sets a strong limit on the minimum redshift at which these “normal galaxies” appear. More in detail, one has that for masses of the order of (value taken as a reasonable lower limit for the kind of objects under exam) and the cosmology adopted in this paper, the condition for a power-law behaviour to hold at the minimum scales probed by the data is only met for redshifts .
What are then these “normal galaxies”, faint enough not to be resolved by a K survey, which can significantly contribute to the observed fluctuations of the NIRB, especially in the H and K bands? A natural candidate can be found in the population of high-, star-forming galaxies detected in the Hubble Deep Fields to =29. Magliocchetti & Maddox (1999) have measured the clustering signal for this class of galaxies and shown that they are indeed strongly clustered, with an amplitude (where the angular correlation function was parametrized as ), constant within the errors at all redshifts .
The contribution of this class of galaxies to intensity fluctuations in the NIRB can then be written as , where is the residual background intensity after source removal. Suitable values for at the wavelengths relevant to this work can be obtained by taking the estimates for the total extragalactic light emitted in the J, H and K bands from Madau & Pozzetti (2000), and by then subtracting the contributions from resolved sources as given in Kashlinsky et al. (2002). Note that the resulting ’s, can in principle only be considered as upper limits, since the Kashlinsky and collaborators figures were given by assuming source removal up to , while we are considering background fluctuations made by galaxies.
The power spectrum of intensity fluctuations in the NIRB obtained for these
“normal” galaxies in the J, H and K bands is shown in Figures
2, 3 and 4 by the dotted lines. The solid
lines instead illustrate the total signal steaming from the sum
of the contribution of this class of sources with the one deriving from
PopIIIs. “Normal”, faint, high-redshift galaxies are able to
reproduce the observed power spectrum at all angular scales in the K band,
both in its amplitude and its slope. Their contribution however becomes
less and less important as one moves towards shorter wavelengths and – at
m – not only can just account for % of the
observed signal, but also has a different (shallower) dependence on the
angular scale than what the data indicates.
It is then found that, since PopIIIs and “normal” galaxies
seem to be responsible for the
observed fluctuations with a different relevance at the different wavelengths
(PopIIIs mainly appearing in the J band, “normal” galaxies giving
the strongest contribution in the K band), their sum is able to reproduce the
data within the errors at all wavelengths (with some allowance made
in the H band). In more detail, by considering
both populations we can give account for the observed (roughly constant)
amplitude of the observed power spectrum at the different wavelengths, and can
also naturally explain the steepening of its slope when moving to shorter
wavelengths as due to the intervening contribution of PopIII sources.
Note that the match is particularly good, especially if one considers
that there are no free parameters in the model.
Our predictions do not depend on the exact functional form
for the chosen IMF and star-formation efficiency , as long as their combination
is able to reproduce the observed NIRB (SF03). Obviously, one of the main uncertainties
of this work is associated to the determination of the slope of the predicted power spectrum.
This is due to the lack of solid determinations of the two-point correlation function, from
both an observational and a theoretical point of view, at the high redshifts and small masses
under exam. The fact that our predictions result – within the errors – in agreement
with the observed trend however gives us some confidence that the assumptions made in the course
of our analysis are (at least) plausible.
As a last remark we note that, even if in the above analysis we have considered in the different bands as an upper limit of the true background intensity, the fact that the data at m is perfectly reproduced by the population of “normal” galaxies suggests this upper limit to be very close to the real value for otherwise the curves would have fallen below the observations. Under this assumption, there is then no need for the emergence of a third, still-unknown, population of objects, since PopIIIs, together with high-redshift/star-forming “normal” galaxies, can fully explain the observed level of fluctuations.
5 conclusions
In this paper we have used the model of SF03 to derive the expected contribution of the clustering of (unresolved) PopIIIs to the intensity fluctuations of the NIRB. Comparisons with the recent observations by Odenwald et al. (2003) show that this class of sources can indeed account for the observed level of fluctuations at almost all the 1-30 arcsec scales probed by the data, at least in the J band where the Ly nebular emission line – responsible for most of the PopIII emissivity – once redshifted to the present time gives its maximum contribution. Their relevance however rapidly fades away for shorter frequencies and becomes negligible in the K band.
“Normal”, highly clustered, galaxies undergoing intense star-formation such a those found in the Hubble Deep Fields can ’fill in’ this gap and provide for the missing signal. If we in fact assume these objects to produce a clustering signal as measured by Magliocchetti & Maddox (1999) and associate them to a background intensity in in the J, H and K bands as taken from Madau & Pozzetti (2000) (after source removal), we find that their contribution to the intensity fluctuations is the dominant one at m, while it gradually looses importance in the H and J bands.
The sum of the two PopIIIs and “normal” galaxies components is able, within the errors, to reproduce the observed power spectrum of intensity fluctuations in the whole Near Infrared range on small angular scales ( for PopIII sources). The match is particularly good, especially if one considers that our model is not associated to any free parameter. Signals on larger scales as detected by other experiments (see Hauser & Dwek 2001 for review) are instead expected to require populations of more local sources.
The present results strongly support the scenario presented by Schneider et al. (2002) (see also Scannapieco, Schneider & Ferrara 2003), in which the first stars where biased towards high masses, thus producing copious amounts of ionizing photons and heavy elements which caused cosmic reionization and enrichment of the otherwise pristine intergalactic medium. It is only when the gas metallicity reached a critical value (still subject to uncertainties due to the complicated physics of molecular cloud fragmentation) in the range that a relatively abrupt transition to the ‘normal’ star formation mode took place. This epoch has left a remarkable imprint both in the intensity and the fluctuations of the NIRB that we have here isolated for the first time.
ACKNOWLEDGMENTS
Sasha Kashlinsky is warmly thanked for providing us with the data shown in Figures 2, 3 and 4 and for useful clarifications on its derivation.
References
- [1] De Zotti G., Franceschini A., Toffolatti L., Mazzei P., Danese L., 1996, Ap. Lett.Comm., 35, 289
- [] Fuller T. M. & Couchman H. M. P., 2000, ApJ, 544, 6
- [13] Jing Y.P., 1998, ApJ, 503, L9
- [23] Hauser M., Dwek E., 2001, ARA&A, 39, 249
- [18] Kashlinsky A., Odenwald S., 2000, ApJ, 528, 74
- [3] Kashlinsky A., Odenwald S., Mather J., Skrutskie M.F., Cutri R.M., 2002, ApJ, 579, L53
- [21] Madau P., Pozzetti L., 2000, MNRAS, 312, L9
- [22] Magliocchetti M., Maddox S.J., 1999, MNRAS, 306, 988
- [10] Magliocchetti M., Bagla J., Maddox S.J., Lahav O., 2000, MNRAS, 314, 546
- [2] Magliocchetti M., Moscardini L., Panuzzo P., Granato G.L. De Zotti G., Danese L. 2001, MNRAS, 325, 1553
- [7] Magliocchetti M., Porciani C., 2003, MNRAS, submitted, astro-ph/0304003
- [19] Matsumoto T. et al., 2000, in ’ISO Surveys of a Dusty Universe, ed. D. Lemke, M. Stickel & K. Wilke, vol. 548, 96
- [15] Matsumoto T. et al., 2003, ApJ, submitted
- [9] Moscardini L., Coles P., Lucchin F., Matarrese S., 1998, MNRAS, 299, 95
- [16] Odenwald S., Kashlinsky A., Mather J.C., Skrutskie M.F., Cutri R.M., 2003, ApJ, 583, 535
- [6] Peacock J.A., Dodds S.J., 1996, MNRAS, 267, 1020
- [5] Peacock J.A., Smith R.E., 2000, MNRAS, 318, 1144
- [44] Peebles P. J. E., 1993, Principles of Physical Cosmology, Princeton Univ. Press, Princeton, NJ
- [12] Press W.H., Schechter P., 1974, ApJ, 187, 425
- [14] Salvaterra R., Ferrara A., 2003, MNRAS, in press, astro-ph/0210331 (SF03)
- [a] Santos M. R., Bromm V., Kamionkowski M., 2002, MNRAS, 336, 1082
- [s] Scannapieco E., Barkana R., 2002, ApJ, 571, 585
- [x] Scannapieco, E., Schneider, R. & Ferrara, A. 2003, MNRAS, in press, (astro-ph/0301628)
- [y] Schaerer D., 2002, A&A, 382, 28
- [77] Schneider, R. Ferrara, A., Natarajan, P. & Omukai, K. 2002, ApJ, 571, 30
- [11] Scoccimarro R., Sheth R.K., Hui L., Jain B., 2001, ApJ, 546, 20
- [4] Scott D., White M., 1999, A&A, 346, 1
- [8] Somerville R.S., Lemson G., Sigad Y., Dekel A., Kauffmann G., White S.D.M., 2001, MNRAS, 320, 289
- [20] Totani T., Yoshii Y., Iwamuro F., Maihara T., Motohara K., 2001, ApJ, 550, L137