Star Formation and the ISM in Four Dwarf Irregular Galaxies
Abstract
We present new, high sensitivity VLA observations of HI in four dwarf galaxies (UGCA 292, GR8, DDO 210, and DDO 216) and we use these data to study interactions between star formation and the interstellar medium. HI velocity dispersions and line shapes in UGCA 292, GR8, and DDO 210 show evidence that these three galaxies contain both warm and cool or cold HI phases. The presence of the cold neutral medium is indicated by a low-dispersion (3–6 km s-1) HI component or by the Gauss-Hermite shape parameter . Contrary to expectations, we find no trend between the incidence of the low-dispersion (colder) phase and the star formation rate in five dwarf galaxies. The colder HI phase may be a necessary ingredient for star formation, but it is clearly not sufficient. However, there is a global trend between the star formation rate of a galaxy and the incidence of asymmetric HI profiles. This trend probably reflects kinetic energy input from young massive stars. Numerical simulations show that the effects of rotational broadening (finite angular resolution) are minimal for these galaxies. Simulations are also used to estimate the errors in the column densities of the high-dispersion and the low-dispersion HI phases.
1 Introduction
Among the dwarf galaxies we find an impressive variety of optical morphologies, colors, gas contents, star formation rates and gas depletion timescales. Youngblood & Hunter (1999) found a variation of more than three orders of magnitude in the star formation rate per unit area of nearby dwarf irregulars. The star formation rates of individual galaxies have varied by factors of more than 10, both increasing and decreasing, over a Hubble time (Mateo, 1998). The Local Group contains some galaxies with evidence for recent star formation but no sign of neutral gas, such as the Fornax dwarf spheroidal (Stetson, Hesser, & Smecker-Hane, 1998; Young, 1999). It also contains some relatively gas-rich galaxies with little to no known star formation activity, such as DDO 210 and DDO 216 (van Zee, 2000). What happens in the interstellar medium (ISM) to cause such wide variations in the gas consumption timescales? The interplay between gas properties and star formation is one of the more interesting unsolved issues in the evolution of dwarf galaxies. We investigate this issue by careful study of the properties of the ISM in a sample of four dwarf irregular galaxies and comparison with their current star formation activity.
Star formation activity in dwarf galaxies is expected to take place in molecular gas, just as it does in our own Galaxy. However, molecular gas is normally not directly detectable in the lowest mass (lowest metallicity) dwarf galaxies (Taylor, Kobulnicky, & Skillman, 1998; Vidal-Madjar et al., 2000). On the other hand, studies of our own Galaxy show that one can learn a great deal about the ISM from HI. Clark (1965) and Radhakrishnan, Murray, Lockhart, & Whittle (1972) found that Galactic HI emission profiles often have a high-dispersion (10 km s-1) optically thin HI component superposed on a low-dispersion (3 km s-1) optically thick component. The low-dispersion component also appears in absorption against a continuum source, whereas the high-dispersion component does not commonly appear in absorption. The spatial distribution of the low-dispersion component is highly clumped; it does not appear along every line of sight, but the high dispersion component is ubiquitous.
Emission and absorption spectra can be used to estimate the spin temperatures of these components. The low dispersion component arises in a cold neutral medium (CNM) of temperature 100 K, and the high dispersion component arises in a warm neutral medium (WNM) of temperature few thousand K (Kulkarni & Heiles, 1988). A recent review of observational and theoretical evidence is given by Wolfire, McKee, Hollenbach, & Tielens (2002). There is some evidence that a portion of the WNM may be in a thermally unstable temperature range K, rather than the thermally stable temperature range K (Heiles & Troland, 2002; Kritsuk & Norman, 2002; Gazol, Vázquez-Semadeni, Sánchez-Salcedo, & Scalo, 2001). However, there seems to be no disagreement that Galactic HI encompasses a variety of temperatures.
The key connection between this HI work and what we hope to learn about star formation in the dwarf galaxies is that the cold phase of HI is usually assumed to be a necessary ingredient for star formation (Wolfire, McKee, Hollenbach, & Tielens, 2002; Parravano, 1988, 1989; Dickey, Mebold, Stanimirovic, & Staveley-Smith, 2000; Elmegreen, 2002a). The reason is that molecular gas must form out of the cold HI rather than the warm (Glover, 2002). Indeed, Elmegreen (2002b) asserts that star formation must inevitably occur if a cold phase is present. In our own Galaxy there is evidence that the CNM is intimately associated with molecular gas, as the abundance of the CNM peaks in the molecular ring (Dickey et al., 2002). Thus, the amount and distribution of the CNM in dwarf galaxies may reveal something about their star formation potential.
The CNM/WNM phase structure has been studied in many extragalactic systems via the traditional emission/absorption techniques (Dickey & Brinks, 1993; Braun & Walterbos, 1992; Mebold et al., 1997; Dickey, Mebold, Stanimirovic, & Staveley-Smith, 2000). The two phases can also be detected in HI emission spectra by virtue of the fact that they have different velocity dispersions; even when they occur at nearly the same radial velocity, the superposition produces a distinct non-Gaussian line shape with a narrow peak and broad wings. In this way the cold and warm HI phases have been detected in a number of nearby spirals (Braun, 1997) and 500 pc below the plane of our own Galaxy (Lockman, 2002). Braun (1997) shows the spatial distribution of the HI associated with the CNM in nearby spirals. Many high velocity clouds also show evidence for CNM and WNM; clumpy HI with linewidths km s-1 is superposed on more smoothly distributed HI with larger linewidths (Wakker & Schwarz, 1991; de Heij, Braun, & Burton, 2002; Braun & Burton, 2000).
Detailed studies of HI line profiles in the nearby dwarf galaxies Leo A and Sag DIG (Young & Lo, 1996, 1997) (YL96, YL97) show features remarkably similar to Galactic HI profiles. A broad HI component with a dispersion 8–10 km s-1 is ubiquitous in these galaxies. A narrower HI component of 3–5 km s-1 is concentrated into cloud-like structures of size 200–300 pc, located usually (but not always) near regions of star formation activity in Leo A and Sag DIG. Thus, the velocity dispersions and the spatial distributions of the two HI components are exactly analogous to the properties of Galactic WNM and CNM. Sternberg, McKee, & Wolfire (2002) have constructed theoretical models of the ISM in Leo A and Sag DIG, assuming that the gas must be in hydrostatic equilibrium in the galaxies’ gravitational potentials and assuming heating and cooling rates appropriate for their metallicities. These theoretical models predict the coexistence of cold and warm HI phases in the dwarfs, in agreement with our observations. Sternberg et al. have also made novel use of the HI properties of Leo A and Sag DIG to constrain the shape of the dwarfs’ dark matter halos.
The evidence described above suggests that the ISM in nearby dwarf galaxies does indeed contain CNM and WNM phases of HI in accordance with theoretical models. Furthermore, the two phases can be distinguished in HI emission spectra. The CNM is not the raw material for star formation itself but it is commonly assumed to be the raw material from which molecular gas is made. Therefore, we hypothesize that dwarf galaxies which contain greater amounts of CNM should have higher star formation rates, in the same way and for the same reasons that the molecular gas contents of spiral galaxies are positively correlated with their H or far-IR luminosities (Kennicutt, 1998). The primary focus of this paper is to test that hypothesis.
We investigate the properties of the HI gas in four nearby dwarf irregular galaxies through careful study of their HI line profiles. This paper presents the highest quality HI images (best sensitivity and spectral resolution) of DDO 216 (Pegasus dIrr), DDO 210, UGCA 292 (CVn dwarf A), and GR8 (DDO 155). The HI line shapes in three of these dwarfs are parametrized by fitting the profiles with two Gaussian components of different dispersions and also with Gauss-Hermite polynomials. We study the effects of ISM properties on star formation, and the effects of star formation on ISM properties, by comparing the HI line shapes to star formation activity on local (spatially resolved) and global (galaxy vs. galaxy) scales. We also present numerical simulations which quantify the reliability of the double-Gaussian decomposition and the effects of rotational broadening.
2 Sample Selection
Using the line profiles to reveal the properties of the interstellar medium requires, among other things, high signal-to-noise spectra (Appendix A) which are negligibly distorted by beam smearing effects. Beam smearing distorts the shape of the line profile when there is a large velocity gradient within one angular resolution element (Takamiya & Sofue, 2002; Gentile et al., 2002). Thus, we selected nearby HI-bright galaxies with projected rotation velocities comparable to or smaller than 20 km s-1, the intrinsic width of the HI line in dwarf galaxies (Lo, Sargent, & Young, 1993; Hoffman et al., 1996; van Zee et al., 1997a).
In order to gain perspective on the relationship between star formation and the ISM, and to test the hypothesis that more of the CNM would be found in galaxies with higher star formation rates, we also selected galaxies to span a range of H luminosities. The resulting sample includes two galaxies of high star formation rate (GR8, UGCA 292) and two galaxies of low star formation rate (DDO 210, DDO 216). Basic properties of these galaxies are found in Table 1. DDO 216 and DDO 210 are sometimes classified as “transition” systems with optical properties intermediate between those of dwarf irregulars and dwarf spheroidals (Mateo, 1998). Other members of this class include the Antlia dwarf, Phoenix, and LGS 3. UGCA 292 is the most distant member of the sample, and the only one which is not considered a member of the Local Group. Analyses of the recent star formation histories of GR8 and DDO 216 have been carried out by Dohm-Palmer et al. (1998) and Gallagher et al. (1998), respectively. Tolstoy et al. (2000) show a new, deep color-magnitude diagram of DDO 210. Dohm-Palmer et al. (2003) discuss the recent star formation history of UGCA 292.
3 Observations and Data Reduction
3.1 HI data
All four galaxies were observed with the National Radio Astronomy Observatory’s Very Large Array (VLA)111The National Radio Astronomy Observatory is operated by Associated Universities, Inc., under cooperative agreement with the National Science Foundation. in its C and D configurations in 1995 and 1999. These new data offer greatly improved sensitivity over older observations (Lo, Sargent, & Young, 1993; Carignan, Beaulieu, & Freeman, 1990) which were made in the mid-1980s. Table 2 gives specific dates, configurations, and times on source for our new data. Each galaxy was observed in one pointing centered roughly on the optical center of the galaxy. Nearby point sources were observed every 30 to 45 minutes for use as phase calibrators. The absolute flux scale was set by observations of the sources 0137+331 or 1331+305 (whichever was closer to the galaxy in question) and bandpass calibration was determined from those same sources. All data calibration and image formation was done using standard calibration tasks in the AIPS package. Initial imaging revealed which channel ranges were free of HI line emission. Continuum emission was subtracted directly from the raw uv-data by making first order fits to the line-free channels.
The calibrated data were Fourier transformed using several different uvdata weighting schemes chosen to enhance the spatial resolution or the sensitivity to large-scale structures. Dirty images were cleaned down to a residual level of 0.8 to 1.0 times the rms noise fluctuations. Table 3 shows the velocity range covered for each galaxy as well as the linear resolution (FWHM of the synthesized beam) and rms noise level in the final image cubes. All galaxies were observed at 1.3 km s-1 velocity resolution.
To determine if the total flux density was recovered in the HI synthesis observations, total integrated flux profiles were constructed from the lowest resolution HI data cubes using the GIPSY task FLUX. Figure 1 shows integrated HI spectra for all four galaxies. Their integrated HI fluxes, center velocities, and line widths are given in Table 4. In all four cases our integrated HI fluxes are greater than published single dish fluxes. Our HI flux for GR8 is within 10% of that measured by Tift & Cocke (1988), and the difference can be plausibly attributed to noise and/or calibration uncertainties. The single dish HI flux of UGCA 292 was measured by van Zee et al. (1997b) using the wrong coordinates. The velocities of DDO 210 and DDO 216 are so close to zero that confusion with Galactic HI renders single dish HI fluxes highly uncertain. Thus, there is no convincing evidence that our VLA maps have missed very extended distributions. The four sample galaxies span the full range of M(HI)/LB that are known for dwarf galaxies, from the gas-rich UGCA 292 with M(HI)/LB = 7 to the gas-poor DDO 216 with M(HI)/LB = 0.3.
Moment maps of the data cubes are shown in Figures 2 through 5. The moment maps were constructed from blanked cubes, where the signal was identified based on spatial continuity between channels. In order to include even the faint, low signal–to–noise emission, each data cube was smoothed to a resolution of twice the beam prior to automatic clipping at the 2 level. The resultant cubes were then interactively blanked to remove spurious noise spikes. A conditional transfer was applied to blank the corresponding locations in the original data cubes. Moment maps of the blanked cubes were created with the GIPSY task MOMENTS.
3.2 Optical Broadband and H data
Optical images of the four galaxies in this sample were obtained during several observing runs at KPNO.222Kitt Peak National Observatory is part of the National Optical Astronomy Observatories that are operated by the Association of Universities for Research in Astronomy, Inc. under contract to the National Science Foundation. The images for three of the four galaxies in this sample are presented in van Zee (2000); briefly, broad band and narrow band images of DDO 210, DDO 216, and UGCA 292 were obtained with the KPNO 0.9m telescope with the T2KA CCD. The images have a spatial scale of 0.688″ per pixel, and typical seeing of 1.5–2.0″. The optical images of GR 8 used in this paper, kindly provided by J. J. Salzer, were also obtained with the T2KA CCD on the KPNO 0.9m and have similar depth and spatial resolution. Plate solutions for the optical images were derived from coordinates of at least 10 stars listed in the APM catalog333http://www.ast.cam.ac.uk/apmcat/ and are accurate to 0.5″.
As in van Zee (2001), the H luminosities listed in Table 1 were calculated from the observed H flux within large apertures and thus contain H emission from both diffuse and concentrated HII regions. On average, the diffuse emission contributes approximately 50% of the total H emission from dwarf irregular galaxies (Youngblood & Hunter, 1999; van Zee, 2000). Star formation rates were calculated from the H luminosities using the conversion factor from Kennicutt (1998):
| (1) |
The current star formation rates of the galaxies in this sample range from near zero (DDO 210, SFR 0.000003 M⊙ yr-1 and DDO 216, SFR 0.00003 M⊙ yr-1) to a few thousandths of a solar mass per year (UGCA 292, SFR 0.0023 M⊙ yr-1 and GR 8, SFR 0.0040 M⊙ yr-1). In fact, the estimated star formation rates of DDO 210 and DDO 216 are so low that statistical uncertainties in their star formation rates are substantially larger than the measurement uncertainties in the H fluxes of Table 1. In a standard Salpeter initial mass function, only 6% of the total mass in young stars (0.1 to 100 ) occurs in stars of mass greater than 25 . The star formation rates of DDO 210 and DDO 216 are small enough that only one or less than one HII region might be expected to be present at any time, with the corresponding problems of small number statistics. Gallagher et al. (1998) also find that the star formation rate averaged over the last 100 Myr in DDO 216 may be a factor of a few higher than the current rate derived from the H luminosity.
4 Results
4.1 HI distributions
Figures 2 through 5 show HI distributions, overlays on optical images, and velocity fields of the four galaxies. As illustrated by these overlays, the new data cubes are significantly deeper than the data published in Lo, Sargent, & Young (1993); in particular, the new observations of DDO 210 and DDO 216 indicate HI extents larger than those shown in Lo, Sargent, & Young (1993). The HI image of GR 8 is similar to that presented in Carignan, Beaulieu, & Freeman (1990), although the present data have higher velocity resolution and are slightly deeper.
At first glance, the HI distributions appear very similar to the neutral gas distribution in other dwarf irregular galaxies (Broeils & van Woerden, 1994; Broeils & Rhee, 1997; van Zee et al., 1997b; Swaters et al., 2002). In each case, the HI extends well beyond the optical image (excluding possible faint stellar halos). The HI–to–optical ratio (measured at the 1020 atoms cm-2 and 25 mag arcsec-2 isophotes, respectively) is 2.3 for GR 8, 2.5 for UGCA 292, 2.1 for DDO 210, and 1.6 for DDO 216. The peak column densities are also typical of dIs, reaching 1.3 1021 atoms cm-2 in GR 8 and DDO 210, 3.7 1021 atoms cm-2 in UGCA 292, and only 9.2 1020 atoms cm-2 in DDO 216 in the HI maps with approximately 200 pc spatial resolution. The central column density in UGCA 292 is similar to those found in BCDs (van Zee, Skillman, & Salzer, 1998; van Zee, 2001), while GR 8, DDO 210, and DDO 216 have peak column densities similar to typical dIs (van Zee et al., 1997b).
The high spatial resolution images (lower left panel of Figures 2 - 5) indicate a rough correspondence between column density peaks and sites of active star formation, including the faint HII knot in DDO 210 (see van Zee et al. (1997a) for a spectrum of this enigmatic HII region). As discussed in more detail below for the cold neutral phase, a high column density appears to be a necessary, but not sufficient, condition for star formation activity.
4.2 HI kinematics
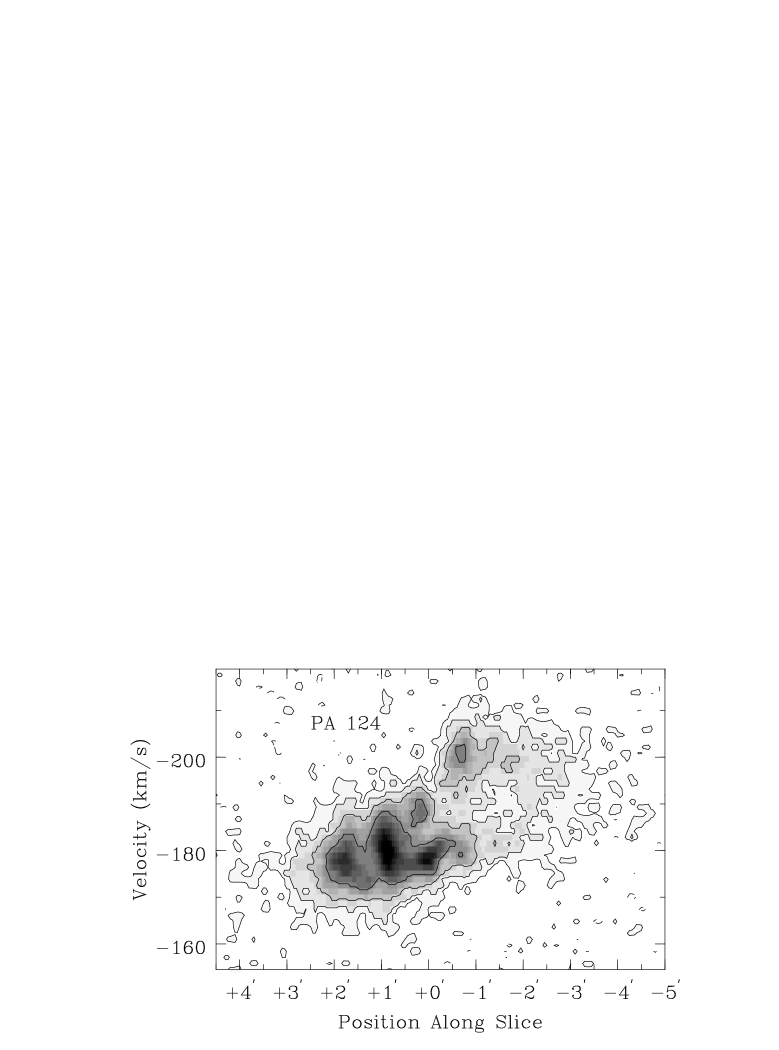
While the gas distributions in these four galaxies appear to be typical of dIs, the gas kinematics of DDO 216 and GR 8 are somewhat unusual. All four of these galaxies are at the low mass end of the gas–rich dwarf irregular class, and thus one expects the rotational component to be comparable to the velocity dispersion. In DDO 210 and UGCA 292, a clear velocity gradient is visible in both the data cubes and in the derived velocity fields (see lower right panel of Figures 2 and 4). The inclination corrected amplitudes of these velocity gradients are small, 0.31 km s-1 per arcsec and 0.10 km s-1 per arcsec for UGCA 292 ( = 45°) and DDO 210 ( = 60°), respectively, but are non-negligible. Velocity gradients are also present in the velocity fields of GR 8 and DDO 216 (Figures 3 and 5). However, the gas kinematics are not as well ordered in these two galaxies; rather than a smooth velocity gradient from one side to the other, DDO 216 and GR 8 appear to have clumps of gas with similar kinematic properties (2 distinct clumps in DDO 216 and 3 clumps in GR 8). In GR8, the three clumps can be identified in the HI column density images, and in DDO 216 they can be seen in a major axis position-velocity diagram (Figure 6) at km s-1 and at km s-1. The gas kinematics appear well ordered within each clump, and there is an overall kinematic profile along the optical major axis of both of these galaxies. Nonetheless, the overall impression is of random gas motions rather than a rotating disk in DDO 216 and GR 8.
In these low mass galaxies, the kinematic motions may be complicated by expanding shells and bubbles, which obscure the global dynamics. For example, in the position-velocity diagram of Figure 6 a circular structure centered at km s-1 and (1.5′ northwest of the center) may be evidence for an expanding HI bubble of radius 1′ (200 pc) and expansion velocity 10 km s-1. The dynamical age of such a structure would be 2 yr, but it is curious that there is very little star formation activity of this vintage in the galaxy (van Zee, 2000; Gallagher et al., 1998).
4.3 Line shapes and velocity dispersions
Because the line profiles in DDO 216 are double-peaked throughout much of the galaxy (Figure 6), we do not attempt a detailed analysis of the velocity dispersion or profile shapes in that galaxy. But among the other three galaxies we find the usual variety of line shapes, including some which are well described by single Gaussian components and others which are not. Example spectra are shown in Figures 7, 8, and 9. Deviations from pure Gaussian shapes take the form of broader wings and a narrower peak than a simple Gaussian, and sometimes asymmetry, just as has been found for other dwarf galaxies (YL96, YL97) as well as nearby spirals (Braun, 1997).
All spectra in these galaxies were fit with a single Gaussian component. Profiles were also fit with a superposition of two Gaussians of different dispersions, as was done in YL96 and YL97. In addition, we fit the HI profiles with Gauss-Hermite polynomials, which are commonly used for parametrizing the line-of-sight velocity distributions of elliptical galaxies. The Gauss-Hermite polynomials (up to fourth order) are
where (van der Marel & Franx, 1993). These functions are essentially Gaussian terms modified by an asymmetric bit whose amplitude is indicated by and a symmetric bit whose amplitude is . In the case that the function is a Gaussian of amplitude , center , and dispersion . If the profile is asymmetric, and if it has either a more pointed () or a more flat () top than a Gaussian. This parametrization is a useful alternative to the double-Gaussian decomposition because the and polynomials are orthogonal, so that errors in those parameters are uncorrelated (van der Marel & Franx (1993), Appendix A). In contrast, when two superposed Gaussian components are fit simultaneously, their parameters are highly correlated. The disadvantage of the Gauss-Hermite formulation is that there is no simple physical interpretation of the magnitudes of and , whereas two superposed Gaussians can be naturally interpreted in terms of gas of different velocity dispersions and/or radial velocities. All line profile fits were made using the XGAUFIT task in GIPSY.
The procedure used to distinguish profiles which are simple Gaussians from those that are not is described in YL96 and YL97. Briefly, our null hypothesis is that a simple Gaussian function is an equally good description of the profile as two Gaussians or the Gauss-Hermite functions with terms up to . The rms of the residuals is computed for all three fits over the velocity range of the line emission (roughly the central 40 of 120 channels). We divide the rms of the residuals to a single Gaussian fit by the rms of the residuals to a double Gaussian fit or a Gauss-Hermite fit. We reject the null hypothesis at the 90% confidence level in a one-tailed f-test when the ratio of the rms’s is 1.27 and at the 95% confidence level when the ratio of the rms’s is 1.36, for 30 degrees of freedom.
4.3.1 Gauss-Hermite analysis
Figures 10, 11, 12, 13, 14, and 15 indicate where the Gauss-Hermite fits show significant deviations from Gaussian line profiles. In DDO 210 (Figure 15), a large fraction of the profiles have positive values indicating broader wings and a narrower peak than a simple Gaussian. Very few of the profiles in DDO 210 show asymmetries (nonzero ; Figure 14).
The three prominent HI clouds of GR8 each contain young massive stars and H emission; the stellar content of these regions is described by Dohm-Palmer et al. (1998). The southwestern clump contains the highest concentration of massive main sequence stars and is therefore interpreted as the youngest region of star formation activity in the galaxy. This HI clump shows asymmetric profiles with (Figures 10 and 11), but only in the southern half of the clump near the star formation activity. The eastern HI clump has the highest concentration of blue helium-burning stars, which are somewhat older and less massive than main sequence stars of comparable luminosity. This clump shows remarkably few departures from Gaussian profile shape. The northern HI clump has the smallest massive star content, and it is interpreted as the oldest of the three regions of recent star formation activity. Line profiles throughout this entire HI clump have high degrees of asymmetry (the highest values measured in the entire sample) and .
In UGCA 292 (Figure 12) we also find a large incidence of asymmetric profiles, in the western part of the galaxy and in the southeast. In between those two regions of asymmetric profiles, and coincident with the most luminous HII region in the galaxy, we find profiles which are indistinguishable from pure Gaussians (Figure 7). These simple Gaussian profiles have higher dispersions, 10–11 km s-1, than are found elsewhere in the galaxy (7.5–9.5 km s-1). Some regions of are found, generally offset by one beamwidth (300 pc) from HII regions (Figure 13).
UGCA 292 is the galaxy in this sample with the largest rotational velocity, and if beam smearing were important it would be expected to cause an antisymmetric pattern similar to the observed one with on one side of the galaxy and on the other. Therefore, we conducted experiments to determine the magnitude of beam smearing effects in this galaxy. The simulations described in Appendix B indicate that values of and no larger than 0.01 would be expected from beam smearing effects alone in this galaxy, whereas the observed and are up to 0.1. Furthermore, if the pattern in this galaxy were caused by beam smearing we would expect the line between and to lie along the kinematic major axis at position angle +60° (Figure 2). Instead, that line lies 50° away at position angle +110°. Thus, we believe the measured and values (and subsequent double-Gaussian decomposition) are indicative of local conditions in the gas rather than beam smearing.
4.3.2 Double-Gaussian decomposition
Figures 16, 17, and 18 show the fitted dispersions in the three galaxies. For profiles which are adequately described by a single Gaussian, that best-fit dispersion is plotted; for profiles which require two components at greater than 90% confidence, the two dispersions are plotted independently. In the double-Gaussian profiles, the narrower components have dispersions typically 3–6 km s-1 and the broader ones are typically 8–13 km s-1. As in the cases of Leo A and Sag DIG, we find the notable result that the profiles which require only one Gaussian component have dispersions very similar to the broader component of the double-Gaussian profiles. Thus, we again find a component of HI of dispersion 10 km s-1everywhere throughout these galaxies. In certain locations we also find an additional HI component of dispersion 3–5 km s-1. We interpret these results to mean that the HI in these galaxies contains a ubiquitous high-dispersion phase, which we identify with the WNM, and a clumpy low-dispersion phase, which we identify with the CNM.
Comparison of Figures 16, 17, and 18 suggests that both the high-dispersion and low-dispersion phases in DDO 210 have dispersions lower by 1–2 km s-1 than their counterpart phases in the other two galaxies.
Figures 19, 20, and 21 show the spatial distribution of the low dispersion component (CNM) with respect to the total HI column density and H emission. From these figures it is apparent that the set of profiles in which we find the low dispersion component is almost identical to the set of profiles with . Specifically, the distribution of the low-dispersion component in GR8 (Figure 19) is qualitatively similar to the image of nonzero in Figure 11, Figure 21 is similar to Figure 15, and Figure 20 is similar to Figure 13. The two techniques for describing deviations from simple Gaussian shapes give very similar results on where the CNM is located.
5 Discussion
5.1 Line shapes and star formation: small scale correlations
We find some correspondence between the presence of the CNM and star formation activity. Specifically, all regions of H emission in these three galaxies are found within about one beamwidth or less of profiles containing the low dispersion component (or having ). In the case of the eastern HI clump of GR8 and its ringlike HII region, the number of such profiles is small but nonzero. In the case of UGCA 292 we find the largest spatial offsets, 300 pc, between current star formation activity and evidence of the CNM. But it is generally true that for these galaxies and for the previously studied Leo A and Sag DIG (YL96, YL97), some evidence of CNM is always near to current star formation activity.
The reverse of the previous statement is most definitely not true, however. There is not always evidence of star formation activity near to regions containing the CNM. The most dramatic example is DDO 210, where H imaging revealed very minimal star formation activity (Table 1; van Zee (2000)) and the color-magnitude diagram also indicates a very weakly populated upper main sequence (Tolstoy et al., 2000). But DDO 210 contains ample amounts of the CNM, as indicated in Figures 15 and 21. Other examples include the eastern portion of GR8 near RA = 12 58 42.0 (Figures 11 and 19), the northwestern quadrant of Leo A (Figure 9 of YL96), and the western half of Sag DIG (Figure 9 of YL97).
In UGCA 292, the regions of star formation activity are all near (within about one beamwidth) of asymmetric HI profiles (Figure 12). In GR8, the regions of star formation activity are all spatially coincident with asymmetric HI profiles, with the possible exception of the eastern HI clump and its ring HII region (Figure 10). In these two galaxies we find a rather close correspondence between asymmetric profiles and star formation activity. Two regions near the outer edges of DDO 210 show asymmetric profiles in places where there is no evidence of current star formation activity (Figure 14). However, in the aggregate, the evidence for small scale correlations between asymmetric profiles () and star formation activity is at least as good as, and perhaps better than, the evidence for small scale correlations between and star formation.
We do not see strong evidence of a temporal evolution in the state of the ISM. As noted in section 4.3.1, the three regions of star formation activity in GR8 have been approximately dated by their massive stellar content (Dohm-Palmer et al., 1998), and we do not see a one-to-one relationship between the stellar content and either the presence of CNM or the presence of asymmetric profiles. As stars are born and die there most certainly will be some evolution of the state of the ISM, but detecting it may require a larger dataset or one which probes different spatial and temporal scales.
5.2 Line shapes and star formation: Global correlations
We estimate, for each galaxy, the fraction of profiles that show deviations from pure Gaussian shapes. The parameters and (Table 5) are the number of profiles for which a nonzero or are detected at greater than confidence, divided by the number of profiles in the galaxy with signal-to-noise ratio greater than 20. The normalization is an attempt to account for differences in the overall signal-to-noise ratio of the cubes and the numbers of pixels per independent beam. For UGCA 292 and DDO 210, virtually all of the profiles with nonzero or have signal-to-noise ratios greater than 20, and and are less than one. However, note that strong and signatures can be detected even when the profile has a total signal-to-noise ratio less than 20 (Table 6), so that and are not constrained to be less than one. This effect is responsible for the large and in GR8.
Our data show a notable trend between a galaxy’s H luminosity and the fraction of the profiles which are asymmetric. For this analysis we have also included Leo A and Sag DIG, which we fitted with Gauss-Hermite polynomials in exactly the same manner as described above. Table 5 indicates, for each galaxy, the number of spectra with signal-to-noise ratios greater than 20, the fraction of spectra with significant measurements of nonzero and , and the H luminosities. The data are plotted in Figures 22 and 23, where it is clear that the galaxies with larger H luminosities have a greater fraction of their profiles asymmetric. In contrast, there is little correspondence between the fraction of the profiles that show evidence for CNM () and the H luminosity.
A galaxy-wide relation between the H luminosity and the fraction of profiles that show asymmetries could naturally arise if the young massive stars are injecting kinetic energy into the ISM. A young massive star located exactly in the midplane of a homogeneous gas disk might be expected to accelerate the surrounding gas in a symmetric manner, but stars outside of the midplane of real galaxies with inhomogeneous interstellar media will be more likely to accelerate the surrounding gas more strongly in some directions than in others. The result will be an asymmetric HI velocity profile.
The fits to the spectrum in Figure 9 show that one can decompose these asymmetric profiles into components typically separated by a few km s-1. We can thus obtain an order-of-magnitude estimate of the kinetic energy represented by the asymmetric profiles of GR8, for example. If something like one third of the HI in GR8 is accelerated to velocities of 5 km s-1 with respect to the rest of the gas in the galaxy, that would require 8 erg of kinetic energy. This value is a small fraction of the total thermal and/or turbulent energy in the HI gas, since most of the HI in the galaxy has a velocity dispersion between 8 and 13 km s-1 (Figure 17). Assuming the energy input from supernovae and/or stellar winds is converted into kinetic energy of the ISM at an efficiency of 10% (Lozinskaya, 1992), we require 1052 erg of input energy, or a few canonical supernovae, to explain the asymmetric HI profiles. Given that we know massive star formation is now occurring in GR8, the energy requirements are not unreasonable. The interpretation that the asymmetric HI profiles are the result of kinetic energy input from young massive stars is plausible in this respect.
The small number of asymmetric profiles in DDO 210 can also be easily understood, given the extremely low rate of massive star formation activity. Mac Low (1999, 2002) estimates the timescale for dissipation of turbulent kinetic energy in the ISM to be on the order of 10 Myr. Thus, we expect the signatures of kinetic energy injection () to disappear very shortly after the massive stars and their HII regions disappear. Furthermore, we speculate that one might directly infer the size scales on which turbulent kinetic energy is injected into the ISM from the size scales of contiguous regions with similar values. In the present set of galaxies, those size scales are usually comparable to or smaller than our HI beam sizes (100–300 pc, Table 3).
This interpretation that the asymmetric profiles trace energy injection from young massive stars has relied on the use of H to trace the star formation rate, as usual. Section 3.2 mentions, however, that the star formation rate of DDO 210 in particular is so low that the H emission may not be a particularly accurate indicator of the total star formation activity. But to the extent that the most massive stars are the primary sources of kinetic energy input into the ISM, and their lifetimes are comparable to the 10 Myr timescale for dissipation of turbulent kinetic energy as mentioned above, the H emission of these galaxies is an indicator of the instantaneous energy injection rate. These considerations justify the use of H luminosities in Figure 22. In an analysis of CNM as a raw material for star formation activity (Figure 23), we would indeed be more interested in the total star formation rate rather than just the massive star formation rate. But the qualitative result coming out of Figure 23, a lack of correlation between H luminosity and CNM content, would not be noticeably affected even if DDO 210 were shifted by a factor of 10 in the horizontal direction relative to the other galaxies.
5.3 Star formation and the CNM
It has sometimes been suggested that the broad (but symmetric) wings of non-Gaussian profiles — the shape — are caused by star formation activity stirring the gas (Dickey, Hanson, & Helou, 1990). That doesn’t appear to be the case in these dwarf galaxies. For example, Young & Lo (1996, 1997) showed that the HI velocity dispersions in Leo A and Sag DIG actually decrease in the regions of , rather than increase. This result is contrary to what one would expect if the broad wings were due to extra kinetic energy. Furthermore, we now have the very dramatic example of the many profiles in DDO 210 with even though there is little or no current star formation activity. In this respect the ISM of DDO 210 is reminiscent of the ISM in high velocity clouds (Wakker & Schwarz, 1991; Braun & Burton, 2000; de Heij, Braun, & Burton, 2002).
Rather, the evidence we have presented above suggests that the asymmetric profiles () are the result of star formation activity, whereas the narrow Gaussian component and its corresponding signature are due to the presence of the CNM. (Technically speaking, the measured velocity dispersions of the narrow Gaussian component do not require it to be at temperatures 100 K. A dispersion of 5 km s-1 would, if it were entirely thermal, correspond to a temperature of 3000 K and place the gas in the thermally unstable region of the phase diagram. We would then expect the formation of cold gas from the unstable gas, and in addition there may be nonthermal gas motions within our beam.) However, it is clear that the presence of CNM does not automatically lead to star formation. The presence of CNM seems to be a necessary condition for star formation– all regions of star formation activity have some CNM close by– but the CNM is clearly not a sufficient condition for star formation.
Lo, Sargent, & Young (1993) discussed the HI properties of nine dwarf irregular and transition dwarf galaxies, paying particular attention to the issue of their gas contents and star formation rates. They argued that it is difficult to understand the low star formation rates (both current and averaged over a Hubble time) in the faint dwarfs which have low degrees of rotational support. The present paper takes this argument one step further. One possible reason for the low star formation rates is that only the CNM in these galaxies, not the WNM, should be considered possible raw material for star formation. In Leo A and Sag DIG (YL96, YL97) we found that only 20% or so of the HI is CNM. But for DDO 210, the mystery of the low star formation rate remains. As far as we can determine without actually detecting molecular gas, the conditions in the ISM of this galaxy seem favorable for the formation of stars. Perhaps there is a significant time delay between the formation of the CNM and the formation of the molecular gas– or whatever else is the remaining necessary ingredient for star formation.
The quantitative relationships between star formation activity and the CNM are also probably complicated by the fact that energy injection into the ISM may eventually destroy the CNM. Such negative feedback may be responsible for the fact that most of the CNM in Figures 19 through 21 tends not to be located directly on top of the HII regions. This kind of negative feedback may also contribute to a lack of correlation between the global CNM content of the galaxy and the H luminosity. If the CNM is destroyed by energy injection it will probably become WNM, and indeed in this respect it is significant that the models of Sternberg, McKee, & Wolfire (2002) actually require some star formation activity in order to produce WNM in the interiors of dwarf galaxies. In other words, the interstellar pressures in the interiors of the model galaxies are high enough to drive all HI into the CNM phase in the absence of some energy injection.
5.4 Constraints on dark matter halos
The theoretical analyses of Sternberg, McKee, & Wolfire (2002) incorporate radiative transfer, thermal, and ionization balance to model hydrogen gas in hydrostatic equilibrium in the gravitational potential of a small dwarf galaxy. The model galaxy contains both stars and dark matter appropriate for the Local Group dwarfs Leo A and Sag DIG, and the gas is heated and photoionized by an external radiation field. Models with either constant density dark matter cores or highly underconcentrated NFW halos produce WNM column densities and projected HI scale heights which agree with the observed properties of Leo A and Sag DIG.
UGCA 292, GR8, and DDO 210 are broadly similar to Leo A and Sag DIG, so that all the conclusions which Sternberg et al. have made about their dark matter halos are echoed by this new set of galaxies. For example, the constant density core model favored by Sternberg et al. has a peak WNM column density of 1.4 ; for DDO 210, GR8, and UGCA 292 we find peak WNM column densities of 1.0, 1.2, and 3.4 respectively. The higher column densities in UGCA 292 may simply be projection effects. The model has a scale height in the projected HI column density of 0.6 kpc; we find HI scale heights of 500 pc for GR8, 600 pc for UGCA 292, and 240 pc for DDO 210. (These HI scale heights are measured as the geometric mean of the major and minor axes at the contour in the HI column density.) Thus, our new HI observations of DDO 210, GR8, and UGCA 292 show that they also require either halos with constant density cores or underconcentrated cuspy halos. The constraints may be less strong for DDO 210 than for the others, since DDO 210 is somewhat smaller in luminous mass and its HI scale heights are only half as large. The implications of these “soft cores” for the nature of dark matter are still being discussed (e.g. D’Onghia & Burkert (2003) and others).
6 Summary
We present the highest sensitivity images of HI emission from the dwarf irregular galaxies UGCA 292 and GR8 and from the transition dwarfs DDO 210 and DDO 216. The HI of DDO 216 is clearly resolved into two partially overlapping gas clouds which are separated by about 20 km s-1 in velocity. Many of the HI profiles in that galaxy are double-peaked.
We have analyzed the HI line profile widths and shapes in DDO 210, GR8, and UGCA 292 by fitting with Gaussians and Gauss-Hermite polynomials. Our double-Gaussian decomposition indicates that a HI component of dispersion 9–12 km s-1 is present everywhere in these three galaxies, and in some locations a second component of dispersion 3–5 km s-1 is also present. We also map out the locations of asymmetric HI profiles, indicated by in the Gauss-Hermite fits. The two fitting techniques give consistent answers: line profiles which require two Gaussians, one broad and one narrow, are also well described by . We interpret the presence of the narrow Gaussian component () as evidence for the CNM. Of the six dwarf galaxies which have been studied in this way, five show evidence for the CNM.
We have estimated the effects of rotational broadening (finite angular resolution) on the line profiles of these galaxies. Even for the galaxy with the largest velocity gradient (UGCA 292), the rotationally-induced deviations from simple Gaussian line shapes are much smaller than the deviations which are actually observed.
If the CNM is indeed the site of molecular gas formation and a necessary ingredient for star formation, one might expect a correlation between the quantity of CNM in a galaxy and its star formation rate. We estimated the amount of CNM in a galaxy by noting the fraction of profiles with . There is no apparent relation between that fraction and the H luminosity of five dwarfs spanning more than three orders of magnitude in . The most striking cases are DDO 210, where we find a large incidence of CNM but very little star formation, and UGCA 292, where we find a relatively small incidence of CNM but a large star formation rate. The CNM may indeed be a necessary ingredient for star formation but it is clearly not sufficient by itself to ensure star formation.
There is a trend between the fraction of asymmetric profiles in a galaxy and , in the sense that galaxies with greater star formation rates also have a greater fraction of asymmetric profiles. This result probably indicates that star formation activity is responsible for stirring the HI, and the kinetic energy involved in accelerating the HI to typical speeds of 5 km s-1 is reasonable for galaxies with these kinds of star formation rates. Small scale correlations between the locations of HII regions and the regions of asymmetric profiles are less clear: in some cases the asymmetric profiles are coincident with the HII regions, and in other cases the asymmetric profiles appear around the edges of the HII regions.
The three main star formation regions of GR8 have been approximately dated from their young stellar contents. We do not see a clear evolutionary sequence in the properties of the ISM in these three star formation regions. A detection of this kind of temporal evolution may require larger sample sizes which probe different spatial and/or temporal scales than what we are able to do in the present work.
Appendix A Line shape measurements at low signal-to-noise ratios
A proper understanding of the uncertainties in the fitted spectral line parameters is crucial to the interpretation of most of the results in this paper. Therefore, we undertook a series of Monte Carlo simulations which were designed to show (1) the reliability of the spectral line shape parameters for profiles of low signal-to-noise ratio, and (2) the degree of correlation between the fitted parameters.
We first constructed data cubes consisting of identical model spectra with 1.3 km s-1 velocity resolution. The line profiles were prescribed by the Gauss-Hermite formula given in Section 4.3 with km s-1, , and , values typical for the observed galaxies. Random, normally distributed noise was added to the simulated spectra in order to achieve a specified signal-to-noise ratio. For this work, signal-to-noise ratios are defined as the peak intensity of the line divided by the rms noise level. In this manner we constructed 16800 spectra at each of the signal-to-noise ratios specified in Table 6. The procedure was repeated for sets of profiles with the same signal-to-noise ratios, , and but with . All profiles were fit with the Gauss-Hermite polynomials.
Table 6 gives the fitted values of , , and their standard deviations as a function of signal-to-noise ratio. For signal-to-noise ratios of 7 and higher, the fitted and are normally distributed with standard deviations equal to the formal uncertainty reported by the fitting routine. At signal-to-noise ratios less than 7, the fitted and are no longer normally distributed. Therefore we conclude that for signal-to-noise ratios , the formal uncertainties in the fitted and are reliable estimates of their errors. We also find very convincing evidence that the and parameters are indeed independent of each other. Specifically, we find no correlation between the fitted and the fitted of a given profile. The fitted values are also the same, within their errors, regardless of whether or not the term is included in the fit. Finally, the fitted and the standard deviations in and were identical for the cases and .
Simulations of the double-Gaussian fitting procedure were made in a similar way. We constructed data cubes of 4225 spectra each and 1.3 km s-1 velocity resolution; each spectrum was filled with a superposition of two Gaussian components of 4 km s-1 and 11 km s-1 dispersions. The amplitude ratio of the two components was fixed at 1.4:1 (narrow:broad). Random noise was added to the spectra to achieve total signal-to-noise ratios of 30, 20, and 11, which is the range of signal-to-noise ratios occupied by the non-Gaussian profiles in GR8. In one set of data cubes the two components have the same velocity, and in a parallel set of data cubes they have velocities offset by 5 km s-1. The spectra were then fit with a superposition of two Gaussian components.
The fitted amplitudes, center velocities, and dispersions of the two Gaussian components along with their standard deviations are presented in Table 7. As for the Gauss-Hermite fits, we find that the standard deviations in the fitted parameters are equal to the formal errors quoted by our fitting routine. We conclude that the formal errors are indeed reliable measures of the uncertainties in the parameters (at least at the signal-to-noise ratios studied here). We also note that at signal-to-noise ratios of 11, a 5 km s-1 velocity offset between the two components is not detectable at a 3 confidence level. However, at signal-to-noise ratios of 20 and above this velocity offset is easily measured.
Finally, we find that the fitted amplitudes of the two Gaussian components are strongly correlated in the sense constant. The standard deviations in the fitted amplitudes are primarily determined by this correlation. As a result, the standard deviations of the fitted amplitudes do not decrease as the signal-to-noise ratio increases; rather, they are fixed at about 1.4 times the rms noise level. The situation is mildly improved for asymmetric profiles, in which cases the standard deviations in the fitted amplitudes are in the range 1.0 to 1.2 times the rms noise. The last column of Table 7 shows that the standard deviations in the column densities of the two Gaussian components range from 10% to about 40%. We would expect uncertainties in the column densities to be larger in cases where the amplitude ratio is more extreme.
Appendix B Rotational broadening
When an object with a velocity gradient is observed at finite angular resolution, its spectral line profiles appear artificially broadened. The line profiles can also be asymmetric, which is responsible for the fact that different rotation curves for galaxies are obtained from the peak of the spectra, the median, and the mean velocity (Takamiya & Sofue, 2002; Gentile et al., 2002). Therefore, we conducted simple numerical experiments to determine whether the values of and which we observe in the HI of dwarf galaxies could be artifacts of their velocity gradients.
In our present sample the largest velocity gradient is in UGCA 292, where we find 0.2 or 2.9 km s-1 per beam in the high resolution cube and 3.5 km s-1 per beam in the low resolution cube. The GIPSY task GALMOD was used to simulate observations of galaxies with various velocity fields and gas distributions, including the following:
-
•
velocity gradients ranging from 0.3 to 1.2
-
•
velocity fields which are solid body throughout and ones which rise linearly to a radius of about 60″ and flatten
-
•
uniform gas distributions as well as those that drop off by about a factor of 20 between the center and the outside edge at 100″
-
•
intrinsic velocity dispersions between 0.1 km s-1 and 10 km s-1. In the absence of beam smearing, all HI spectra would be simple Gaussians of this dispersion.
All model galaxies were “observed” at 1.3 km s-1 velocity resolution and were smoothed to 14″ linear resolution, similar to the high resolution cube of UGCA 292.
The synthetic spectra were fit with the Gauss-Hermite polynomials, which gave the following results. Models which closely approximate the parameters for UGCA 292 (0.3 velocity gradient, intrinsic velocity dispersion 10 km s-1) showed no significant or . All of the fitted and values were less than 0.01 and most were consistent with zero, within their uncertainties. In comparison, in the real galaxies the well-measured and are between 0.05 and 0.25. Synthetic galaxies did not have artificial and values as large as the ones found in the real galaxies unless the ratio of the velocity gradient to the intrinsic velocity dispersion was more than 10 times larger than what is found in the real galaxies. We conclude that the beam smearing which is present in the real galaxies is not large enough to explain the observed departures from simple Gaussian profiles. Rather, these departures must be indicative of local conditions in the ISM.
The velocity gradients which are present in the real galaxies also make very minor contributions to the observed line widths. The fitted dispersions of the synthetic galaxies are roughly consistent with the expectation where is the observed line profile width, is the intrinsic line width, and is the product of the velocity gradient and the beam size (Braun, 1997). In UGCA 292, the velocity gradient amounts to about 3 km s-1 per beam; the observed line widths (FWHM) are 12 km s-1 for the narrow component and 23 km s-1 for the broad component. Thus, the beam smearing of the velocity gradient contributes at most a few percent to the observed line widths. In this paper we therefore consider that significant changes in the line shape or width from one place to another must be indicative of changing conditions in the ISM, not global effects connected with the velocity gradient.
References
- Braun (1997) Braun, R. 1997, ApJ, 484, 637
- Braun & Burton (2000) Braun, R. & Burton, W. B. 2000, A&A, 354, 853
- Braun & Walterbos (1992) Braun, R. & Walterbos, R. A. M. 1992, ApJ, 386, 120
- Broeils & Rhee (1997) Broeils, A. H., & Rhee, M.–H. 1997, A&A, 324, 877
- Broeils & van Woerden (1994) Broeils, A. H., & van Woerden, H. 1994, A&AS, 107, 129
- Carignan, Beaulieu, & Freeman (1990) Carignan, C., Beaulieu, S., & Freeman, K. C. 1990, AJ, 99, 178
- Clark (1965) Clark, B. G. 1965, ApJ, 142, 1398
- Cook (1988) Cook, K. H. 1988, BAAS, 20, 743
- de Heij, Braun, & Burton (2002) de Heij, V., Braun, R., & Burton, W. B. 2002, A&A, 391, 67
- Dickey & Brinks (1993) Dickey, J. M. & Brinks, E. 1993, ApJ, 405, 153
- Dickey, Hanson, & Helou (1990) Dickey, J. M., Hanson, M. M., & Helou, G. 1990, ApJ, 352, 522
- Dickey et al. (2002) Dickey, J. M., McClure-Griffiths, N. M., Gaensler, B. M., & Green, A. J. 2002, ApJ, in press (astro-ph/0211298)
- Dickey, Mebold, Stanimirovic, & Staveley-Smith (2000) Dickey, J. M., Mebold, U., Stanimirovic, S., & Staveley-Smith, L. 2000, ApJ, 536, 756
- Dohm-Palmer et al. (1998) Dohm-Palmer, R. C. et al. 1998, AJ, 116, 1227
- Dohm-Palmer et al. (2003) Dohm-Palmer, R. C., van Zee, L., & Young, L. 2003, in prep.
- Dolphin et al. (2002) Dolphin, A. E. et al. 2002, AJ, 123, 3154
- D’Onghia & Burkert (2003) D’Onghia, E. & Burkert, A. 2003, ApJ, 586, 12
- Elmegreen (2002a) Elmegreen, B. G. 2002, ApJ, 577, 206
- Elmegreen (2002b) Elmegreen, B. G. 2002, in The Third EuroConference on the Evolution of Galaxies, eds. G. Stasinka, G. Hensler, et al. (Dordrecht: Kluwer), in press (astro-ph/0212166)
- Elmegreen & Parravano (1994) Elmegreen, B. G. & Parravano, A. 1994, ApJ, 435, L121
- Gallagher et al. (1998) Gallagher, J. S., Tolstoy, E., Dohm-Palmer, R. C., Skillman, E. D., Cole, A. A., Hoessel, J. G., Saha, A., & Mateo, M. 1998, AJ, 115, 1869
- Gazol, Vázquez-Semadeni, Sánchez-Salcedo, & Scalo (2001) Gazol, A., Vázquez-Semadeni, E., Sánchez-Salcedo, F. J., & Scalo, J. 2001, ApJ, 557, L121
- Gentile et al. (2002) Gentile, G., Vergani, D., Salucci, P., Kalberla, P., & Klein, U. 2002, in ALMA Extragalactic and Cosmology Science Workshop on Dark Matter (astro-ph/0206477)
- Glover (2002) Glover, S. C. O. 2002, ApJ, in press (astro-ph/0210493)
- Heiles & Troland (2002) Heiles, C., & Troland, T. 2002, ApJ, in press (astro-ph/0207105)
- Hoffman et al. (1996) Hoffman, G. L., Salpeter, E. E., Farhat, B., Roos, T., Williams, H., & Helou, G. 1996, ApJS, 105, 269
- Kennicutt (1998) Kennicutt, R. C. 1998, ARA&A, 36, 189
- Kritsuk & Norman (2002) Kritsuk, A. G. & Norman, M. L. 2002, ApJ, 569, L127
- Kulkarni & Heiles (1988) Kulkarni, S. R. & Heiles, C. 1988, Galactic and Extragalactic Radio Astronomy, 95
- Lee et al. (1999) Lee, M. G., Aparicio, A., Tikonov, N., Byun, Y., & Kim, E. 1999, AJ, 118, 853
- Lo, Sargent, & Young (1993) Lo, K. Y., Sargent, W. L. W., & Young, K. 1993, AJ, 106, 507
- Lockman (2002) Lockman, F. J. 2002, ApJ, in press (astro-ph/0210424)
- Longmore et al. (1978) Longmore, A. J., Hawarden, T. G., Webster, B. L., Goss, W. M., & Mebold, U. 1978, MNRAS, 183, 97
- Lozinskaya (1992) Lozinskaya, T. A. 1992, New York: American Institute of Physics, 1992,
- Mac Low (1999) Mac Low, M. 1999, ApJ, 524, 169
- Mac Low (2002) Mac Low, M. 2002, in press (astro-ph/0211616)
- Mateo (1998) Mateo, M. L. 1998, ARA&A, 36, 435
- Mebold et al. (1997) Mebold, U., Duesterberg, C., Dickey, J. M., Staveley-Smith, L., & Kalberla, P. 1997, ApJ, 490, L65
- Parravano (1989) Parravano, A. 1989, ApJ, 347, 812
- Parravano (1988) Parravano, A. 1988, A&A, 205, 71
- Radhakrishnan, Murray, Lockhart, & Whittle (1972) Radhakrishnan, V., Murray, J. D., Lockhart, P., & Whittle, R. P. J. 1972, ApJS, 24, 15
- Sternberg, McKee, & Wolfire (2002) Sternberg, A., McKee, C. F., & Wolfire, M. G. 2002, ApJS, in press (astro-ph/0207040)
- Stetson, Hesser, & Smecker-Hane (1998) Stetson, P. B., Hesser, J. E., & Smecker-Hane, T. A. 1998, PASP, 110, 533
- Strobel, Hodge, & Kennicutt (1991) Strobel, N. V., Hodge, P., & Kennicutt, R. C. 1991, ApJ, 383, 148
- Swaters et al. (2002) Swaters, R. A., van Albada, T. S., van der Hulst, J. M., & Sancisi, R. 2002, A&A, 390, 829
- Takamiya & Sofue (2002) Takamiya, T. & Sofue, Y. 2002, ApJ, 576, L15
- Taylor, Kobulnicky, & Skillman (1998) Taylor, C. L., Kobulnicky, H. A., & Skillman, E. D. 1998, AJ, 116, 2746
- Tift & Cocke (1988) Tift, W. G. & Cocke, W. J. 1988, ApJS, 67, 1
- Tolstoy et al. (1998) Tolstoy, E. et al. 1998, AJ, 116, 1244
- Tolstoy et al. (2000) Tolstoy, E. et al. 2000, ESO Messenger, 99, 16
- van der Marel & Franx (1993) van der Marel, R. P. & Franx, M. 1993, ApJ, 407, 525
- van Zee (2001) van Zee, L. 2001, AJ, 121, 2003
- van Zee (2000) van Zee, L. 2000, AJ, 119, 2757
- van Zee et al. (1997a) van Zee, L., Haynes, M. P., & Salzer, J. J. 1996, AJ, 114, 2479
- van Zee et al. (1997b) van Zee, L., Haynes, M. P., Salzer, J. J., & Broeils, A. H. 1997b, AJ, 113, 1618
- van Zee, Salzer, & Skillman (2001) van Zee, L., Salzer, J. J., & Skillman, E. D. 2001, AJ, 122, 121
- van Zee, Skillman, & Salzer (1998) van Zee, L., Skillman, E. D., & Salzer, J. J. 1998, AJ, 116, 1186
- Vidal-Madjar et al. (2000) Vidal-Madjar, A. et al. 2000, ApJ, 538, L77
- Wakker & Schwarz (1991) Wakker, B. P. & Schwarz, U. J. 1991, A&A, 250, 484
- Wolfire, McKee, Hollenbach, & Tielens (2002) Wolfire, M. G., McKee, C. F., Hollenbach, D., & Tielens, A. G. G. M. 2002, ApJ, in press (astro-ph/0207098)
- Young (2000) Young, L. M. 2000, AJ, 120, 2460
- Young (1999) Young, L. M. 1999, AJ, 117, 1758
- Young & Lo (1997) Young, L. M. & Lo, K. Y. 1997, ApJ, 490, 710 (YL97)
- Young & Lo (1996) Young, L. M. & Lo, K. Y. 1996, ApJ, 462, 203 (YL96)
- Youngblood & Hunter (1999) Youngblood, A. J. & Hunter, D. A. 1999, ApJ, 519, 55
| Galaxy | Alt. Name | RA | Dec | Distance | MB | L(H) | References |
|---|---|---|---|---|---|---|---|
| J2000.0 | Mpc | erg s-1 | |||||
| UGCA 292 | CVn dw A | 12 38 40.0 | 32 46 00 | 3.5 | 295 (3) | 1, 2, 3 | |
| GR 8 | DDO 155 | 12 58 39.4 | 14 13 02 | 2.2 | 500 (25) | 4, 4, 5 | |
| DDO 210 | Aquarius dI | 20 46 57.3 | 12 49 50 | 0.95 | 0.37 (0.32) | 6, 2, 3 | |
| DDO 216 | Pegasus dI | 23 28 34.3 | 14 44 50 | 0.76 | 3.7 (0.4) | 7, 2, 3 | |
Note. — The coordinates given here are the pointing centers used for the HI observations; they roughly correspond to the optical centers of the galaxies. All coordinates given in this paper are epoch J2000.0. All H luminosities are from reddening-corrected fluxes measured in large (galaxy-size) apertures, so they include diffuse H emission as well as HII regions. Uncertainties in the H luminosities do not include distance; the uncertainty in the H flux of GR8 is not given by Youngblood & Hunter (1999) and is arbitrarily assumed to be 5%. The MB for UGCA 292 which is given in van Zee (2001) and the H luminosity of GR8 which is given in Youngblood & Hunter (1999) have been corrected to the distances assumed here. References- 1) Dohm-Palmer et al. (2003); 2) van Zee (2001); 3) van Zee (2000); 4) Dohm-Palmer et al. (1998); 5) Youngblood & Hunter (1999); 6) Lee et al. (1999); 7) Gallagher et al. (1998)
| Galaxy | Config | Date | Time on source |
|---|---|---|---|
| hr | |||
| UGCA 292 | Cs | 24Jan99 | 13.3 |
| GR 8 | Cs | 25Jan99 | 12.8 |
| DDO 210 | DnC | 20Jan95 | 2.1 |
| Cs | 25Jan99 | 7.5 | |
| DDO 216 | D | 13Mar95 | 2.2 |
| Cs | 24Jan99 | 12.7 |
| Galaxy | Velocity Range | Resolution | Noise level | |
|---|---|---|---|---|
| km s-1 | ″ | pc | mJy | |
| UGCA 292 | (383,231) | 17.7 17.4 | 300 295 | 0.80 |
| 14.2 13.9 | 241 236 | 0.90 | ||
| GR 8 | (285, 145) | 18.6 18.1 | 199 193 | 0.85 |
| 14.8 14.6 | 158 156 | 0.96 | ||
| DDO 210 | (, ) | 27.4 20.8 | 126 96 | 1.3 |
| 20.8 16.0 | 96 74 | 1.5 | ||
| 47.5 37.0 | 218 170 | 1.6 | ||
| DDO 216 | (, ) | 25.1 21.2 | 93 78 | 0.80 |
| 17.3 15.9 | 64 59 | 0.90 | ||
| 56.2 52.2 | 207 192 | 1.0 | ||
| Galaxy | Vsys | HI Flux | M(HI) | M(HI)/LB | ||
|---|---|---|---|---|---|---|
| km s-1 | km s-1 | km s-1 | ||||
| UGCA 292 | 308.8 | 29.4 | 44.9 | 17.60 | 5.09 | 7.0 |
| GR 8 | 213.9 | 27.8 | 43.6 | 9.74 | 1.11 | 1.0 |
| DDO 210 | 21.8 | 35.5 | 15.18 | 3.23 | 0.87 | |
| DDO 216 | 24.6 | 40.5 | 29.90 | 4.06 | 0.34 |
| Galaxy | N>20 | L(H) | ||
|---|---|---|---|---|
| erg s-1 | ||||
| UGCA 292 | 250 (14.5) | 0.40 (0.05) | 0.31 (0.04) | 300 (3) |
| GR8 | 78 (4.1) | 0.96 (0.16) | 1.1 (0.17) | 500 (25) |
| DDO 210 | 251 (7.9) | 0.08 (0.02) | 0.77 (0.07) | 0.4 (0.3) |
| Leo A | 1037 (27.7) | 0.38 (0.02) | 0.93 (0.04) | 9.7 (0.5) |
| Sag DIG | 647 (15.5) | 0.28 (0.02) | 0.75 (0.05) | 8.1 () |
Note. — N>20 is the number of profiles with signal-to-noise ratio (fitted profile maximum / rms in line-free regions) greater than 20. In parentheses is the number of beam areas corresponding to that number of pixels. The values in parentheses after and are estimates of their uncertainties assuming Poisson statistics in counting the relevant numbers of profiles. The H flux of Sag DIG is taken from Strobel, Hodge, & Kennicutt (1991), assuming a distance of 1.1 Mpc (Longmore et al., 1978; Cook, 1988), and multiplied by a factor of two to account for a typical contribution of diffuse H emission (van Zee, 2000). Consequently the uncertainty in its H flux is a factor of two. The H flux of Leo A is taken from Youngblood & Hunter (1999), assuming a 5% uncertainty and a distance of 0.69 Mpc (Tolstoy et al., 1998).
| Total S/N | Fitted h3 | Fitted h4 |
|---|---|---|
| 30 | 0.0501 0.0124 | 0.0999 0.0124 |
| 20 | 0.0501 0.0186 | 0.0998 0.0186 |
| 10 | 0.0504 0.0378 | 0.0997 0.0384 |
| 7 | 0.0506 0.0552 | 0.100 0.0572 |
| 5 | 0.0500 0.0875 | 0.105 0.0946 |
| Total S/N | Input Amp | Fitted Amp | Center | Dispersion | Column Density |
|---|---|---|---|---|---|
| km s-1 | km s-1 | % Error | |||
| Symmetric Profiles | |||||
| 30 | 17.65 | 17.65 1.41 | 0.00 0.16 | 3.99 0.28 | 14 |
| 12.32 | 12.32 1.41 | 0.40 | 11.04 0.67 | 13 | |
| 20 | 11.76 | 11.76 1.41 | 0.00 0.25 | 3.98 0.43 | 21 |
| 8.24 | 8.26 1.46 | 0.00 0.63 | 11.10 1.00 | 19 | |
| 11 | 6.47 | 6.59 1.29 | 0.00 0.55 | 3.93 0.81 | 37 |
| 4.53 | 4.53 1.41 | 0.05 1.60 | 11.44 2.44 | 32 | |
| Asymmetric Profiles | |||||
| 30 | 17.65 | 17.72 1.05 | 0.00 0.18 | 4.00 0.24 | 11 |
| 12.35 | 12.35 0.98 | 0.10 0.60 | 11.00 0.44 | 9 | |
| 20 | 11.76 | 11.87 1.06 | 0.02 0.26 | 3.99 0.37 | 16 |
| 8.24 | 8.24 0.99 | 0.14 0.95 | 11.01 0.68 | 13 | |
| 11 | 6.47 | 6.67 1.18 | 0.10 1.50 | 3.98 0.71 | 32 |
| 4.53 | 4.55 1.12 | 0.50 2.30 | 10.96 1.51 | 24 | |
Note. — All amplitudes are given in units of the noise level in the spectra. The top row in each pair gives values for the narrow component (input km s-1) and the bottom row gives values for the broad component (11 km s-1). Asymmetric profiles had the broad component offset in velocity by 5 km s-1 from the narrow component, and that offset has been subtracted from the fitted center velocities.