Beyond the T Dwarfs: Theoretical Spectra, Colors, and Detectability of the Coolest Brown Dwarfs
Abstract
We explore the spectral and atmospheric properties of brown dwarfs cooler than the latest known T dwarfs. Our focus is on the yet-to-be-discovered free-floating brown dwarfs in the Trange from 800 K to 130 K and with masses from 25 to 1 . This study is in anticipation of the new characterization capabilities enabled by the launch of SIRTF and the eventual launch of JWST. In addition, it is in support of the continuing ground-based searches for the coolest substellar objects. We provide spectra from 0.4 m to 30 m , highlight the evolution and mass dependence of the dominant H2O, CH4, and NH3 molecular bands, consider the formation and effects of water-ice clouds, and compare our theoretical flux densities with the putative sensitivities of the instruments on board SIRTF and JWST. The latter can be used to determine the detection ranges from space of cool brown dwarfs. In the process, we determine the reversal point of the blueward trend in the near-infrared colors with decreasing T(a prominent feature of the hotter T dwarf family), the Tat which water and ammonia clouds appear, the strengths of gas-phase ammonia and methane bands, the masses and ages of the objects for which the neutral alkali metal lines (signatures of L and T dwarfs) are muted, and the increasing role as Tdecreases of the mid-infrared fluxes longward of 4 m . These changes suggest physical reasons to expect the emergence of at least one new stellar class beyond the T dwarfs. Furthermore, studies in the mid-infrared could assume a new, perhaps transformational, importance in the understanding of the coolest brown dwarfs. Our spectral models populate, with cooler brown dwarfs having progressively more planet-like features, the theoretical gap between the known T dwarfs and the known giant planets. Such objects likely inhabit the galaxy, but their numbers are as yet unknown.
1 Introduction
The discovery of Gliese 229B (Oppenheimer et al. 1995) and the successes of the 2MASS (Reid 1994; Stiening, Skrutskie, and Capps 1995), Sloan (Strauss et al. 1999), and DENIS (Delfosse et al. 1997) surveys have collectively opened up a new chapter in stellar astronomy. The L and T dwarfs (Kirkpatrick et al. 1999,2000; Martín et al. 1999; Burgasser et al. 1999, 2000a,b,c) that have thereby been discovered and characterized comprise the first new “stellar” types to be added to the stellar zoo in nearly 100 years. The lower edge of the solar-metallicity main sequence is an L dwarf not an M dwarf, with a Tnear 1700 Kelvin (K), and more than 200 L dwarfs spanning a Trange from 2200 K to 1300 K are now inventoried. The coolest L dwarfs are also brown dwarfs, objects too light ( M⊙) to ignite hydrogen stably on the main sequence (Burrows et al. 2001). Similarly, to date approximately 40 T dwarfs have been discovered spanning the Trange from 1200 K to 750 K. These are all brown dwarfs and are the coldest “stars” currently known.
However, the edge of the “stellar” mass function in the field, in the solar neighborhood, or in star clusters has not yet been reached and it is strongly suspected that in the wide mass and Tgap between the currently known T dwarfs and Jovian-like planets there resides a population of very cool ( K) brown dwarfs. Such objects could be too dim in the optical and near-infrared to have been seen with current technology, but might be discovered in the not-too-distant future by the NGSS/WISE infrared space survey (Wright et al. 2001), SIRTF (Space InfraRed Telescope Facility; Werner and Fanson 1995), and/or JWST (James Webb Space Telescope; Mather and Stockman 2000). In this paper, we calculate the spectra and colors of such a population in order to provide a theoretical underpinning for the future study of these coolest of brown dwarfs. Dwelling as they do at Tbeyond those of the currently-known T dwarfs, these “stars” emit strongly in the near- and mid-infrared. Consequently, we highlight their fluxes from 1 to 30 microns and compare these fluxes with the putative sensitivities of instruments on SIRTF and planned instruments on JWST. We include the effects of water clouds that form in the coolest of these objects. The presence of clouds of any sort emphasizes the kinship of this transitional class with solar system planets, in which clouds play a prominent role. (Note, however, that on Jupiter itself water clouds are too deep below the ammonia cloud layer to have been unambiguously detected.)
Since we focus on isolated free-floaters or wide binary brown dwarfs, we do not include external irradiation by companions. The Tof this model set ( K) are such that silicate and iron clouds are deeply buried. Hence, unlike for L dwarfs and early T dwarfs (Marley et al. 2002; Burrows et al. 2002), the effect of such refractory clouds on emergent spectra can be ignored. In §2, we discuss our numerical approaches and inputs. We go on in §3 to describe our mass-age model set and our use of the Burrows et al. (1997) evolutionary calculations to provide the mapping between (T, gravity []) and (mass, age). In §4, we present a representative sample of derived atmospheric temperature(T)/pressure(P) profiles and their systematics. This leads in §5 to a short discussion of the SIRTF and JWST point-source sensitivities. Section 6 concerns the derived spectra and is the central section of the paper. In it, we discuss prominent spectral features from the optical to 30 microns, trends as a function of age, T, and mass, diagnostics of particular atmospheric constituents, and detectability with instruments on SIRTF and JWST. We find that these platforms can in principle detect brown dwarfs cooler than the current T dwarfs out to large distances. We also explore the evolution of and its eventual return to the “red” (Marley et al. 2002; Stephens, Marley, and Noll 2001), reversing the blueward trend with decreasing Tthat roughly characterizes the known T dwarfs. Furthermore, we make suggestions for filter sets that may optimize their study with NIRCam on JWST. Finally, we present physical reasons for anticipating the emergence of a new stellar type beyond the T dwarfs. In §7, we summarize what we have determined about this coolest-dwarf family and the potential for their detection.
2 Numerical Tools and Assumptions
To calculate model atmospheres of cool brown dwarfs requires 1) a method to solve the radiative transfer, radiative equilibrium, and hydrostatic equilibrium equations, 2) a convective algorithm, 3) an equation of state that also provides the molecular and atomic compositions, 4) a method to model clouds that may form, and 5) an extensive opacity database for the constituents that arise in low-temperature, high-pressure atmospheres. The computer program we use to solve the atmosphere and spectrum problem in a fully self-consistent fashion is an updated version of the planar code TLUSTY (Hubeny 1988; Hubeny & Lanz 1995), which uses a hybrid of Complete Linearization and Accelerated Lambda Iteration (Hubeny 1992). To handle convection, we use mixing-length theory (with a mixing length equal to one pressure-scale height). The equation of state we use to find the P/T/density() relation is that of Saumon, Chabrier, and Van Horn (1995) and the molecular compositions are calculated using a significantly updated version of the code SOLGASMIX (Burrows and Sharp 1999). The latter incorporates a rainout algorithm for refractory silicates and iron (Burrows et al. 2001). The most important molecules are H2, H2O, CH4, CO, N2, and NH3 and the most important atoms are Na and K.
We determine when water condenses by comparing the water ice condensation curve (the total pressure at which the partial pressure of water is at saturation) with the object’s T/P profile. For pressures lower than that near the associated intercept, we deplete the vapor phase through the expected rainout and embed an absorbing/scattering water-ice cloud with a thickness of one pressure-scale-height in the region above. Note that the total gas pressures at which the partial pressure of water is at the triple-point pressure of water are generally higher than the intercept pressures we find. Hence, the water gas to water ice (solid) transition is the more relevant. Note also that the optical properties of water ice and water droplets are not very different. The ice particles are assumed to be spherical and their modal particle radii are derived using the theory of Cooper et al. (2003). They vary in size from 20 m (higher-/lower-T) to 150 m (lower-/higher-T) and we assume that the particle size is independent of altitude. A canonical super-saturation factor (Cooper et al. 2003; Ackermann and Marley 2001) of 0.01 (1.0%) is used. Curiously, with such large particles and such a small super-saturation, the absorptive opacity of our baseline water-ice clouds, when they do form, is not large. In fact, the consequences for the emergent spectrum of the associated drying of the upper atmosphere, and the corresponding diminution of the water vapor abundance there, are comparable to the effects on the spectrum of the clouds themselves. Without an external flux source, and the scattering of that flux back into space by clouds, water-ice clouds seem to have only a secondary influence on the spectra of the coolest isolated brown dwarfs.
We use the constantly-updated opacity database described in Burrows et al. (1997,2001,2002). This includes Rayleigh scattering, Collision-Induced Absorption (CIA) for H2 (Borysow and Frommhold 1990; Borysow, Jørgensen, and Zheng 1997), and T/P-dependent absorptive opacities from 0.3 m to 300 m for H2O, CH4, CO, and NH3. The opacities of the alkali metal atoms are taken from Burrows, Marley, and Sharp (2000), which are similar in the line cores and near wings to those found in Burrows and Volobuyev (2003). The opacities are tabulated in T//frequency space using the abundances derived for a solar-metallicity elemental abundance pattern (Anders and Grevesse 1989; Grevesse and Sauval 1998; Allende-Prieto, Lambert, and Asplund 2002). During the TLUSTY iterations, the opacity at any thermodynamic point and for any wavelength is obtained by interpolation. The absorptive opacities for the ice particles are derived using Mie theory with the frequency-dependent spectrum of the complex index of refraction of water ice. Ammonia clouds form in the upper atmospheres of the coldest exemplars of the late brown dwarf family (T 160 K; §4). Nevertheless, since the scattering of incident radiation that gives them their true importance in the Jovian context is absent, we ignore them here.
3 Model Set
We have chosen for this study a set of models with the masses and ages given in Table 1. Also shown in Table 1 are the corresponding gravities and T. These models span an effective temperature range from 800 K to 150 K that allows us to probe the realm between the known T dwarfs and the known Jovian planets. To establish the mapping between mass/age pairs and the T/ pairs that are needed for atmospheric calculations, we use the evolutionary models of Burrows et al. (1997). While this procedure does not ensure that the atmospheres we calculate are fully consisitent with those evolutionary tracks, the errors are not large.
Figure 1 depicts evolutionary trajectories and isochrones in T/ space for models in the realm beyond the T dwarfs. The depicted isochrones span the range from 107 to years and the masses cover the range from 0.5 to 25 . The large dots denote the models found in Table 1 for which we have calculated spectra and atmospheres. For contrast, the approximate region in which the currently known T dwarfs reside is also shown. In addition, we provide the demarcation lines that separate (in a rough sense) the cloud-free models from those with water clouds and ammonia clouds. The clouds form to the left of the corresponding condensation lines. Figure 1 emphasizes the transitional and as-yet-unstudied character of this family of objects. It also provides at a glance a global summary of family properties. Figure 2 is a companion figure to Fig. 1, but shows iso-Tlines in mass/age space. For a given mass, Fig. 2 allows one to determine the evolution of Tand at what age a given Tis achieved. It also makes easy the determination of the combination of mass and age for which clouds form, as well as the minimum mass for which a given Tis reached after approximately the galactic disk’s or the sun’s age ( and years, respectively). For instance, Fig. 2 shows that it takes Myr for a 2-object to reach a Tof 400 K, that it takes the same object 1 Gyr to reach a Tof 250 K, and that in the age of the solar system a 2-object can reach the NH3 condensation line. Similarly, Fig. 2 indicates that a 10-object takes 1 Gyr to reach a Tof 400 K, and that it has water-ice clouds in its upper atmosphere. Figures 1 and 2 are, therefore, useful maps of the model domain to which the reader may want often to return.
To calculate absolute fluxes at 10 parsecs one needs the radius of the object. We determine this for each model in Table 1 by using a fit to the results of Burrows et al. (1997) that works reasonably well below 25 and after deuterium burning has ended:
| (1) |
where is Jupiter’s radius ( cm).
4 Temperature-Pressure Profiles
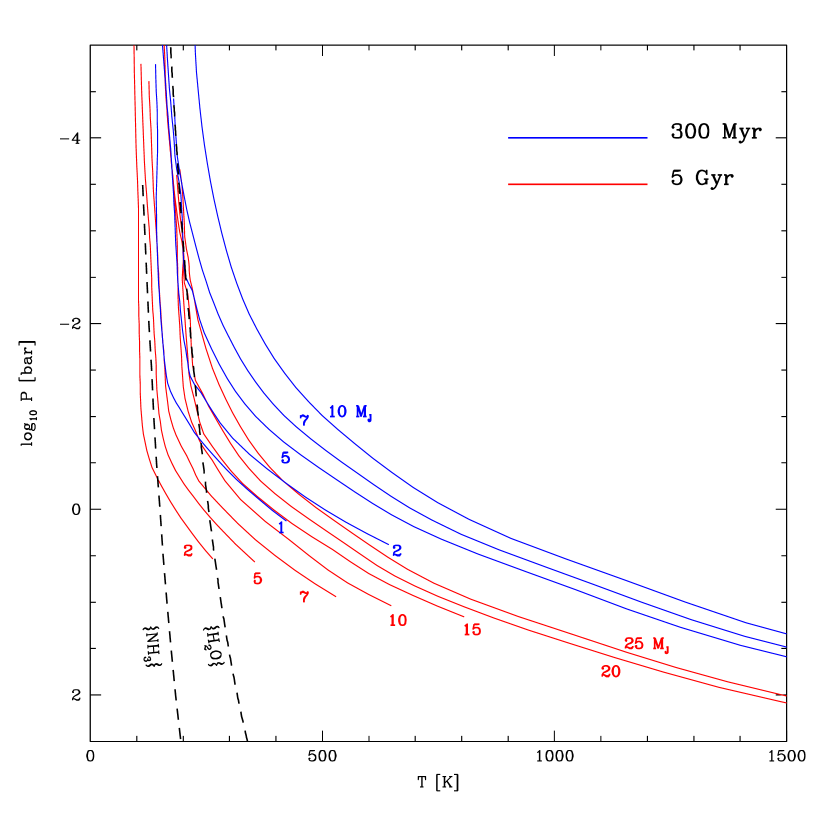
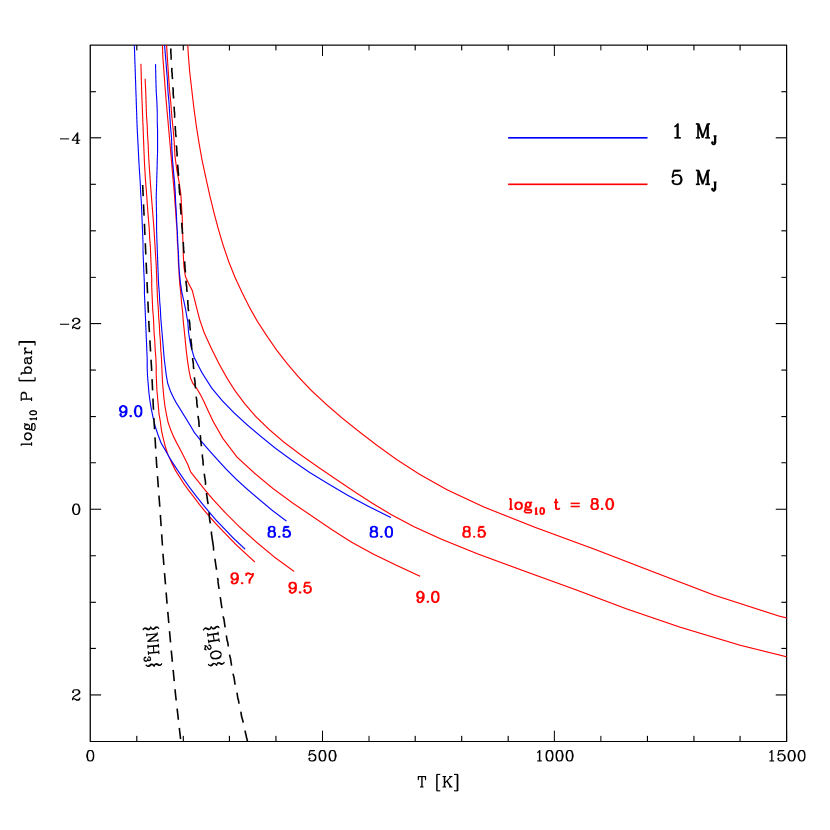
Shown in Fig. 3 are representative temperature-pressure profiles at 300 Myr (blue) for models with masses of 1, 2, 5, 7, and 10 and at 5 Gyr (red) for models with masses of 2, 5, 7, 10, 15, 20, and 25 . Superposed are the water ice and ammonia condensation lines at solar metallicity. The radiative-convective boundary pressures are near 0.1-1.0 bars for the lowest-mass, oldest models and are near 10-30 bars for the youngest, most massive models. At a given temperature, lower-mass objects have higher pressures (at a given age). Similarly, an object with a given mass evolves to higher and higher pressures at a given temperature. This trend is made clear in Fig. 4, in which the evolving T/P profiles for 1-and 5-models are depicted, and is not unexpected (Marley et al. 1996,2002; Burrows et al. 1997). Note that Fig. 4 implies that a 5-object takes 300 Myr to form water clouds, but that a 1-object takes only 100 Myr. After 1 Gyr, a 1-object forms ammonia clouds, signature features of Jupiter itself. These numbers echo the information also found in Fig. 2.
The appearance of a water-ice cloud manifests itself in Figs. 3 and 4 by the kink in the T/P profile near the intercept with the associated condensation line. Generally, the higher the intercept of the T/P profile with the condensation line (the lower the intercept pressure) the smaller the droplet size (Cooper et al. 2003). Note that after an age of 300 Myr a 7-object is expected to form water clouds high up in its atmosphere and that after 5 Gyr even a 25-object will do so. The higher the atmospheric pressure at which the cloud forms the greater the column thickness of the cloud. This results in a stronger cloud signature for the lower-mass models than for the higher-mass models. However, given the generally large ice particle sizes derived with the Cooper et al. (2003) model, the low assumed supersaturation (§2), the tendency for larger particle radii to form for larger intercept pressures, and the modest to low imaginary part of the index of refraction for pure water ice, the effect of water clouds in our model set is not large. This translates into a small cloud effect on the corresponding flux spectra (§6).
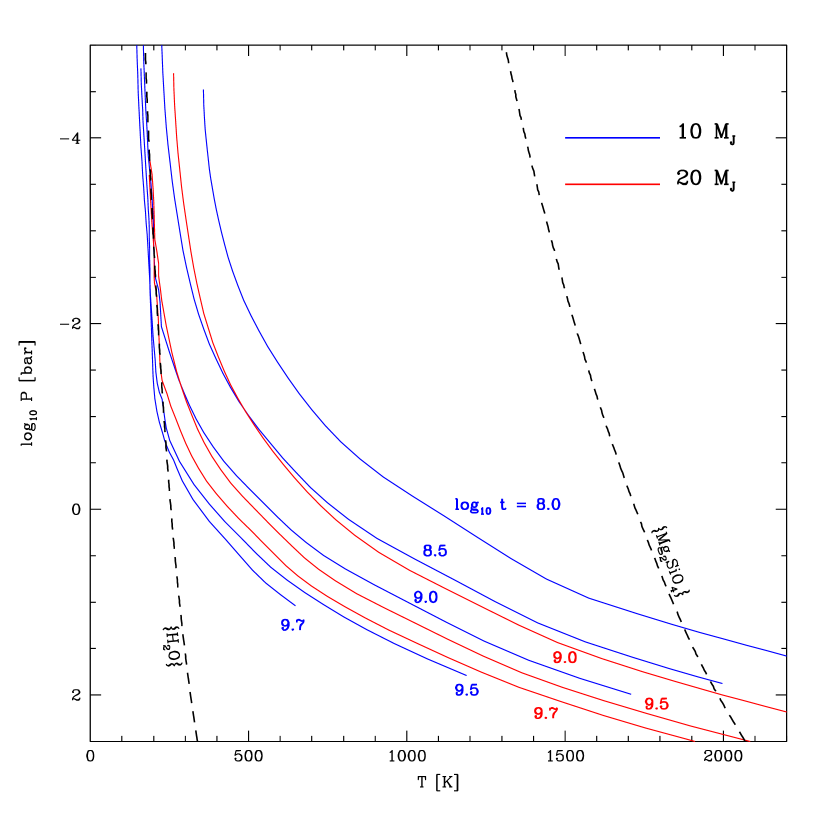
Figure 5 portrays the evolution of the T/P profiles for 10-and 20-objects. This figure is provided to show, among other things, the position of the forsterite (Mg2SiO4) condensation line relative to that of water ice. Mg2SiO4 clouds exist in these brown dwarfs, but at significantly higher pressures and temperatures and are, therefore, buried from view. Hence, unlike in L dwarfs, such clouds have very little effect on the emergent spectra of the coolest brown dwarfs that are the subject of this paper.
Finally, the high pressures achieved at low temperatures for the lowest mass, oldest objects shown in Figs. 3, 4, and 5 suggest that the CIA (pressure-induced) opacity of H2 might for them be important. This is indeed the case at longer wavelengths and is discussed in §6. We mention this because CIA opacity is yet another characteristic signature of the Jovian planets in our own solar system and to emphasize yet again that our cold brown dwarf model suite is a bridge between the realms of the planets and the “stars.”
5 SIRTF and JWST Point-Source Sensitivities
Before we present and describe our model spectra, we discuss the anticipated point-source sensitivities of the instruments on board the SIRTF and JWST space telescopes. SIRTF has a 0.84-meter aperture and is to be launched in mid-April of 2003. JWST is planned to have a collecting area of 25 square meters over a segmented 6-meter diameter mirror and is to be launched at the beginning of the next decade. While SIRTF is the last of the “Great Observatories,” and will view the sky with unprecedented infrared sensitivity, JWST will in turn provide a two- to four-order-of-magnitude gain in sensitivity through much of the mid-infrared up to 27 microns. While their fields of view are limited and missions like WISE (formerly NGSS; Wright et al. 2001) are more appropriate for large-area surveys, the extreme sensitivity of both SIRTF and JWST will bring the coolest brown dwarfs and isolated giant planets into the realm of detectability and study.
SIRTF/IRAC has four channels centered at 3.63 m , 4.53 m , 5.78 m , and 8.0 m that are thought to have 5- point-source sensitivities for 200-second integrations
of 2.5, 4.5, 15.5, and 25.0 microJanskys, respectively. HST/NICMOS
achieves a bit better than one microJansky sensitivity at 2.2 m , but does not extend as far into the near IR.
The short-wavelength, low-spectral resolution module (“Short-low”) of
SIRTF/IRS extends from 5.0 m to 14.0 m and has a 5- point-source
sensitivity for a 500-second integration of 100 microJanskys. The other three modules on IRS cover
other mid-IR wavelength regimes at either low- or high-spectral resolution, but will have
smaller brown dwarf detection ranges. The 20.5 m to 26 m channel on SIRTF/MIPS is the most relevant channel on MIPS for brown dwarf studies and has a suggested
1- point-source sensitivity at 24 m of 70 microJanskys. This is
1000 times better in imaging mode than for the pioneering IRAS. All these SIRTF sensitivities are derived from
various SIRTF web pages and are pre-launch estimates
(http://sirtf.caltech.edu). Furthermore, for all three SIRTF
instruments, one can estimate the point-source sensitivities
for different values of the signal-to-noise and integration
times. However, these signals-to-noise and integration times are the nominal combinations
for each instrument and the quoted sensitivities
serve to guide our assessment of SIRTF’s capabilities for cool brown dwarf studies in advance of
real on-orbit calibrations and measurements.
The capabilities of JWST are even more provisional, but the design goals for its instruments
are impressive (http://ngst.gsfc.nasa.gov). JWST/NIRCam is to span
0.6 m to 5.0 m in various wavelength channels/filters,
though the final design has not been frozen. The seven so-called “B” filters have
widths of 0.5–1.0 microns centered at 0.71, 1.1,
1.5, 2.0, 2.7, 3.6, and 4.4 microns and are expected to have 5-
point-source sensitivities in imaging mode, for an assumed exposure time of seconds, of 1.6,
0.95, 1.0, 1.2, 0.95, 1.05, and 1.5 nanoJanskys (nJ), respectively.
In addition, a set of so-called “I” filters, with about half to one quarter the spectral
width of the B filters, and sensitivites comparable to that of the B filters, are
available in the 1.5–5.0 m region. Furthermore, JWST/NIRCam may have a tunable filter
to examine selected spectral regions beyond 2.5 m at a resolution () of 100, though at
the time of this writing the availability of such a capability remained uncertain.
Hence, with JWST/NIRCam we enter the world of nanoJansky sensitivity. This is greater than one
hundred times more sensitive than HST/NICMOS at 2.2 m and enables one to probe deeply in space,
as well as broadly in wavelength. JWST/MIRI spans the mid-IR wavelength range from 5.0 m to 27.0 m and will have in imaging mode a 10- point-source sensitivity for a 104-second integration of from 63 nJ
at the shortest wavelength to 10 microJanskys at the longest. This is orders of magnitude more sensitive
than any previous mid-IR telescope in imaging mode. (In spectral mode with
an near 1000, JWST/MIRI
will be 100 times less sensitive than in imaging mode.) Given
the importance of the mid-IR for understanding those brown
dwarfs that may exist in relative abundance at Tcooler than those of the currently known T dwarfs,
MIRI provides what is perhaps a transformational capability. As with SIRTF, the quoted JWST sensitivities
are taken from the associated web pages and, hence, should be
considered tentative.
We now turn to a discussion of the spectra, spectral evolution, defining features, systematics, and diagnostics for the cool brown dwarf models listed in Table 1 and embedded in Figs. 1 and 2. On each of Figs. 6 to 11 in §6, we plot for the SIRTF (red) and JWST (blue) instruments the broadband sensitivities we have summarized in this section.
6 Cool Brown Dwarf Spectra
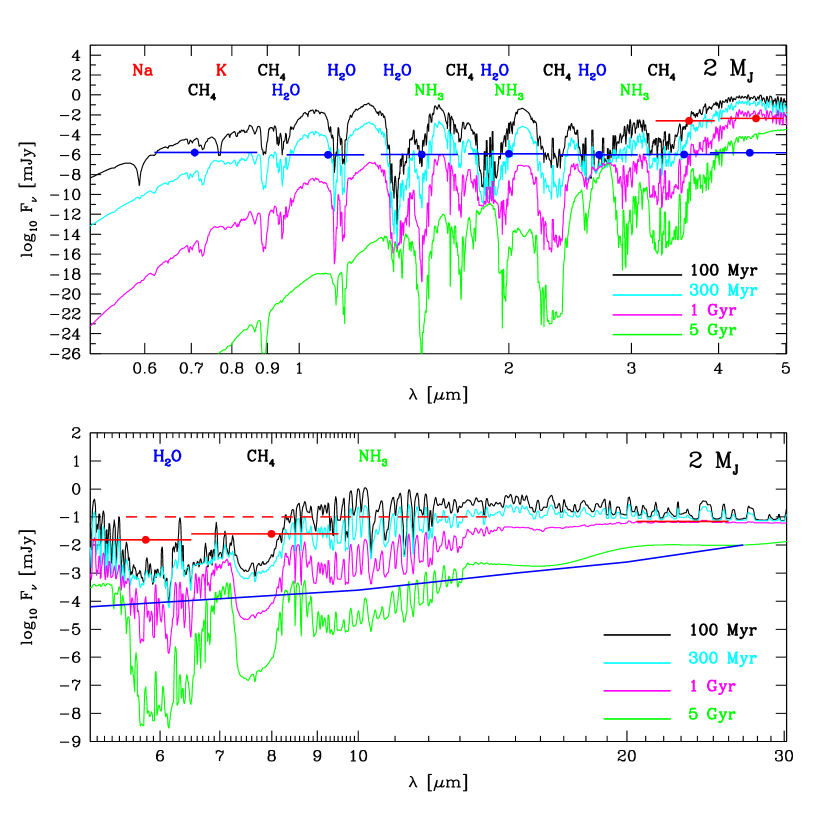
Using the numerical tools and data referred to in §2, and the mapping between T/ and mass/age found in Table 1, we have generated a grid of spectral and atmospheric models for cool brown dwarfs that reside in the low-Tsector of T/ space (Fig. 1). Some of the associated T/P profiles were given in Figs. 3, 4, and 5. In Figs. 6 to 11, we plot theoretical flux spectra (Fν, in milliJanskys) from the optical to 30 m at a distance of 10 parsecs. These figures constitute the major results of our paper. For comparision, superposed on each figure are the estimated point-source sensitivities of the instruments on board SIRTF and JWST (§5). In addition, included at the top of Figs. 8 through 11 are the rough positions of the major atmospheric absorption features. (The full model set is available from the first author upon request.)
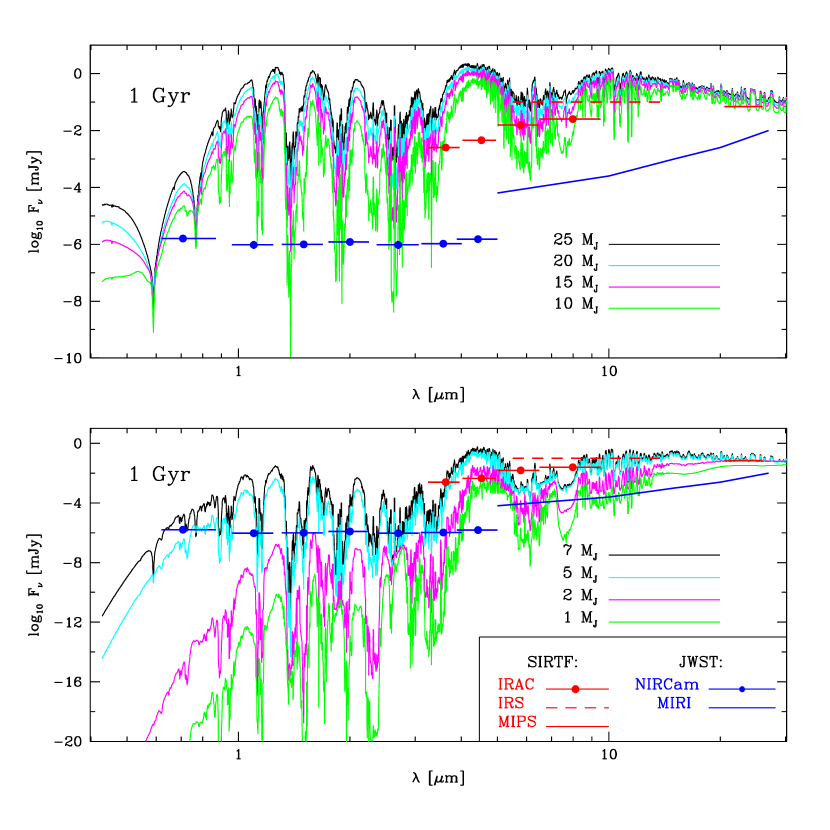
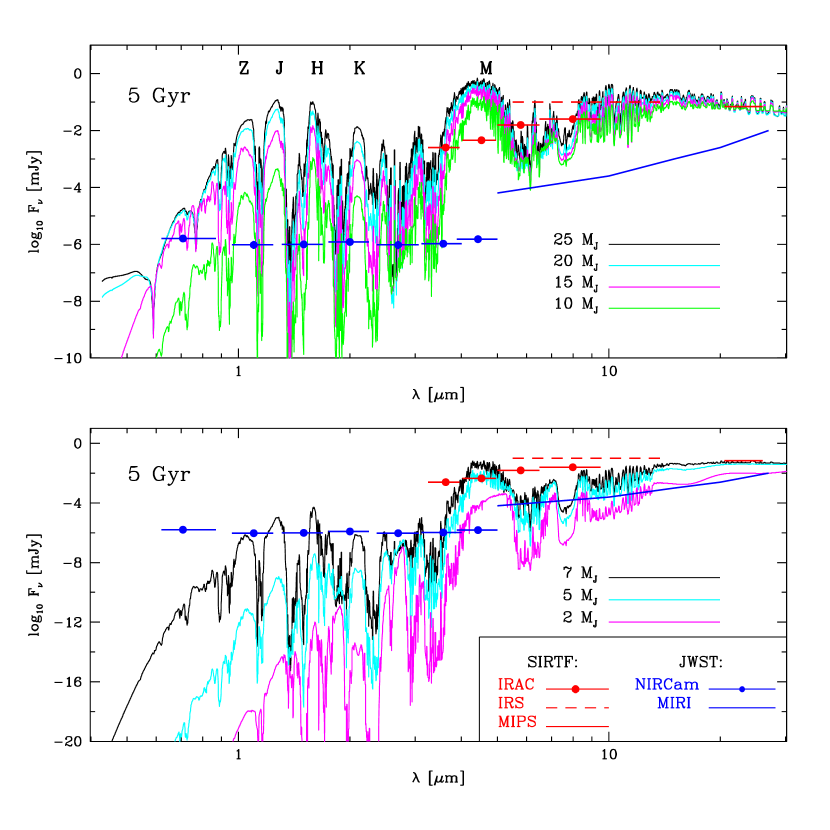
Figures 6 and 7 portray the mass dependence of a cool brown dwarf’s flux spectrum at 10 parsecs for ages of one and five Gyr, respectively. The model masses are 25, 20, 15, 10, 7, 5, 2, and 1 . The top panels depict the most massive four, while the bottom panels depict the least massive four (three for Fig. 7). Together they show the monotonic diminution of flux with object mass at a given age that parallels the associated decrease in Twith mass (from 800 K to 130 K) seen in Table 1 and Fig. 2.
Figures 6 through 11 show the peaks due to enhanced flux through the water vapor absorption bands that define the classical terrestrial photometric bands (, , , , and ) and that have come to characterize brown dwarfs since the discovery of Gliese 229B (Oppenheimer et al. 1995; Marley et al. 1996). For the more massive models, the near-IR fluxes are significantly above black-body values. At T800 K, the 25-/1-Gyr model shown in Fig. 6 could represent the known late T dwarfs, but all other models in this model set are “later” and, hence, represent as yet undetected objects.
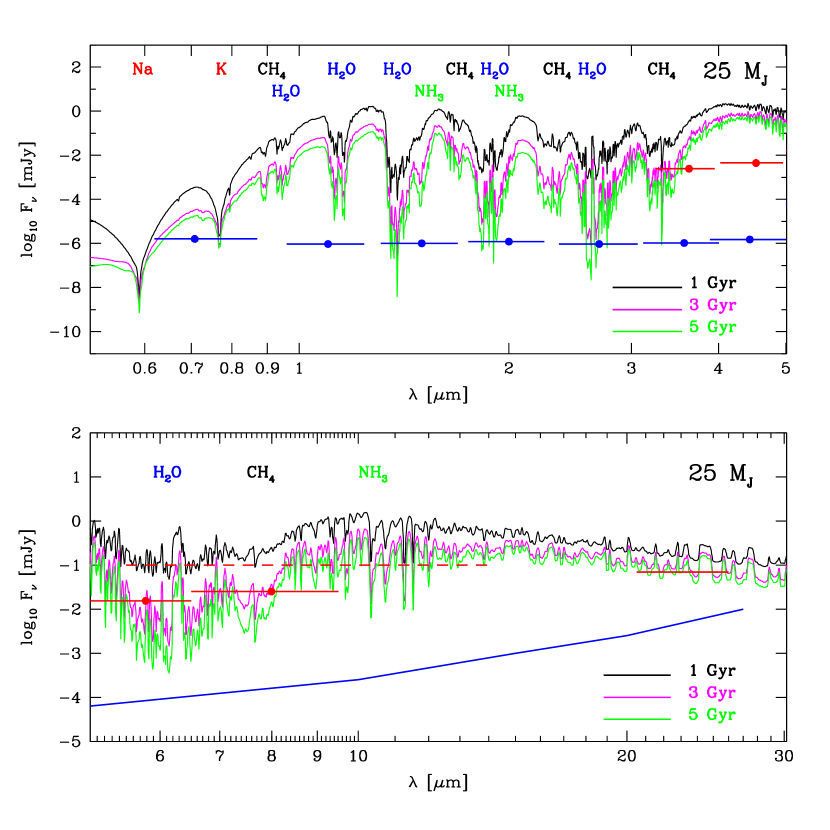
Apart from the distinctive water troughs, generic features are the hump at 4-5 microns ( band), the broad hump near 10 microns, the methane features at 2.2 m , 3.3 m , 7.8 m , and in the optical (particularly at 0.89 m ), the ammonia features at 1.5 m , 1.95 m , 2.95 m , and 10.5 m , and the Na-D and K I resonance lines at 0.589 m and 0.77 m , respectively. However, as Figs. 6-11 indicate, the strengths of each of these features are functions of mass and age.
For lower masses or greater ages, the centroid of the band hump shifts from 4.0 m to 5.0 m . In part, this is due to the swift decrease with Tat the shorter wavelengths of the Wien tail. Even after the collapse of the flux in the optical and near-IR after 1 Gyr for masses below 5 or after 5 Gyr for masses below 10 , the band flux persists as a characteristic marker and will be SIRTF’s best target. Moreover, IRAC’s filters are well-positioned for this task. As one would expect, the relative importance of the mid-IR fluxes, in particular between 10 and 30 microns, grows with decreasing mass and increasing age. Since this spectral region is near the linear Rayleigh-Jeans tail, fluxes here persist despite decreases in Tfrom 800 K to 130 K. Figure 11 depicts this clearly for the older 2-models. The rough periodicity in flux beyond 10 m is due predominantly to the presence of pure rotational bands of water and, for cooler models, methane as well. For the coldest models depicted in Figs. 6, 7, and 11, this behavior subsides, but is replaced with long-period undulations due to CIA absorption by H2. Such a signature is characteristic of Jovian planets and is expected for low-T, high-P atmospheres. Its appearance marks yet another transition, seen first in this model set for the old 5-and middle-aged 2-objects, between T-dwarf-like and “planet”-like behavior. As Figs. 6-11 imply, SIRTF/MIPS should be able to detect at 10 parsecs the 24-m flux of objects more massive than 2-4 at age 1 Gyr or more massive than 10 at 5 Gyr.
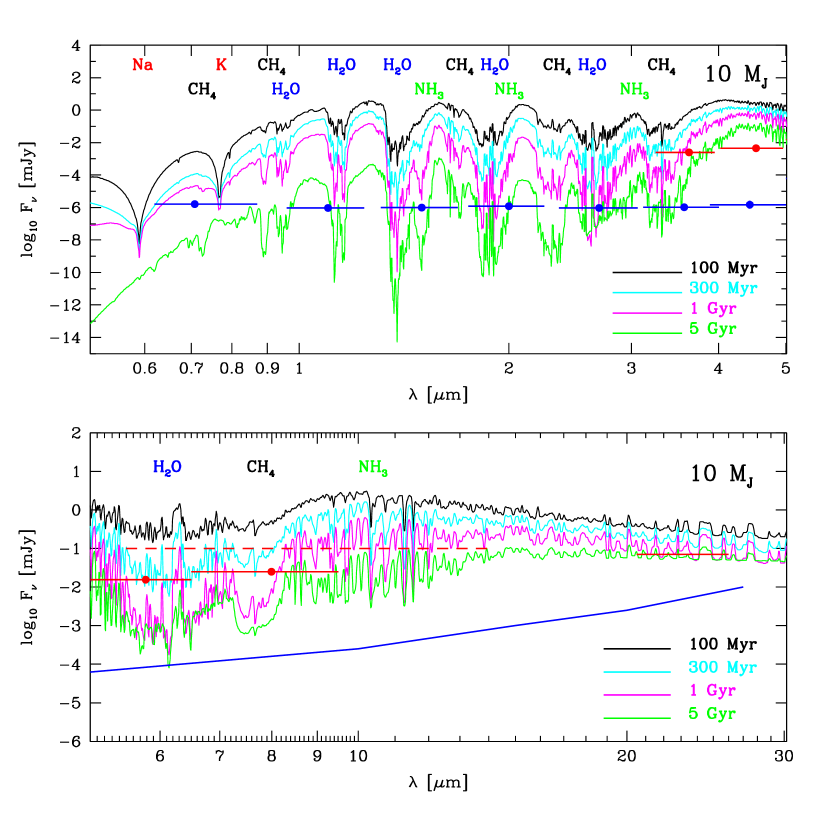
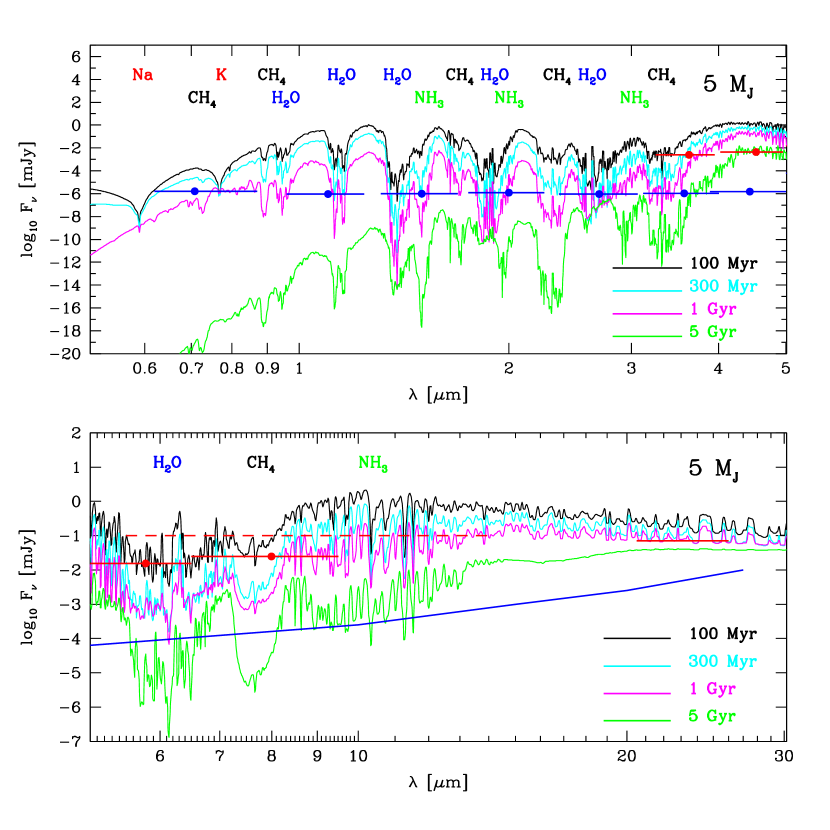
Methane forms at low temperatures and high pressures and makes its presence felt in older and less massive objects. Hence, its features at 0.89 m , 2.2 m , 3.3 m , and 7.8 m deepen with age and decreasing mass. An example of such strengthening at 7.8 m and 2.2 m can be seen in Fig. 10 by comparing the 100-Myr and 5-Gyr models with a mass of 5 . Clear indications of the strengthening of the methane absorption feature at 0.89 m with decreasing mass can be seen in the upper panel of Fig. 7. This trend is accompanied by a corresponding weakening of the Cs I feature on top of it. However, due to its presence in the band at relatively short wavelengths, the methane feature at 0.89 m may be difficult to detect for all but the youngest and/or most massive models. The actual strength of the 7.8-m feature depends on the T/P profile in the upper layers of the atmosphere, which in turn might be affected by ambient UV (disfavored for free-floating brown dwarfs) or processes that could create a stratosphere and a temperature inversion. Hence, the filling in or reshaping of the 7.8-m feature might signal the presence of a stratosphere. Such a temperature inversion could also affect the depths of the water troughs.
As can be seen by comparing the top panels of Figs. 8-11, the alkali metal features at 0.589 m and 0.77 m diminish in strength with decreasing mass and increasing age. These features are signatures of the known T dwarfs (Burrows, Marley, and Sharp 2000; Burrows et al. 2002; Tsuji, Ohnaka, and Aoki 1999), so their decay signals a gradual transformation away from standard T-dwarf behavior. For the 10-model older than 1 Gyr and the 2-model older than 100 Myr, these alkali resonance features cease to be primary signatures. This happens near a Tof 450 K.
Ammonia makes an appearance at even lower temperatures than methane and due to the relatively high abundance of nitrogen its absorption features are generally strong, particularly for the cool objects in our model set. For the higher Tin the mid-T-dwarf range, ammonia may have been seen, but is weak (Saumon et al. 2000). Figs. 10 and 11 evince strong ammonia features in the upper panels at 1.5 m , 1.95 m , and 2.95 m and in Figs. 8-11 in the lower panels at 10.5 m . As Figs. 6-11 imply, the Short-low module on SIRTF/IRS should be able to study the 10.5-m ammonia feature. Even for the 25-/1Gyr model, the 10.5 m feature is prominent. For the more massive objects (10-25 ), the strength of the 10.5-m feature increases with age. For the lowest mass objects (2-7 ), the strength of the 10.5-m ammonia feature actually decreases with age, even though the strengths of the other ammonia lines increase. As the more massive objects age, their atmospheric pressures increase, shifting the N2/NH3 equilibrium towards NH3. For the less massive models, pressured-induced absorption by H2 grows with increasing atmospheric pressure (Fig. 3-4) and partially flattens an otherwise strengthening 10.5-m ammonia feature.
Below Tof 160 K, Figs. 1 and 2 demonstrate that ammonia clouds form. However, given that we are studying isolated objects that have no reflected component (unlike Jupiter and Saturn), and given that realistic supersaturations are only 1%, we have determined that ammonia clouds do not appreciably affect the emergent spectra. As a consequence, we ignore them in the three relevant models (Fig. 1).
As with the known T and L dwarfs, water vapor absorptions dominate and sculpt the flux spectra of the cooler brown dwarfs and these features generally deepen with increasing age and decreasing mass. The latter trend is in part a consequence of the increase with decreasing gravity of the column depth of water above the (roughly-defined) photosphere. At Tbelow 400-500 K (Figs. 1-5), water condenses in brown dwarf atmospheres. The appearance of such water-ice clouds constitutes yet another milestone along the bridge from the known T dwarfs to the giant planets. Associated with cloud formation is the depletion of water vapor above the tops of the water cloud, with the concommitant decrease at altitude in the gas-phase abundance of water. Within 100 Myr, water clouds form in the atmosphere of an isolated 1-object and within 5 Gyr they form in the atmosphere of a 25-object. In fact, approximately two-thirds of the models listed in Table 1 incorporate water-ice clouds. However, at supersaturations of 1% and for particle sizes above 10 microns (§2-§4; Cooper et al. 2003), such clouds (and the corresponding water vapor depletions above them) only marginally affect the calculated emergent spectra. Even though we see in Figs. 3-5 the associated kinks in the T/P profiles, these do not translate into a qualitative change in the emergent spectra at any wavelength. For wavelengths longward of 1 micron, the cloudy spectra differ from the no-cloud spectra by at most a few tens of percent. For a representative 2-model at 300 Myr (T280 K), if we increase the supersturation factor by a factor of ten from 1% to 10%, the flux at 5 microns decreases by approximately a factor of two, while the flux from 10 to 30 microns increases by on average 50%. These are not large changes, given the many orders of magnitude covered by the fluxes in Figs. 6-11.
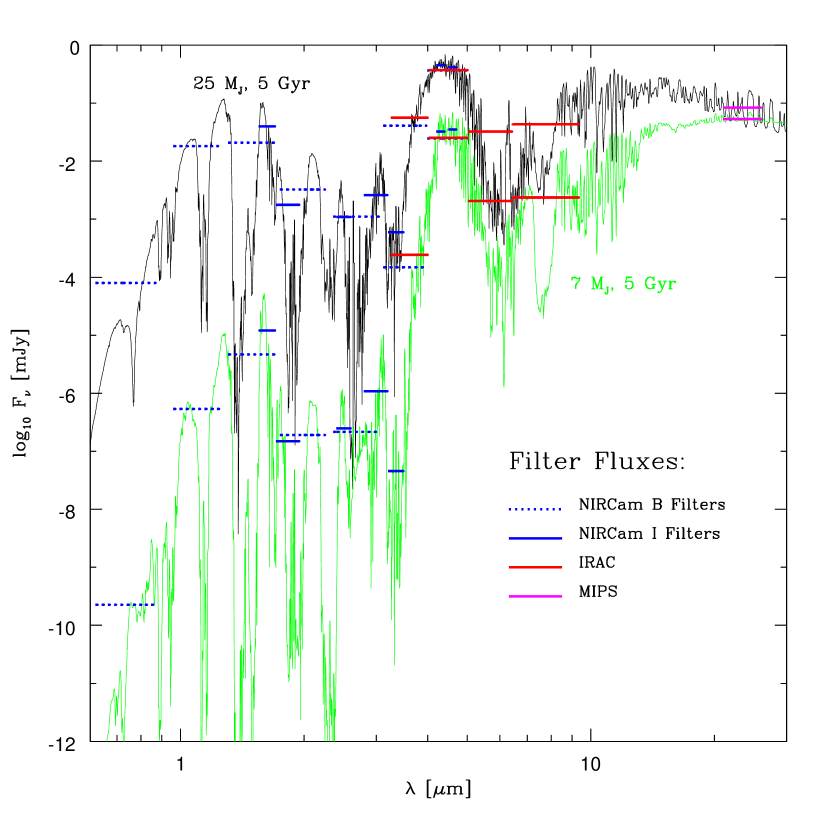
The prominence of water features provides a guide to the optimal placement of NIRCam filters for the detection and characterization of brown dwarfs. For example, the water feature near 0.93 m is missed by the B filters, while those features at 1.4 and 1.8 m are not centered on the respective adjacent filters and, hence, are diluted by the adjoining continuum. The I filters on NIRCam would partially overcome these limitations. Even so, as Fig. 12 shows, the broadband fluxes in the NIRCam filters provide useful diagnostics of the differences among brown dwarfs and extrasolar giant planets (here expressed as mass at a given age), with particular sensitivity to the large flux differences between the 5-m window and the region shortward. A tunable filter could provide even greater diagnostic capability by permitting in and around the 5-m window a spectral resolution near 100 to more definitively characterize the effective temperature and, hence, the mass of detected objects (for a given age and composition). Nevertheless, Fig. 7 indicates that at 10 parsecs even a 7-object at 5 Gyr should easily be detected in imaging mode in the and bands. In the band, a 2-object could be seen by NIRCam out to 100 parsecs. Furthermore, a 25-object at 5 Gyr and a distance of 1000 parsecs should be detectable by NIRCam in a number of its current broadband filters.
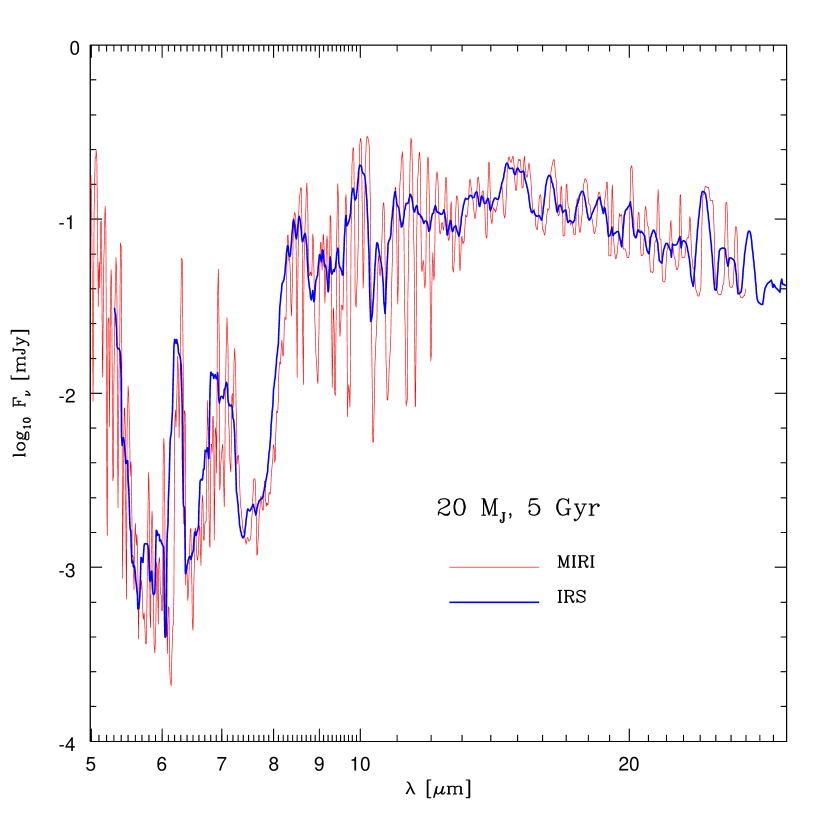
Figure 13 shows predicted spectra of a 20-/5-Gyr model in the mid-infrared for the SIRTF/IRS and JWST/MIRI instruments. To generate the SIRTF/IRS curve in Fig. 13, we multiplied the theoretical spectra by the IRS response curves for the entire wavelength range, not just the 5-14 m of the “Short-low” module. The IRS spectral resolution has been assumed to be 100, while that of JWST/MIRI is 1000. We find that the IRS spectra are useful at 10 parsecs only for the warmer brown dwarfs ( ), but for these brown dwarfs even at this modest spectral resolution one can clearly identify the various dominant molecular bands.
In its broadband detection (imaging) mode, JWST/MIRI will be 100 times more capable than SIRTF from 5 m to 27 m (§5). Since the mid-IR is one of the spectral regions of choice for the study of the coolest brown dwarfs, MIRI will assume for their characterization a role of dramatic importance. At wavelengths longward of 15-m , MIRI will be able to detect objects 10 parsecs away down to 2 or lower. In addition, it could detect an object just 10 times the mass of Jupiter with an age of 5 Gyr out to a distance of one kiloparsec. Furthermore, JWST/MIRI provides 10 times better spectral resolution than SIRTF/IRS for objects down to 10 .
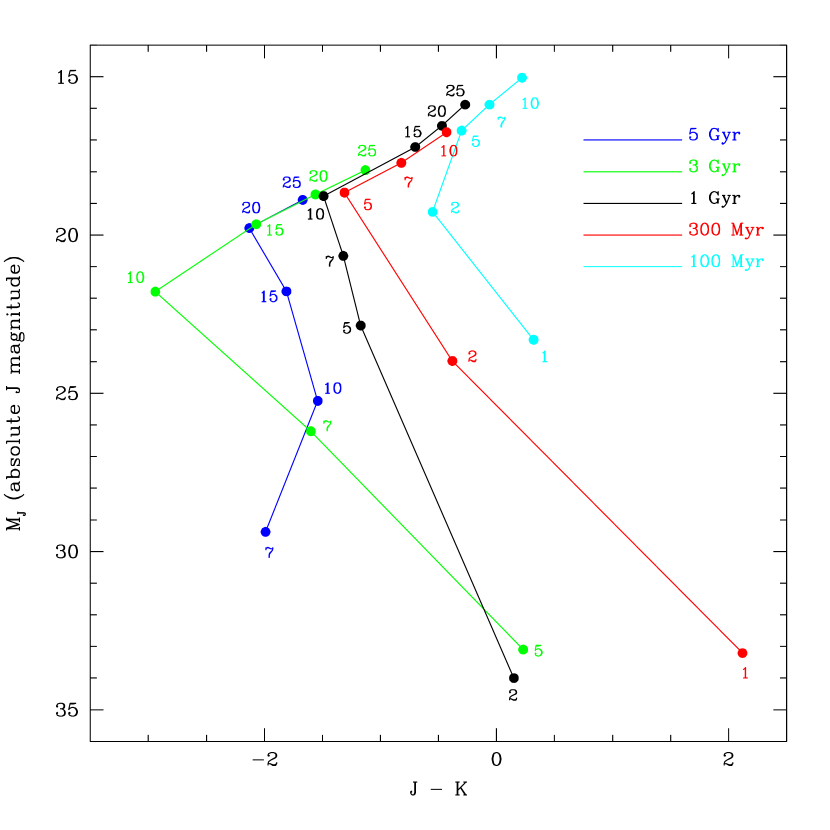
Figs. 6 through 13 collectively summarize the flux spectra and evolution of the cool brown dwarfs yet to be discovered, as well as the extraordinary capabilities of the various instruments on board both SIRTF and JWST for the diagnosis and characterization of their atmospheres. These figures highlight the prominent molecular features of H2O, CH4, NH3, in particular, that are pivotal in the evolution of the differences between the coolest brown dwarfs and the known T dwarfs, most of which are at higher Tand gravities. The latest known T dwarf has been typed a T8 (Burgasser et al. 2000a), but its effective temperature is near 750-800 K (Geballe et al. 2001; Burrows et al. 2002). This does not leave much room for the expansion of the T dwarf subtypes to the lower Tand masses discussed in this paper, and suggests that yet another spectroscopic class beyond the T dwarfs might be called for. Many of the spectral trends described in this paper are gradual, but the near disappearance of the alkali features below T= 500 K, the onset of water cloud formation below T= 400-500 K, the collapse below 350 K of the optical and near-IR fluxes relative to those longward of 5 m , and the growing strengths of the NH3 features all suggest physical reasons for such a new class. Figure 14 depicts isochrones from 100 Myr to 5 Gyr on the versus color-magnitude diagram and demonstrates that the blueward trend in that so typifies the T dwarfs stops and turns around (Marley et al. 2002; Stephens, Marley, and Noll 2001) between effective temperatures of 300 and 400 K. This is predominantly due not to the appearance of water clouds, but to the long-expected collapse of flux on the Wien tail. Note that the Tat which the color turns around is not the same for all the isochrones. This is because the colors are not functions of just T, but of gravity as well. The decrease in T, that for the T dwarfs squeezes the -band flux more than the -band flux, finally does to what people had expected such a decrease to do before the discovery of T dwarfs, i.e., redden the color. We remind the reader that unlike M dwarfs, the colors of T dwarfs actually get bluer with decreasing T(for a given surface gravity). This may be counterintuitive, but it is a result of the increasing role of methane and H2 collision-induced absorption with decreasing temperature, as well as the positive slope of the opacity/wavelength curve of water and its gradual steepening with decreasing temperature.
Were it not for the extremely low fluxes at such low Tshortward of 4 microns, we might have suggested the use of this turnaround to mark the beginning of a new spectroscopic class. Moreover, clearly the optical can not be used and with the diminishing utility of the near infrared as Tdrops, that leaves the mid-IR longward of 4 m as the most logical part of the spectrum with which to characterize a new spectroscopic class. As is usual, this will be determined observationally, and it might be done arbitrarily to limit the growth of the T sequence. Nevertheless, we observe that the Tregion between 300 K and 500 K witnesses a few physical transitions that might provide a natural break between “stellar” types.
7 Conclusions
We have generated a new set of brown dwarf spectral models that incorporate state-of-the-art opacities and the effects of water clouds. Our focus has been on the low-Tbranch of the brown dwarf tree beyond the known T dwarfs. To this end, we have investigated the Trange from 800 K to 130 K and the low-mass range from 25 to 1 . As Fig. 1 indicates, this is mostly unexplored territory. Our calculations have been done to provide a theoretical foundation for the new brown dwarf studies that will be enabled by the launch of SIRTF and the eventual launch of JWST, as well as for the ongoing ground-based searches for the coolest substellar objects. We provide spectra from 0.4 m to 30 m , investigate the dependence on age and mass of the strengths of the H2O, CH4, and NH3 molecular features, address the formation and effect of water clouds, and compare the calculated fluxes with the suggested sensitivities of the instruments on board SIRTF and JWST. From the latter, detection ranges can be derived, which for JWST can exceed a kiloparsec. We find that the blueward trend in near-infrared colors so characteristic of the T dwarfs stops near a Tof 300-400 K and we identify a few natural physical transitions in the low-Trealm which might justify the eventual designation of at least one new spectroscopic type after the T dwarfs. These include the formation of water clouds (400-500 K), the strengthening of ammonia bands, the eventual collapse in the optical, the shift in the position of the band peak, the turnaround of the color, the near disappearance of the strong Na-D and K I resonance lines (500 K), and the increasing importance with decreasing Tof the mid-IR longward of 4 m . For these cooler objects, the mid-infrared assumes a new and central importance and first MIPS and IRS on SIRTF, then MIRI on JWST, are destined to play pivotal roles in their future characterization and study.
Finally, the formation of ammonia clouds below 160 K suggests yet another natural breakpoint, and a second new “stellar” class. Therefore, there are reasons to anticipate that perhaps two naturally defined, yet uncharted, spectral types reside beyond the T dwarfs at lower T.
The current filter set for JWST/NIRCam from 0.6 to 5.0 m is good, but not yet fully optimized for cool brown dwarf detection. Placing filters on the derived spectral peaks and troughs (robustly defined by the water bands) would improve its already good performance for substellar research. In any case, our theoretical spectra are meant to bridge the gap between the known T dwarfs and those cool, low-mass free-floating brown dwarfs with progressively more planetary features which may inhabit the galaxy in interesting, but as yet unknown, numbers.
References
- (1)
- (2) Ackermann, A. and Marley, M.S. 2001, ApJ, 556, 872
- (3) Allende-Prieto, C., Lambert, D.L., and Asplund, M. 2002, ApJ, 573, L137
- (4) Anders, E. and Grevesse, N. 1989, Geochim. Cosmochim. Acta, 53, 197
- (5) Bessell, M.S., and Brett, J. M. 1988, PASP, 100, 1134
- (6) Borysow, A. and Frommhold, L. 1990, ApJ, 348, L41
- (7) Borysow, A., Jørgensen, U.G., and Zheng, C. 1997, A&A, 324, 185
- (8) Burgasser, A.J., et al. 1999, ApJ, 522, L65
- (9) Burgasser, A.J., et al. 2000a, ApJ, 531, L57
- (10) Burgasser, A.J., Kirkpatrick, J. D., Reid, I. N., Liebert, J., Gizis, J. E., & Brown, M. E. 2000b, AJ, 120, 473
- (11) Burgasser, A.J., et al. 2000c, AJ, 120, 1100
- (12) Burrows, A., Marley M., Hubbard, W.B. Lunine, J.I., Guillot, T., Saumon, D. Freedman, R., Sudarsky, D. and Sharp, C.M. 1997, ApJ, 491, 856
- (13) Burrows, A. and Sharp, C.M. 1999, ApJ, 512, 843
- (14) Burrows, A., Marley, M. S., and Sharp, C. M. 2000, ApJ, 531, 438
- (15) Burrows, A., Hubbard, W.B., Lunine, J.I., and Liebert, J. 2001, Rev. Mod. Phys., 73, 719
- (16) Burrows, A., Burgasser, A.J., Kirkpatrick, J. D., Liebert, J., Milsom, J.A., Sudarsky, D., and Hubeny, I. 2002, ApJ, 573, 394
- (17) Burrows, A. and Volobuyev, M. 2003, ApJ, 583, 985
- (18) Cooper, C.S., Sudarsky, D., Milsom, J.A., Lunine, J.I., & Burrows, A. 2003, ApJ, 586, 1320
- (19) Delfosse, X., Tinney, C.G., Forveille, T., Epchtein, N., Bertin, E., Borsenberger, J., Copet, E., De Batz, B., Fouqué, P., Kimeswenger, S., Le Bertre, T., Lacombe, F., Rouan, D., and Tiphène, D. 1997, Astron. Astrophys. , 327, L25
- (20) Geballe, T.R., Saumon, D., Leggett, S.K., Knapp, G.R., Marley, M.S., and Lodders, K. 2001, ApJ, 556, 373
- (21) Grevesse, N., Sauval, A.J. 1998, Space Sci. Rev., 85, 161
- (22) Hubeny, I. 1988, Computer Physics Comm., 52, 103
- (23) Hubeny, I. 1992, in The Atmospheres of Early-Type Stars, ed. U. Heber & C. J. Jeffery, Lecture Notes in Phys. 401, (Berlin: Springer), 377
- (24) Hubeny, I. and Lanz, T. 1995, ApJ, 439, 875
- (25) Kirkpatrick, J.D., Reid, I.N., Liebert, J., Cutri, R.M., Nelson, B., Beichman, C.A., Dahn, C.C., Monet, D.G., Gizis, J., and Skrutskie, M.F. 1999, ApJ, 519, 802
- (26) Kirkpatrick, J. D., Reid, I. N., Liebert, J., Gizis, J. E., Burgasser, A. J., Monet, D. G., Dahn, C. C., Nelson, B., & Williams, R. J. 2000, AJ, 120, 447
- (27) Marley, M.S., Saumon, D., Guillot, T., Freedman, R.S., Hubbard, W.B., Burrows, A. & Lunine, J.I. 1996, Science, 272, 1919
- (28) Marley, M.S., Seager, S., Saumon, D., Lodders, K., Ackerman, A.S., Freedman, R., and Fan, X. 2002, ApJ, 568, 335
- (29) Martín, E. L., Delfosse, X., Basri, G., Goldman, B., Forveille, T., & Zapatero Osorio, M. R. 1999, AJ, 118, 2466
- (30) Mather, J.C. and Stockman, H.S. 2000, Proc. SPIE, 4013, p. 2-16 (JWST/NGST)
- (31) Oppenheimer, B.R., Kulkarni, S.R., Matthews, K., and Nakajima, T. 1995, Science, 270, 1478
- (32) Reid, I.N. 1994, Astrophys. and Space Sci., 217, 57
- (33) Saumon, D., Chabrier, G., and Van Horn, H.M. 1995, ApJS, 99, 713
- (34) Saumon, D., Geballe, T.R., Leggett, S.K., Marley, M.S., Freedman, R.S., Lodders, K., Fegley, B., and Sengupta, S.K. 2000, ApJ, 541, 374
- (35) Stephens, D., Marley, M.S., and Noll, K. 2001, in Ultracool Dwarfs: New Spectral Types L and T (Springer: Berlin, Heidelberg), edited by H.R.A. Jones and I.A. Steele, p. 183
- (36) Stiening, R., Skrutskie, M.F., and Capps, R. 1995, Bull. A.A.S., 187, 7508 (2MASS)
- (37) Strauss, M.A., et al. 1999, ApJ, 522, L61
- (38) Tsuji, T., Ohnaka, K., and Aoki, W. 1999, ApJ, 520, L119
- (39) Werner, M.W. and Fanson, J.L., Proc. SPIE, 2475, p. 418-427 (SIRTF)
- (40) Wright, E. and the NGSS team 2001, Bull. A.A.S., 198, 407
- (41)
| (K) | (cm s-2) | ||
|---|---|---|---|