theDOIsuffix \Volume324 \IssueS1 \CopyrightissueS1 \Month01 \Year2003 \pagespan3 \Receiveddate15 November 2002 \Reviseddate30 November 2002 \Accepteddate2 December 2002 \Dateposted3 December 2002
The Galactic Center stellar cluster: The central arcsecond111Based on observations at the Very Large Telescope (VLT) of the European Southern Observatory (ESO) on Paranal in Chile
Abstract.
With 10 years of high-resolution imaging data now available on the stellar cluster in the Galactic Center, we analyze the dynamics of the stars at projected distances from the central black hole candidate Sagittarius A* (Sgr A*). We find evidence for radial anisotropy of the cluster of stars surrounding Sgr A*. We confirm/find accelerated motion for 6 stars, with 4 stars having passed the pericenter of their orbits during the observed time span. We calculated/constrained the orbital parameters of these stars. All orbits have moderate to high eccentricities. The center of acceleration coincides with the radio position of Sgr A*. From the orbit of the star S2, the currently most tightly constrained one, we determine the mass of Sgr A* to M⊙ and its position to mas East and mas South of the nominal radio position. The data provide compelling evidence that Sgr A* is a single supermassive black hole.
keywords:
Galactic Center, Sagittarius A*, stellar dynamics, black holepacs Mathematics Subject Classification:
04A251. Introduction
Because of its proximity the center of the Milky Way offers the unique opportunity to study phenomena in detail (on scales 1 pc) that are generally thought to occur in galactic nuclei. With the enigmatic radio and X-ray source Sagittarius A* (Sgr A*), our galactic center (GC) harbours a prime candidate for a supermassive black hole (for reviews on the GC see e.g. Genzel, Hollenbach, and Townes 1994; Morris and Serabyn 1996; Melia and Falcke 2001).
Near-infrared (NIR) imaging observations with speckle or adaptive optics (AO) techniques allow resolving the central stellar cluster with subarcsecond resolution. Since 1991, such observations were regularly carried out with the MPE SHARP (Hofmann et al. 1995) NIR speckle camera at the ESO NTT in La Silla, Chile (e.g. Eckart et al. 1992; Eckart et al. 1995). Stars are ideal test particles for measuring the gravitational potential because they are not subject to forces such as winds or magnetic fields. First proper motion measurements on the stars in the central few arcseconds by Eckart and Genzel (1997) showed that the gravitational potential in the GC is indeed dominated by a point mass of 3 million solar masses. These results were confirmed with an independent proper motion study by Ghez et al. (1998), who used the 10m-class Keck telescope. Subsequently, the first accelerations of stars near Sgr A* were found by Ghez et al. (2000) and Eckart et al. (2002). These observations set even tighter demands on the density of the central dark mass than the previously measured velocity dispersions and allowed to constrain the position of the dark mass via the projected acceleration vectors.
Here we report on an extensive analysis of the proper motions of stars within of Sgr A*, based on ten years of high resolution observations. We put special emphasis on the bright (K14) star S2 close to Sgr A*. Observations made in spring/summer 2002 during commissioning and science verification of the new NIR camera and adaptive optics system CONICA/NAOS (“NACO”) at the ESO VLT on El Paranal, Chile, allowed determining a unique keplerian orbit for that star. The orbital parameters put very tight constraints on the position and concentration of the central dark mass.
2. Observations and data reduction
In spring 2002, the new NIR camera and adaptive optics system CONICA/NAOS (“NACO”) was commissioned at the unit telescope 4 (Yepun) of the ESO 8m-class VLT on El Paranal, Chile. With its unique near-infrared wavefront sensor, this instrument is ideally suited for adaptive optics observations of the Galactic Center. While optical wavefront sensing can only be performed on a relatively weak guiding star away from Sgr A*, the bright mag supergiant IRS 7 at from Sgr A* can be used in a straightforward manner for wavefront corrections with NAOS.
Reaching Strehl ratios of up to 50% the NACO commissioning/science verification observations of the GC provided the deepest images of that region up to now. They also brought two extremely valuable contribitions to our proper motion program: First, the large field of view of CONICA enabled us to use 7 SiO maser stars for establishing an accurate astrometry relative to Sgr A* (Reid et al. 2003). Second, the observations covered the pericenter passage of the star S2 around Sgr A* with a tightly sampled time series.
For the present work we compiled GC observations from three different data sets: The NACO commissioning/science verification data from 2002, the Gemini North observatory Galactic Center Demonstration Science Data Set from the year 2000, and observations with the MPE-built NIR speckle imaging camera SHARP at the ESO NTT in La Silla, Chile, carried out between 1992 and 2002 (e.g. Eckart et al. 1995; Eckart et al. 2002).
Standard data reduction procedures, i.e. sky subtraction, dead/bad pixel masking, and flat-fielding, were applied to all the imaging data. From the SHARP speckle imaging data we selected by a mixed automatic/manual process a few hundred frames of highest quality for each epoch. Selection criterion was that the first diffraction ring around the dominant speckles of the brightest stars must be clearly visible in the speckle frames. Combining these frames of highest quality resulted in SSA images with Strehl ratios .
Iterative blind deconvolution (IBD, Jeffries and Christou 1993) was applied to the selected SHARP imaging data. As implementation of IBD, we used the publicly available IDAC program code, developed at Steward Observatory by Matt Chesalka and Keith Hege (based on the earlier Fortran Blind Deconvolution code - IDA - developed by Stuart Jefferies and Julian Christou). Gemini and NACO images were deconvolved with a Lucy-Richardson deconvolution. We obtained our final maps after restoring the deconvolved images with a beam of 100 mas (for SHARP and Gemini images) and mas (for NACO images) FWHM. For more details on data reduction and observations see Sch del et al. (2003) and Genzel et al. (2003).
3. Astrometry and proper motions
Reid et al. (2003) combined several epochs of VLA/VLBA data to measure the positions and proper motions of SiO maser stars in the GC. They determined the position of Sgr A* in NIR NACO images with an accuracy of 10 mas. Ott et al. (2003) used their results to obtain precise positions and proper motions for 1000 stars within 10′′ of Sgr A*. For the present work we established the astrometry via the positions and proper motions of 9 sources from the Ott et al. (2003) list. Errors on the stellar positions were determined by quadratically combining the error from measuring the (pixel) position of the stars in our maps with the error from the transformation into the radio astrometric system.
We determined proper motions by linear least square fits to the time series of stellar positions. Errors on the measured projected stellar velocities were generally . We found 6 stars with significant acceleration (deviation of from linear motion). Three of them, S1, S2, and S8 are well known from previous publications (Ghez et al. 2000; Eckart et al. 2002; Sch del et al, 2002). The other three sources, S12, S13, and S14, are fainter (15) sources, the proper motions of which could only be disentangled from the high confusion central stellar cluster with a sufficiently large data base such as presented here (see also Schoedel et al. 2003).
4. Radial anisotropy
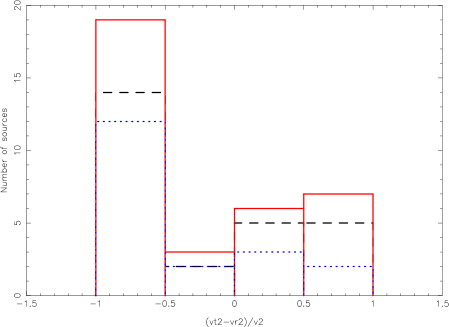
We examined the Sgr A* stellar cluster using as anisotropy estimator, where is the proper motion velocity of a star, and and its projected tangential and radial components. A value of signifies projected tangential motion, projected radial motion of a star. The properties of the anisotropy parameter are discussed in detail in Genzel et al. (2000). They show that an intrinsic three-dimensional radial/tangential anisotropy is reflected in the properties of the two-dimensional anisotropy estimator .
In Figure 1 we show a histogram of the parameter for different sub-samples (distance to Sgr A* , , and ) of our proper motion data for the epoch 2002.7. The projected velocities of the accelerated stars at this epoch were estimated by linear fits to sufficiently short parts of their trajectories. Repeating the anisotropy analysis for the epoch 1995.5 (where some of the stars had significantly different positions and velocities) does not change the distribution of counts in the histrograms significantly. The number of stars on projected radial orbits is above the number of stars on projected tangential orbits (taking Poisson errors). The number of stars on projected tangential orbits decreases significantly with decreasing distance to Sgr A*.
More proper motion data are needed in order to settle the question of anisotropy, but the present analysis presents a very intriguing result. Should the radial anisotropy of the Sgr A* cluster indeed be proven to be true with the larger proper motion samples expected from future observations, theoretical and modeling efforts will be needed to understand this property of the Sgr A* stellar cluster. As a bottom line, we want to point out that the general distribution of the anisotropy parameter definitely excludes a tangentially anisotropic cluster. A significant tangential anisotropy would be expected in systems with a binary black hole, where stars on radial orbits would be ejected or destroyed preferentially (see e.g. Gebhardt et al. 2002).
5. Stellar orbits
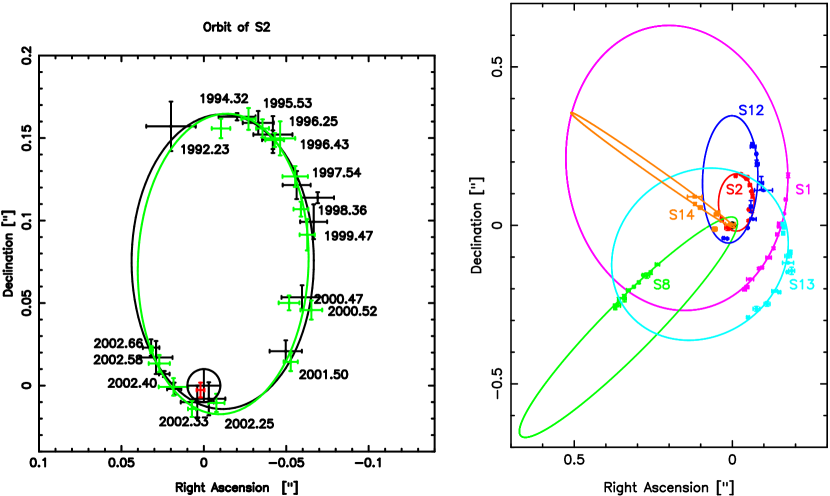
The NACO GC observations in spring/summer 2002 covered the pericenter passage of the star S2 around Sgr A* in a tightly sampled time series. Combining these observations with SHARP imaging data since 1992 (taken from Ott et al. 2003), Schoedel et al. (2002) determined a unique keplerian orbit for S2. In the left panel of Figure 2 we compare the orbit of S2 of Schoedel et al. (2002) with the orbit of S2 as determined in the present work. There are three important differences between the two analyses (see Sch del et al. 2003): (1) Here, the SHARP positions were obtained with different data reduction and analysis techniques (from a comparison with Ott et al. (2003) we estimated an overall systematic error of 3 mas). (2) Schoedel et al. (2002) measured the positions of S2 from one final shift-and-add image for each NACO epoch and estimated the errors conservatively. Here, the S2 position for each NACO observing epoch results from measurements on several tens of individual short-exposure NACO images, with the standard deviation taken as error. (3) We treated the projected position of the focus of the elliptical orbit as a free parameter in the fit (see Sch del et al. 2003).
The two analyses compare very well, with the determined orbital parameters agreeing within the errors. In our present analysis, we obtain a central mass of M⊙. The position of the acceleration center is offset a mere mas East and mas South of the nominal radio position of Sgr A*, i.e. clearly within the error circle of the radio measurement. This strongly supports the assumption that the dark mass is indeed coincident with Sgr A*. The orbit has an eccentricity of , an inclination of degrees, a period of years, a semi-major axis of mpc, and a pericenter distance of mpc.
Significant sections of the orbits were observed as well in the case of the stars S12 (pericenter passage in 1995.3) and S14 (pericenter passage in 1999.9). However, the constraints on their orbits from our data are not very tight. S14 is identical with the source S0-16 of A. Ghez et al. (priv. comm.), who first determined an orbit for this source. S14 is on an extremely eccentric () and highly inclined () orbit and approaches Sgr A* to within 0.4 mpc (S2: 0.6 mpc). In principle, its orbit would allow to constrain the central mass distribution even tighter than S2. Unfortunately, the uncertainty in the orbital parameters of S14 resulting from our data is too high for this purpose.
The orbital segments observed for the stars S1 (pericenter passage around 1999/2000), S8, and S13 are too small for determining a unique set of parameters for them, but we constrained them by using fixed values for the inclination angle (see Schoedel et al. 2003). Approximate values of the inclination of the orbital planes could be estimated from the measured acceleration of the stars and the well known mass of the central dark object (see Figure 3). We plot all analyzed six orbits in the right hand panel of Figure 2. All analyzed orbits have moderate to high eccentricities. Future measurements of orbital eccentricities of more stars near Sgr A* will allow testing for anisotropy of the central cluster (see Sch del et al. 2003).
6. Nature of the enclosed mass
With the measured proper motions within of Sgr A* we calculated Leonard-Merritt (LM, Leonard and Merritt 1989) estimates of the enclosed mass. In order to take the strongly variable velocity of the 6 stars with significant acceleration into account, we produced various velocity lists for the analysis, where we estimated the projected velocity of these stars at different epochs. From the diffrent lists, we obtain an average LM mass of M⊙ (for details see Sch del et al. 2003). This agrees well with the mass estimate from the orbit of S2.
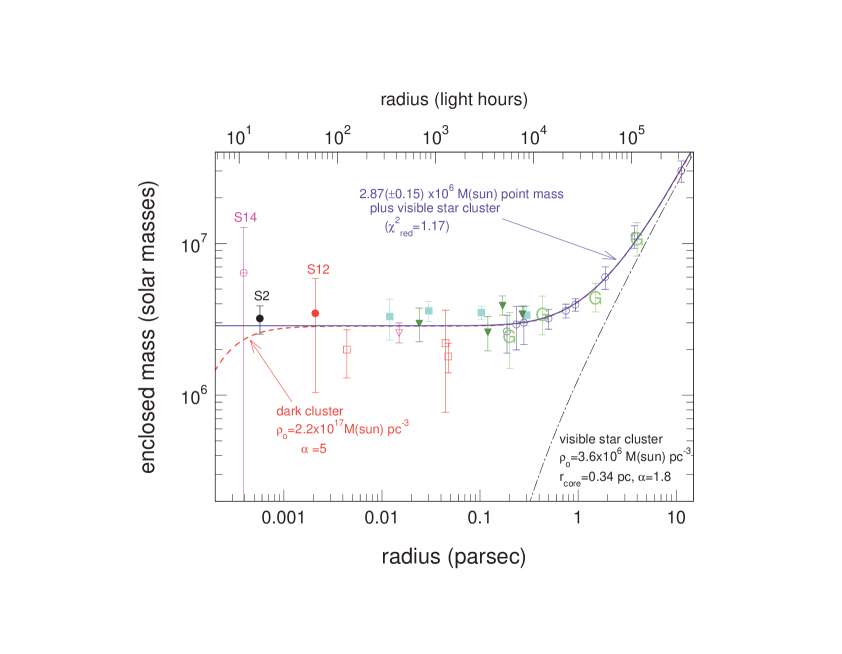
Figure 3 is a plot of the measured enclosed mass against distance from Sgr A*, in close analogy to Figure 17 of Genzel et al. (2000) and Figure 3 of Sch del et al. (2002). The data show that the central mass distribution is remarkably well described by the potential of a point mass over 3 orders of magnitude in spatial scale, from 0.8 light days to 2 light years. The contribution of the extended stellar cluster around SgrA* to the total mass cannot be more than mostly a few hundred solar masses within the peri-center distance of S2 (Mouawad et al. 2003). Fitting a model composed of a point mass plus the visible outer stellar cluster with a core radius of 0.34 pc and a power-law slope of to the data gives a value of M⊙ for the central dark mass. This agrees within the errors with the LM mass estimate of the innermost stars and with the masses calculated from the orbital parameters of S2 and S12. It is higher than the M⊙ given by Sch del et al. (2002), but the two values agree within their errors. The main differences of the present analysis to Sch del et al. (2002) are: (1) The error of the mass estimate from the orbit of S2 has been reduced by taking the position of the orbital focus explicitly into account. (2) The innermost LM mass estimate of Sch del et al. (2002) was based on the Ott et al. (2003) data. It has been replaced by the LM mass estimate from the present work, which is based on a more abundant data base in the region within of Sgr A*. (3) The LM mass estimates in Figure 3 of Sch del et al. (2002) and Figure 17 of Genzel et al. (2000) were corrected downward by 5-10% because they assumed a power-law slope of for the stellar cluster in the innermost few arcseconds. Here, we use a power-law slope of for the stellar cusp around Sgr A* (Genzel et al. 2003). This means that the LM mass estimates have previously been underestimated by 10% .
The orbit of S2 places very tight constraints on the distribution of the central dark mass: If the central point mass were replaced by a Plummer model cluster of dark astrophysical objects, its central mass density would have to exceed 2.2x10¹⁷M⊙pc-3, almost 5 orders of magnitude greater than previous estimates (Ghez et al. 1998, 2000; Genzel et al. 2000). The lifetime of such a hypothetical cluster would be years (Maoz 1998). An alternative model to supermassive black holes in galactic nuclei are balls of heavy, degenerate neutrinos (Tsiklauri and Viollier 1998; Munyaneza and Viollier 2002). In order to explain the whole mass range of dark central objects in galaxies with such a model, the neutrino mass cannot be higher than keV (Melia and Falcke 2001). However, the orbital parameters of S2 would demand a neutrino mass of keV in the case of the dark mass in the Galactic Center.
The only dark particle matter explanation that cannot be ruled out by the present data is a ball of bosons (Torres et al. 2000). However, it would be hard to understand how the bosons first manage to reach such a high concentration, and then avoid forming a black hole by accretion of the abundant gas and dust in the GC. We therefore conclude that the most probable form of the dark mass at the center of the Milky Way is a single, supermassive black hole.
We like to thank the ESO NTT team for their help and support during ten years of observations with the SHARP guest instrument.
We thank the NAOS and CONICA team members for their hard work, as well as the staff of El Paranal and the Garching Data Management Division for their support of the commissioning and science verification.
Based on observations obtained at the Gemini Observatory, which is operated by the Association of Universities for Research in Astronomy, Inc., under a cooperative agreement with the NSF on behalf of the Gemini partnership: the National Science Foundation (United States), the Particle Physics and Astronomy Research Council (United Kingdom), the National Research Council (Canada), CONICYT (Chile), the Australian Research Council (Australia), CNPq (Brazil) and CONICET (Argentina).
References
- [1] Chakrabarty, D. and Saha, P., Astron. J. 122, 232 (2001).
- [2] Eckart, A., Genzel, R., Krabbe, A., Hofmann, R., van der Werf, P.P., Drapatz, S., Nature 355, 526 (1992).
- [3] Eckart, A., Genzel, R., Hofmann, R., Sams, B.J., and Tacconi-Garman L.E., ApJ 445, L23 (1995).
- [4] Eckart, A. and Genzel, R., Mon.Not.R.Soc. 284, 576 (1997).
- [5] Eckart, A., Genzel, R., Ott, T., and Sch del, R., Mon.Not.R.Soc. 331, 917 (2002).
- [6] Gebhardt, K., Richstone, D., Tremaine, S., Lauer, T.R., Bender, R. et al., astro-ph/0209483 (2002).
- [7] Genzel, R. and Townes, C.H., Annu.Rev.Astron.Astrophys. 25, 377 (1987).
- [8] Genzel, R., Hollenbach, D., and Townes, C.H., Rep. Prog. Phys. 57, 417 (1994).
- [9] Genzel, R., Thatte, N., Krabbe, A., Kroker, H., and Tacconi-Garman, L.E., ApJ 472, 153 (1996).
- [10] Genzel, R., Pichon, C., Eckart, A., Gerhard, O.E., and Ott, T., Mon.Not.R.Soc. 317, 348 (2000).
- [11] Genzel, R., Hofmann, R., Lehnert, M., Ott, T., Sch del, R., Eckart, A., Alexander, T. et al., in preparation (2003).
- [12] Ghez, A., Klein, B.L., Morris, M., and Becklin, E.E., ApJ 509, 678 (1998).
- [13] Ghez, A., Morris, M., Becklin, E.E., Tanner, A., and Kremenek, T., Nature 407, 349 (2000).
- [14] Hofmann, R., Brandl, B., Eckart, A., Eisenhauer, F., Tacconi-Garman, L.E., Proc. SPIE 2475, 192 (1995).
- [15] Jeffries, S.M. and Christou, J.C., ApJ 415, 862 (1993).
- [16] Maoz, E., ApJ 494, L181 (1998).
- [17] Melia, F. and Falcke, H., Annu.Rev.Astron.Astrophys. 39, 309 (2001).
- [18] Morris, M. and Serabyn, E., Annu. Rev. Astron. Astrophys. 34, 645 (1996).
- [19] Mouawad, N., Eckart, A., Pfalzner, S., Straubmeier, C., Spurzem, R., Genzel, R., Ott, T., and Sch del, R., 2003, in preparation.
- [20] Munyaneza, F. and Viollier, R.D., ApJ 564, 274 (2002).
- [21] Ott, T., Genzel, R., Sch del, R., and Eckart, A., in preparation (2003).
- [22] Reid, M.J., Menten, K.M., Genzel, R., Ott, T., Sch del, R., and Eckart, A., ApJ, in press, (2003).
- [23] Sch del, R., Ott, T., Genzel, R., Hofmann, R., Lehnert, M., Eckart, A., et al., Nature 419, 694 (2002).
- [24] Sch del, R., Genzel, R., Ott, T., Eckart, A., Mouawad, N., and Alexander, T., in preparation (2003).
- [25] Tsiklauri, D. and Viollier, R.D., ApJ 500, 591 (1998).