Hubble Space Telescope observations of globular cluster systems along the Hubble sequence of spiral galaxies
Abstract
We have studied the globular cluster systems of 7 giant, edge-on spiral galaxies using Hubble Space Telescope imaging in and . The galaxy sample covers the Hubble types Sa to Sc, allowing us to study the variation of the properties of globular cluster systems along the Hubble sequence. The photometry reaches 1.5 mag beyond the turn-over magnitude of the globular cluster luminosity function for each galaxy. Specific frequencies of globular clusters ( values) were evaluated by comparing the numbers of globular clusters found in our WFPC2 pointings with those in our Milky Way which would be detected in the same spatial region if placed at the distance of the target galaxies. Results from this method were found to be consistent with the more commonly used method of constructing radial distribution functions of globular clusters. The values of spirals with (i.e., spirals with a Hubble type later than about Sb) are consistent with a value of . We suggest that this population of globular clusters represents a ‘universal’, old halo population that is present around each galaxy. Most galaxies in our sample have values that are consistent with a scenario in which globular cluster systems are made up of (i) the aforementioned halo population plus (ii) a population that is associated with bulges, which grows linearly with the mass of the bulge. Such scenarios include the ‘merger scenario’ for the formation of elliptical galaxies as well as the ‘multi-phase collapse’ scenario, but it seems inconsistent with the ‘secular evolution’ scenario of Pfenniger & Norman (1990), in which bulges are formed from disc stars by means of the redistribution of angular momentum through bar instabilities and/or minor perturbations. However, there is one bulge-dominated spiral galaxy in our sample (NGC 7814) with a low value that is consistent with those of the latest-type spirals. This means that the ‘secular evolution’ scenario can still be viable for some bulge-dominated spirals. Thus, our results suggest that the formation histories of galaxy bulges of early-type spirals can be significantly different from one galaxy to another.
keywords:
galaxies: spiral – galaxies: formation – galaxies: star clusters1 Introduction
Recent observations with the Hubble Space Telescope (HST) and large-field ground-based CCD cameras have caused rapid advances in our knowledge of the formation and evolution of globular cluster (GC) systems of galaxies. However, ellipticals and S0 galaxies have received by far the largest amount of attention, mainly because early-type galaxies usually have much richer GC systems and also suffer less from internal extinction problems than do spirals. Consequently, our knowledge of the GC systems in spiral galaxies is still limited to a handful of galaxies (e.g., Harris 1991; Ashman & Zepf 1998; Kissler-Patig et al. 1999). However, it should be recognized that this scarcity of data for spiral galaxy GC systems constitutes an important limitation to the use of GC systems as probes of the formation and evolution of both early-type and late-type galaxies.
For instance, the ability to test predictions of scenarios for the formation of galaxies and their GCs depends on our knowledge of the ‘typical’ properties of GC systems of spirals. A good example is the ‘merger model’ (Schweizer 1987; Ashman & Zepf 1992), in which elliptical galaxies are formed by mergers of spiral galaxies. In this picture, the GC systems of elliptical galaxies are composite systems. One population of GCs is associated with the progenitor spirals (i.e., metal-poor GCs with a halo-like spatial distribution), while a second population of clusters forms in the merger event (i.e., metal-rich GCs with a bulge-like spatial distribution). Ashman and Zepf (1992; 1998) described several testable predictions arising from this scenario, most of which are however based on comparisons with properties of ‘typical’ spiral galaxy GC systems. A particular problem in this respect is that the characteristic specific frequency of GCs (i.e., the total number of GCs per unit galaxy luminosity) around spirals is poorly known, especially for late-type spirals (e.g., the compilation of Ashman & Zepf 1998 includes specific frequency measurements for only 5 spirals with Hubble type Sb or later). The absence of firm constraints on the number of GCs contributed by the progenitor spirals leads to uncertainties in many of the key predictions for elliptical galaxy GC systems that follow from the merger model. Furthermore, metal-rich () GCs are known to be associated with bulges of spiral galaxies like the Milky Way and M31 rather than with their discs or halos (Minniti 1995; Barmby, Holland & Huchra 2001; Forbes, Brodie & Larsen 2001), so that mergers of spirals containing significant bulges are likely to contribute metal-rich GCs to the merger remnant which are not formed during the merger. It is therefore very important to establish —using a significant sample of spiral galaxies— whether or not the properties of the Milky Way (MW) GC system are typical of spiral galaxy GC systems as a class, and to study the relationship between bulge luminosity and the number of metal-rich GCs in spiral galaxies.
Another important and timely area where knowledge of the properties of GC systems of spirals can yield significant progress is that of the formation and evolution of bulges of spiral galaxies. On the one hand, structural and dynamical properties of spiral bulges have long shown strong similarities with those of (low-luminosity) elliptical galaxies. Bulges follow the Fundamental Plane of elliptical galaxies (e.g., Bender, Burstein & Faber 1992), while their internal dynamics are consistent with oblate, isotropic models, just like low-luminosity ellipticals (e.g., Davies et al. 1983). Extinction-corrected optical and near-IR colours of bulges have been shown to be very similar to those of elliptical galaxies in the Coma cluster (Peletier et al. 1999), and spectroscopic metallicities and [Mg/Fe] ratios in bulges are similar to those of ellipticals at a given bulge luminosity (Goudfrooij, Gorgas & Jablonka 1999). As ellipticals in rich clusters most likely formed at redshift (e.g., Stanford, Eisenhardt & Dickinson 1997), these similarities argue for an early formation of bulges, in line with the original ‘monolithic collapse’ model by Eggen, Lynden-Bell & Sandage (1962). An alternative (and quite different) model is that bulges form from disc material through redistribution of angular momentum (Pfenniger & Norman 1990). In this scenario, large amounts of gas are driven into the central region of the galaxy by a stellar bar and trigger intense star formation. If enough mass is accreted, the bar itself will dissolve and the resulting galaxy will reveal a bigger bulge than before bar formation; galaxies would thus evolve from late to earlier types along the Hubble sequence (see also Pfenniger, Combes & Martinet 1994). Note that this scenario does not involve GCs, in that only disc stars would contribute to the secular building of bulges. Hence, there would be no reason for a relation between the bulge-to-total luminosity ratio and the number of GCs per galaxy in this scenario. This provides a testable prediction, and is one of the key tests performed in the present study.
2 Approach
2.1 Galaxy sample selection
The sample consists of spiral galaxies in an edge-on configuration. We selected such galaxies in order to enable detection of GCs on both sides of the spiral discs and to minimize (spatially) the impact of dust absorption. In addition, the edge-on configuration allows one to assess radial number density distributions of the GC systems around these galaxies. Northern galaxies were selected from the Uppsala General Catalogue (UGC; Nilson 1973), while southern galaxies were selected from the Surface Photometry Catalogue of ESO-Uppsala Galaxies (ESO-LV; Lauberts & Valentijn 1989). Our two first-cut selection criteria were:
-
•
the inclination of the galaxy , and
-
•
The Galactic latitude 30∘.
Inclinations were determined following Guthrie (1992), assuming an intrinsic flattening . Inclinations were then derived using Hubble’s (1926) formula
where is the observed (catalogued) axis ratio.
In order to get the highest observing efficiency out of the HST observations (see below), we further considered two main (and mutually counteracting) factors. On the one hand, a galaxy should be near enough to reach , which is 1.5 magnitudes beyond the peak in the Galactic GC luminosity function (hereafter GCLF; Harris 1996), in a few HST orbits using WFPC2. On the other hand, a galaxy should be distant enough for a significant fraction of its GC system to fit in the field of view of one or two WFPC2 exposures.
From the remaining list of candidate spirals, we selected 2-3 galaxies of each main Hubble type (Sa, Sb, and Sc) to study the variation of the properties of GC systems as a function of Hubble type (i.e., of bulge-to-total luminosity ratio). Global properties of the final sample galaxies are given in Table 1.
| Galaxy | NGC 3628 | NGC 4013 | NGC 4517 | NGC 4565 | NGC 4594 | IC 5176 | NGC 7814 | Reference(s) |
| RA (J2000) | 11h20m169 | 11h58m313 | 12h32m456 | 12h36m208 | 12h39m594 | 22h14m553 | 00h03m149 | 1 |
| DEC (J2000) | 13∘35′20′′ | 43∘56′49′′ | 00∘06′48′′ | 25∘59′16′′ | 11∘37′23′′ | 66∘50′56′′ | 16∘08′44′′ | 1 |
| Type (RSA) | Sb | Sb | Sc | Sb | Sa | Sbc | Sab | 2 |
| Type (T) | 3.1 | 3.0 | 6.0 | 3.2 | 1.1 | 4.3 | 2.0 | 2 |
| 9.48 | 11.23 | 10.39 | 9.58 | 8.00 | 12.12a | 10.57 | 2 | |
| 8.77 | 10.52 | 9.36 | 8.58 | 7.55 | 11.07a | 10.14 | 2b | |
| 0.79 | 0.96 | 0.71 | 0.84 | 1.07 | 0.90a | 0.96 | 2 | |
| 851 | 875 | 874 | 865 | 840 | 865 | 830 | 10 | |
| 0.087 | 0.054 | 0.077 | 0.050 | 0.166 | 0.100 | 0.144 | 3c | |
| 843 | 831 | 1131 | 1229 | 1091 | 1746 | 1053 | 1 | |
| 29.80 | 31.35 | 31.00 | 30.06 | 29.75 | 32.16 | 30.60 | 4,5,6,7,8,4,9d | |
| 21.03 | 20.83 | 21.64 | 21.48 | 22.20 | 21.09 | 20.46 | b,e | |
| 0.36 | 0.27 | 0.02 | 0.30 | 0.73 | 0.34 | 0.86 | 10,10,11f,12,13,10,14d | |
| Disc | 258 | 84 | 166 | 54 | 10,10,–,12,–,10,– | |||
| Bulge | 57 | 99 | 509 | 322 | –,10,11,–,13,–,14d | |||
| Bulge | 227 | 207 | 39 | 10,–,–,12,–,10,–d | ||||
| Bulge | 381 | 57 | 99 | 347 | 509 | 65 | 322 | h |
Notes. a: From Lyon Extragalactic Database (LEDA; http://leda.univ-lyon1.fr). b Corrected for both internal and foreground reddening. c: Galactic foreground extinction only. d: References are given in galaxy order. e Derived from the above values. f Corrected value (see Section 3.2.2). g All bulge radii are expressed in terms of the equivalent radius of an ellipse (see text). h Assumed half-light radius for the bulge (see Section 3.2.2). Equal to either or , depending on whether the radial light profile is fit better with or with exponential profile. References: (1) NASA/IPAC Extragalactic Database (NED); (2) de Vaucouleurs et al. (1991; hereafter RC3); (3) Schlegel et al. (1998); (4) Willick et al. (1997; using Tully-Fisher relation (TF)); (5) Tully & Pierce (2000; using TF); (6) Ferrarese et al. (2000; using Cepheids); (7) Jacoby, Ciardullo & Harris (1996; using a variety of methods); (8) Ford et al. (1996; using Planetary Nebula Luminosity Function); (9) Tonry et al. (2001; using Surface Brightness Fluctuations); (10) this paper; (11) Gavazzi et al. (2000); (12) Wu et al. (2002); (13) Baggett, Baggett & Anderson (1998); (14) Bothun, Harris & Hesser (1992).
2.2 Observations
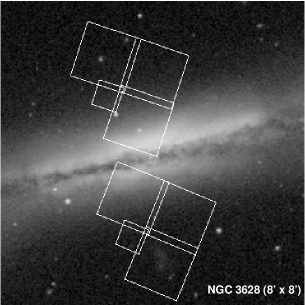
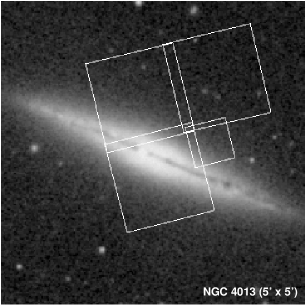
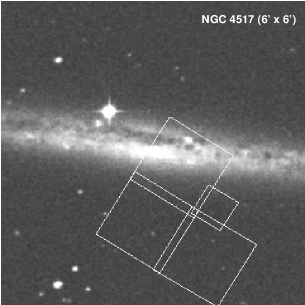
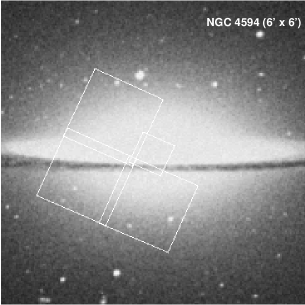
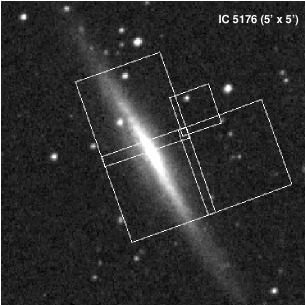
Observations were made with the Wide Field and Planetary Camera 2 (WFPC2) aboard HST as part of General Observer program 6685. The data consist of multiple images through the F555W and F814W filters. Our program was supplemented by archival images of a few sample galaxies (NGC 4565 and NGC 4594), taken from other HST programs. The images of NGC 4565 were not reanalyzed; all relevant data on GC candidates in that galaxy was taken from Kissler-Patig et al. (1999). The HST observations are listed in Table 2 together with the exposure times for each galaxy. For a few galaxies, a subset of the images were spatially offset by 05 from the others (corresponding to an approximately integer pixel shift in both PC and WF CCDs of the WFPC2) to enable a good correction for hot pixels. The locations of the WFPC2 fields are shown in Fig. 1, superposed onto grey-scale images from the Digital Sky Survey.
2.3 Data reduction and photometry
We used the iraf111iraf is distributed by the National Optical Astronomy Observatories, which is operated by the Association of Research in Astronomy, Inc., under cooperative agreement with the National Science Foundation, U.S.A. package for data reduction. After standard pipeline processing and alignment of the images, we combined the images using the IRAF/STSDAS task crrej, thereby effectively removing both cosmic rays and hot pixels. We also trimmed each image to exclude the obscured regions near the pyramid edges of WFPC2, yielding 751 751 usable pixels per CCD. Prior to performing source photometry, the strongly varying galaxy background was fitted and subtracted. The main reason for this is to minimize errors in the photometry due to any particular choice of object aperture and sky annulus. For the CCD chips covering a significant part of the galaxies’ bulges or dusty discs, we applied a median filter with a 30 30 pixel kernel to approximate the galaxy background. For the other CCDs, the smooth background gradient was fitted by a bi-cubic spline fit.
The photometry of star cluster candidates was carried out using the daophot-ii [1987] package within iraf. The objects were selected by applying the daofind task to an image prepared by dividing the data image in question by the square root of the appropriate model image (created as described in the previous paragraph). This procedure ensures uniform shot noise characteristics over the whole image. We adopted fairly tight shape constraints [0.6 roundness 0.6; 0.2 sharpness 0.9] in order to exclude extended background galaxies and faint objects distorted by noise or any residual bad pixels. The detection threshold was set at 4 sigma above the residual background. Although daofind returned with apparent point-like detections located within – or on the edge of – dust features in the galaxy discs, we decided to exclude those from further analysis due to the difficulty in judging the location of those sources relative to the dust features along the line of sight.
PSF photometry was performed using the ALLSTAR routine. For each chip, a PSF was constructed using, when possible, 10-15 bright, isolated GCs in the field. Aperture corrections were calculated using growth curve analysis on a subset of the PSF objects on each chip. One advantage of PSF photometry over the commonly-used two-pixel aperture photometry is that it avoids the systematic photometric offset due to underestimating aperture corrections for bright, resolved GCs.
| Galaxy | HST | Filter | Exp. | N | Comments |
|---|---|---|---|---|---|
| Program | Name | Time (s) | |||
| NGC 3628 | 6685 | F555W | 400 | 2x4 | b,c |
| F814W | 640 | 2x4 | b,c | ||
| NGC 4013 | 6685 | F555W | 800 | 4 | c |
| F814W | 1100 | 2 | |||
| NGC 4517 | 6685 | F555W | 400 | 4 | c |
| F814W | 640 | 4 | c | ||
| NGC 4565 | 6092 | F450W | 600 | 2x3 | b,c |
| F814W | 480 | 2x3 | b,c | ||
| NGC 4594 | 5512 | F547M | 1340 | 4 | |
| F814W | 1470 | 6 | |||
| IC 5176 | 6685 | F555W | 800 | 2 | |
| F814W | 1200 | 2 | |||
| NGC 7814 | 6685 | F555W | 600 | 2 | |
| F814W | 600 | 2 |
Notes. a: Number of exposures; b: 2 WFPC2 pointings (exp. times listed are per pointing); c: Integer-pixel dithered data.
One of the main sources of uncertainty in WFPC2 photometry (in general) is due to charge-transfer efficiency (CTE) problems of the CCDs for which correction recipes are available (Whitmore, Heyer & Casertano 1999; Dolphin 2000). We applied the Whitmore et al. formulae to our photometry. However, in the present case of GC photometry on a relatively high background (due to the diffuse galaxy light), the CTE correction typically affected the magnitudes by less than 0.02 mag and the colours by less than 0.01 mag, negligible for the purposes of this paper.
2.4 Cluster candidate selection
To select candidate GCs, we adopted a fairly generous selection criterion for the colour cut: . The lower limit was set to 0.2 mag bluer than the bluest GC in the Milky Way, while the upper limit was set to prevent the exclusion of somewhat reddened objects (see the bottom right panel of Fig. 2). For NGC 4594, the GCs are clearly discernable on the colour-magnitude diagram (CMD; see below), so we were able to set a more stringent colour cut: . We also applied a brightness cut, eliminating GC candidates brighter than G1, the most luminous M31 GC (, Rich et al. 1996).
To avoid complications related to excessive reddening, we excluded candidates lying within the dust lanes of their parent galaxies. Since this normally accounted for only a small fraction () of the total detected cluster population, this should have minimal effects on our global conclusions. However, we have attempted to correct this bias in the same manner as for our incomplete spatial coverage of the target galaxies (see below).

versus CMDs for the candidate GCs in five of our program galaxies222For the CMDs and the photometry tables of the GCs in NGC 4565 and NGC 4594, we refer to Kissler-Patig et al. (1999) and Larsen, Forbes & Brodie (2001), respectively are shown in Fig. 2, together with that of the GC system of the Milky Way as a comparison. One rather unusual finding in this context is that the CMD of NGC 4517 reveals a relatively large number of GC candidates with , which is bluer than Galactic GCs. However, the sizes of all these candidates (which are located on the WF chips of WFPC2) are fully consistent with GCs at the distance of NGC 4517. Hence we choose to retain those sources as GC candidates. Spectroscopy will be needed to confirm the nature of these sources.
3 Results: Properties of the globular cluster systems
3.1 The total number of globular clusters
The method we used to estimate the total number of GCs in the target galaxies was to make corrections for (i) contamination by Galactic foreground stars and (ii) spatial coverage. The latter was done by comparing the target GC systems to that of the Milky Way, as detailed below.
3.1.1 Correction for Galactic foreground stars
First, our estimates were corrected for foreground contamination, which was estimated from Galactic models (Bahcall & Soneira 1981). The predicted star counts at the Galactic latitude and longitude of each of the sample galaxies were subjected to the same colour and brightness cuts as the GC candidates and then subtracted from their respective bins. The total number of contaminating stars passing these criteria was small, generally stars per pointing.
3.1.2 Correction for completeness
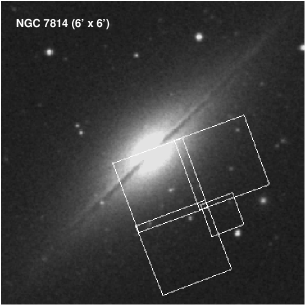
Artificial star experiments were performed by using the daophot-ii task addstar to estimate the completeness of the finding algorithm. These were carried out in the usual fashion, using artifical GCs generated from the PSFs constructed during the photometry measurements. These ‘fake’ GCs were added in groups of 100 in randomly placed positions on each chip. For the WF chips, the 50% completeness level was generally 1.0 – 1.5 mag beyond the turnover of the GC luminosity function (GCLF), ensuring accurate determination of the turnover point and dispersion of the GCLF. The WF-chip completeness functions are shown in Fig. 3. For each magnitude bin and each galaxy, a completeness fraction was calculated, and the number of objects in the bin was divided by this number to produce a completeness-corrected value.
3.1.3 Extrapolation over the luminosity function
In preparation for the calculation of specific GC frequencies as defined by Harris & van den Bergh (1981), the total number of GCs is defined as twice the number of GCs brighter than the turnover magnitude of the GCLF, where the GCLF is assumed to be a Gaussian (in magnitude units). We therefore fitted the completeness-corrected GCLFs by a Gaussian with a standard deviation mag (Harris 1996; Whitmore 1997) and derived the total number of clusters from the Gaussian fit.
3.1.4 Correction for incomplete spatial coverage
To estimate the total number of GCs in each galaxy, we need to correct for the incomplete spatial coverage of our data. Since each pointing only covered part of the galaxy, an extrapolation over the entire galaxy was needed to estimate the total GC population. In the case of elliptical and S0 galaxies, this extrapolation is often done by evaluating the radial distribution of GCs within the observed radial extent of the galaxy. However, the low number statistics of GCs in most spiral galaxies does not allow this to be done accurately. Hence the correction for spatial coverage was done by means of a direct comparison to the positions of GCs in the Milky Way. Since this process has been described and illustrated in detail in Kissler-Patig et al. (1999), we will only summarize the process here.
We created a mask defined by our spatial coverage of each galaxy, and applied this mask to the Milky Way. By calculating the number of objects we would detect in the Milky Way mask, if placed at the distance of the target galaxy, we calculated the total number of GCs as follows:
where is the number of objects detected in the mask, and is the total number of GCs in the Milky Way. It should be noted that there are four different orientations of the mask that would preserve the position angle of the target galaxy (these can be seen as reflections of the mask across its horizontal or vertical axes). Our final value for was the average of the values of all four possible orientations, and the standard deviation of the four values was taken into account in the uncertainty of .
For this study, data regarding Milky Way GCs were taken from the McMaster catalog (Harris 1996), containing 141 GCs with appropriate () colour information. However, we adopted (van den Bergh 1999) as the total number of GCs in the Milky Way. The undetected Milky Way GCs are assumed to be behind the Galactic bulge. Since the scale lengths and scale heights of the thin discs of the sample galaxies are very similar to those of the Milky Way (e.g., Bothun, Harris & Hesser 1992; Morrison, Boroson & Harding 1994; Baggett, Baggett & Anderson 1998; Gavazzi et al. 2000; Wu et al. 2002), the counterparts of such GCs would not be detected in our observations either. We therefore assume that the percentage of obscured GCs is the same in all sample galaxies.
We calculated a statistical uncertainty of the total number of GC candidates calculated this way by considering Poisson errors in the observed number of GCs, Poisson errors in the average number of Milky Way GCs in the mask (averaged over the four different orientations), and errors in the number of contaminating foreground objects. Our final numbers for the total population of GC candidates are listed in Table 3.
3.1.5 Comparison with previous studies
A potential caveat of our method to correct for incomplete spatial coverage is the implicit assumption that the spatial distribution of the GCs in the sample galaxies is similar to that of the Milky Way globular cluster system. Hence a comparison with other methods is in order. Unfortunately, there have been only very few ground-based, wide-field studies of spiral galaxy GC systems, which is likely due to the complications discussed in the Introduction. Although this is slowly changing with the use of wide-field cameras on 4-m-class telescopes (Rhode & Zepf 2002), we can currently only make a useful comparison for one galaxy: NGC 7814, for which a previous (ground-based) study of the GC system was performed by Bothun et al. (1992). Bothun et al. found a much larger number of GC candidates than we did ( versus our ). From an inspection of our WFPC2 frames, we suspect that the different result is due to their counting method, which was based on object overdensities (relative to a background field) rather than colours and sizes. We find a large number of small galaxies in our WFPC2 field, which Bothun et al. (1992) likely counted along with ‘real’ GCs, while they were excluded from our GC candidate list. This once again illustrates HST’s unique power in discriminating GCs from small, nucleated galaxies.
A perhaps more useful comparison of our method with others can be done for the case of NGC 4594, for which Larsen et al. (2001) used the same HST data, but applied a different method: Larsen et al. constructed radial distribution functions of GCs to correct for incomplete spatial coverage. While that method might in principle be expected to produce more accurate results than the Milky Way mask method used here, it requires a large population of GCs to avoid complications related to small number statistics. (In our galaxy sample, this requirement is only met in the case of NGC 4594). In any case, a comparison of Larsen et al.’s results with ours is very encouraging: They find a total population of , compared to (statistical error only) in this study. Especially heartening in this respect is that NGC 4594 (the Sombrero galaxy) is a typical Sa galaxy, which might perhaps not be expected to have a GC system particularly similar to that of the Milky Way, an Sbc galaxy.
3.2 Cluster specific frequencies
Traditionally, the specific frequency of GCs in galaxies, , is defined as (Harris & van den Bergh 1981), i.e., the total number of GCs per unit galaxy -band luminosity (normalized to ). was introduced primarily for use in early-type (E and S0) galaxies, where there is little variation in stellar populations between individual galaxies. This is not necessarily the case for spirals, and indeed is generally known to increase along the Hubble sequence (going from late– to early-type). Averaging specific frequencies per Hubble type, the recent compilation of Ashman & Zepf (1998) supplemented by the study of two spiral galaxies by Kissler-Patig et al. (1999) yields for Sc spirals to for elliptical galaxies outside galaxy clusters (see Section 4). Zepf & Ashman (1993) attempted to account for differences in stellar mass-to-light ratios among galaxy Hubble types in a statistical sense by introducing a parameter (hereafter ) to be the number of GCs per unit stellar mass (10) of a galaxy. Conversion from luminosity to mass was achieved my assuming a characteristic value for each galaxy Hubble type.
| Galaxy | GCs | GCs | Total | Metal-rich GCs | Bulge | Metal-rich GCs | Bulge | |
|---|---|---|---|---|---|---|---|---|
| (detected) | (total) | (all radii) | (all radii) | () | () | |||
| (1) | (2) | (3) | (4) | (5) | (6) | (7) | (8) | (9) |
| NGC 3628 | 92 10 | 497 110 | 1.9 0.2 | 3.7 1.0 | 213 48 | 0.83 0.11 | —a | — |
| NGC 4013 | 69 8 | 243 51 | 1.1 0.3 | 2.2 0.7 | 95 20 | 0.44 0.18 | 3 3 | 0.06 0.06 |
| NGC 4517 | 62 8 | 270 60 | 0.6 0.2 | 1.4 0.5 | 81 18 | 0.18 0.16 | —b | — |
| NGC 4565 | 40 6 | 204 38c | 0.6 0.2 | 1.0 0.3 | 122 23 | 0.31 0.15 | 20 5d | 0.17 0.15 |
| NGC 4594 | 159 13 | 1270 308 | 1.7 0.6 | 3.6 1.1 | 691 167 | 0.91 0.27 | 429 214 | 0.77 0.44 |
| IC 5176 | 57 8 | 132 25 | 0.5 0.1 | 1.1 0.3 | 67 12 | 0.25 0.09 | 7 2d | 0.07 0.07 |
| NGC 7814 | 17 4 | 106 28 | 0.7 0.2 | 1.5 0.5 | 31 9 | 0.20 0.09 | 8 5 | 0.06 0.06 |
Notes. Column (1): Galaxy name. Column (2): Detected number of GC candidates in WFPC2 images of galaxy. Column (3): Total number of GC candidates around galaxy. Column (4): Total specific frequency of GC candidates. Column (5): -parameter as defined by Zepf & Ashman (1993) as the number of GCs per unit galaxy mass (in terms of 10). Column (6): Total number of metal-rich GCs ([Fe/H] ) around galaxy. Column (7): Total bulge specific frequency of metal-rich GC candidates. Column (8): Number of metal-rich GC candidates within 2 bulge half-light radii. Column (9): Bulge specific frequency of metal-rich GC candidates within 2 bulge half-light radii. Note a: Not measured due to too small spatial coverage of inner bulge. Note b: Bulge radius too small to find bulge GCs. Note c: Taken from Kissler-Patig et al. (1999). Note d: Number is twice the GC candidates found on the non-dusty side of the nucleus.
3.2.1 Total specific frequencies
The and values of the target galaxies are listed in Table 3, calculated using the absolute magnitudes given in Table 1 and the number of GCs derived in Section 3.1. The quoted uncertainties were derived by taking into account the random errors discussed above as well as an uncertainty of 0.2 mag in the (total) absolute, dereddened -band magnitudes of the galaxies. values were calculated by converting the galaxy luminosities to masses following Zepf & Ashman (1993), using values of 5.4, 6.1, and 5.0 for Sa, Sab-Sb, and Sbc-Sc galaxies, respectively (cf. Faber & Gallagher 1979). We note that the uncertainty in the distance of a galaxy has a negligible effect on the and values, since the change in the total number of GCs (due to a change in the physical area covered by the WFPC2 frames) is compensated by a similar change of the luminosity of the galaxy.
3.2.2 Bulge specific frequencies
As already mentioned in the Introduction, a view is emerging that inner metal-rich GCs in spiral galaxies may be associated with their bulges rather than with their (thick) discs. Ample evidence for this is available for the Milky Way and M 31, where the metal-rich GC systems show kinematics, metallicities, and spatial distributions matching those of the underlying bulge stars (Minniti 1995; Côté 1999; Barmby et al. 2001; Perrett et al. 2002). Such a physical association is also likely present for elliptical galaxies, where the spatial distribution of metal-rich GCs typically follows that of the spheroidal galaxy light distribution very closely, whereas the metal-poor GC system typically has a more extended distribution (e.g., Ashman & Zepf 1998 and references therein). If indeed this association can be confirmed for a large sample of spirals as well, it would provide an important causal link between the formation of a spheroidal stellar system and that of metal-rich GCs. A suggestion that this might be the case was recently provided by Forbes et al. (2001) who compared the GC systems of the Milky Way (an Sbc galaxy), M 31 (Sb), and M 104 (Sa). They argued that the “bulge specific frequency (bulge )” – which they defined as the number of metal-rich GCs within 2 bulge effective radii from the galaxy centres divided by the bulge luminosity (normalized to ) – was consistent among those three galaxies (bulge ), and similar to typical values for field elliptical galaxies as well.
Structural bulge properties and bulge-to-total luminosity ratios (hereafter ratios) for the sample galaxies are listed in Table 1. For NGC 4517, NGC 4565, NGC 4594 and NGC 7814, these numbers were taken from the literature (Gavazzi et al. 2000; Wu et al. 2002; Baggett, Baggett & Anderson 1998; Bothun, Harris & Hesser 1992, respectively). The bulge/disc decompositions for the other sample galaxies are described in Appendix A. For NGC 4013 and IC 5176, we used our own WFPC2 images (in the F555W band). For NGC 3628, we used the WIYN -band image published by Howk & Savage (1999) which was graciously made available to us. Among the sample galaxies, only the bulges of NGC 4013, NGC 4517, NGC 4594 and NGC 7814 were well fit by a de Vaucouleurs’ profile. The bulges of NGC 3628, NGC 4565 and IC 5176 were much better fit by an exponential profile. Half-light radii for the bulges of the latter galaxies were calculated as , where is the exponential scale length of the profile. The final half-light bulge radii of all sample galaxies are listed in the last row of Table 1.
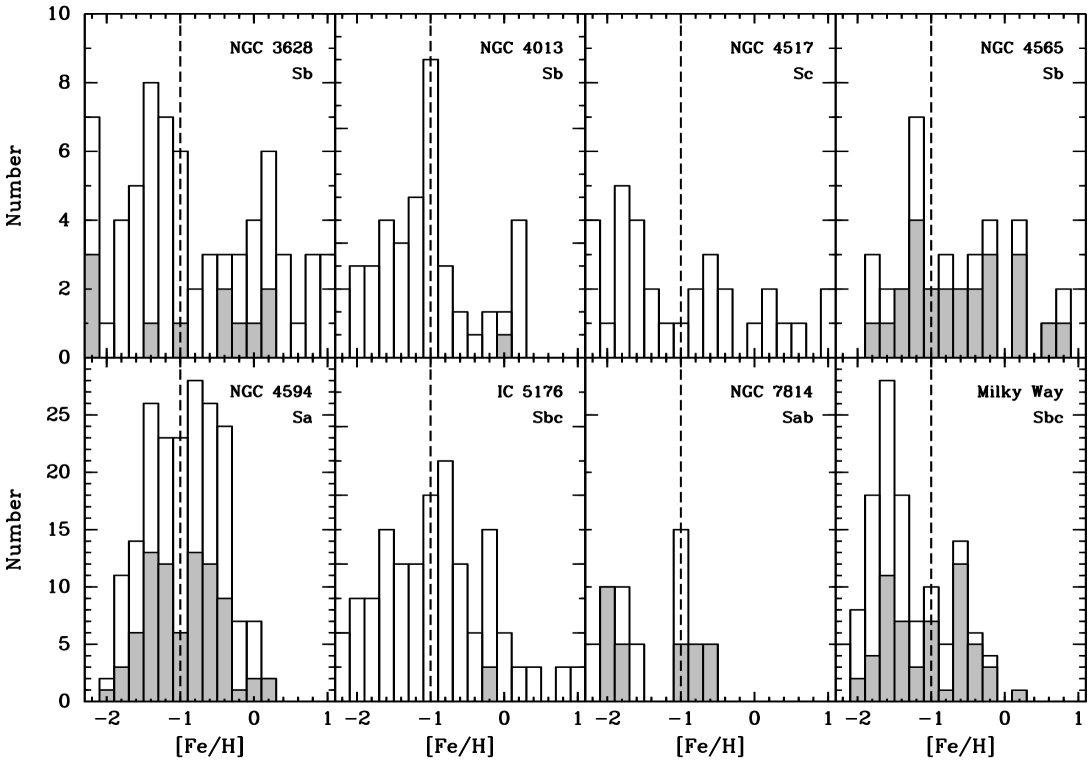
To identify ‘metal-rich’ GCs in our sample galaxies, we considered a lower limit of [Fe/H] = 1, which is the location of the ‘dip’ in the metallicity distribution of the Milky Way GC system (Harris 1996). This is shown in Fig. 4, superposed onto the GC metallicity histograms of the sample galaxies. The metallicities were derived by transforming the colours (corrected for Galactic extinction) into [Fe/H] values using the recent calibration of Kissler-Patig et al. (1998). The colours of GCs in NGC 4565 were converted into [Fe/H] values using the relation for Milky Way GCs, given in Couture, Harris & Allwright (1990). Note that the [Fe/H] values for GC candidates in external spiral galaxies as derived from colours are likely overestimates given the possibility of reddening by dust, especially in the inner regions. Thus, the number of “metal-rich” clusters resulting from this exercise has to be regarded as an upper limit.
To allow a direct comparison with the ‘bulge ’ values defined in Forbes et al. (2001), we counted the total number of ‘metal-rich’ GC candidates as well as those with a projected galactocentric radius identified in our images. Correction for incomplete spatial coverage was done by dividing the observed number of GCs by the fraction of the total area within sampled by our images. Since the surface density of GCs typically falls off with increasing galactocentric radius, this correction procedure was done in elliptical annuli, i.e., multiplying the number of GCs in each annulus by the ratio of total annulus area to that which was actually observed. We chose to skip this measurement for the case of NGC 3628 since the HST observations of NGC 3628 only covered a very small portion of the inner bulge, rendering the extrapolated result very uncertain. In the cases of NGC 4565 and IC 5176, we only counted GCs on one side of the disc for this purpose, namely the side that was visually not significantly impacted by dust extinction. The bulge values for the sample galaxies were then calculated using the ratios listed in Table 1. The results are listed in Table 3.
The bulge values within for most of our galaxies are roughly consistent with a value of 0.1, with the exception of NGC 4594, the Sombrero galaxy, for which we find a value of 0.5. At face value, the low bulge values for most of our galaxies seem to be inconsistent with the prediction of Forbes et al. (2001) who suggested that bulge values within are constant among spiral galaxies with a value around 0.5. However, systematic uncertainties of the inner bulge values as derived from our data can be substantial. E.g., we generally optimized our observing strategy to detect GCs in the halos of the target galaxies (cf. Fig. 1), and dust extinction effects are strong in the innermost bulge regions. Hence we defer further discussion on the universality of the bulge until high-resolution near-IR data are available. Our following discussion on trends of values along the Hubble sequence will therefore focus on the ‘total’ values.
4 Discussion
In the context of the ‘major merger’ (Ashman & Zepf 1992) or ‘multi-phase collapse’ (Forbes, Brodie & Grillmair 1997) scenarios for the formation of early-type galaxies, the higher values of ellipticals (with respect to spirals) are due to ‘extra’ GCs that were formed with high efficiency during the event that also formed the spherical stellar component (bulge). If this is indeed how bulges of spirals form in general, one would expect to vary systematically along the Hubble sequence of spirals (increasing from late-type to early-type spirals). If instead bulges were formed from disc stars by means of redistribution of angular momentum through minor perturbations and/or bar-like instabilities as in the scenario of Pfenniger & Norman (1990), one would not expect to see any significant variation along the Hubble sequence, since no GCs would be formed in this secular building of bulges.
Since our galaxy sample spans a large range of Hubble types (from Sa to Sc), we are in a good position to test this. We plot the and values versus Hubble type and ratio in Figure 5. Values for the Milky Way and M31 (taken from Forbes et al. 2001 and references therein) are also included in that Figure. There are a number of remarkable aspects of these results, which we discuss in order below.
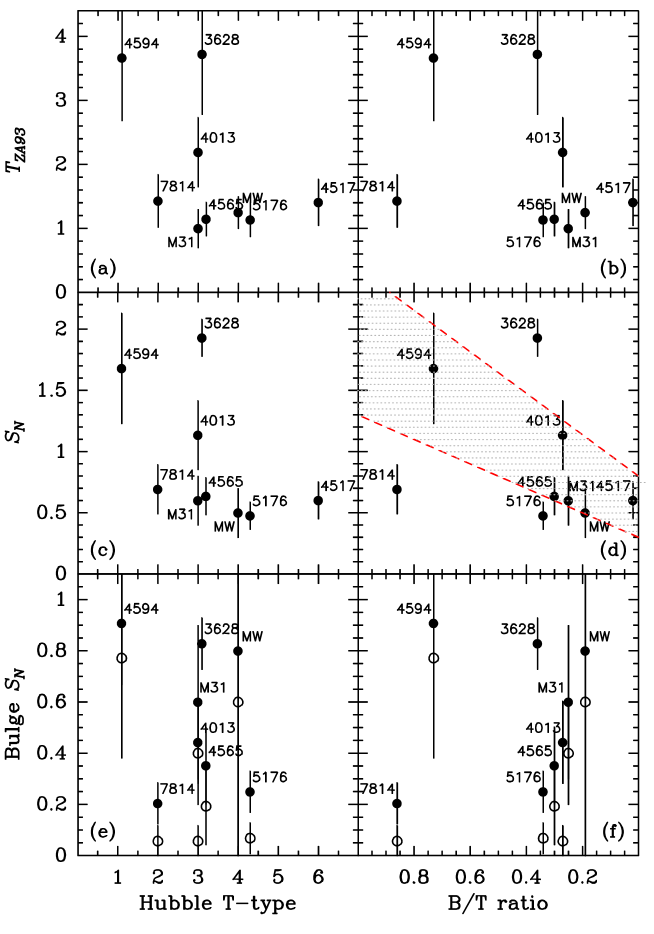
First of all, there does not seem to be any significant difference between trends derived from and those from . Hence, we will only discuss trends involving , with the understanding that the trends involving are consistent with them.
A general trend in Figure 5 is that stays basically constant at a value of 0.55 for spirals with (roughly corresponding to Hubble types Sb and later). As these galaxies are clearly dominated in mass by their halos, this constant (and ) suggests that the formation process of massive (late-type) spiral galaxies involves the creation of a quite constant number of GCs per unit galaxy luminosity (and mass). We suggest that this population of GCs represents a ‘universal’, old halo population that is present around each galaxy.
It is now well established that elliptical galaxies in environments similar to that of the spirals in our sample (i.e., outside galaxy clusters) have higher specific frequencies than these late-type spirals. A -weighted average value for ellipticals outside galaxy clusters published in the literature is = 1.9 0.6 (using data from Ashman & Zepf 1998; Brown et al. 2000; Georgakakis, Forbes & Brodie 2001; Goudfrooij et al. 2001). If indeed the higher values of for elliptical galaxies are due to an ‘extra’ population of GCs which was formed during the formation process of spheroidal stellar systems (such as bulges) involving a rapid dissipative collapse in which the physical conditions are such that giant star clusters are formed very efficiently (i.e., as in the ‘merger’ and ‘multi-phase collapse’ scenarios mentioned above), then one would naively expect the values to scale linearly with ratio from at to at . This area is hatched in the middle right panel of Fig. 5.
Interestingly, the values of most sample galaxies are indeed consistent with this simple prediction. There are however two galaxies for which this is clearly not the case: NGC 3628 (Sb) and NGC 7814 (Sab).
The result for NGC 3628 is quite remarkable. This Sb galaxy turns out to have a value that is significantly higher than all other Sb or Sbc galaxies with measurements to date. However, NGC 3628 is a peculiar galaxy. It is part of the Leo Triplet (Arp 317; Arp 1966). Large-area optical observations reveal a tidal plume extending 100 kpc towards the east, as well as a bridge between NGC 3628 and NGC 3627 (Burkhead & Hutter 1981; Chromey et al. 1998), both of which contain large amounts of H i gas (, which is 15% of the total H i mass observed in the main body of NGC 3628; Haynes, Giovanelli & Roberts 1979). Rots (1978) constructed three-body orbital models for the tidal interactions between NGC 3627 and NGC 3628 which reproduce the formation of the plume and bridge, yielding an age for the plume of yr since perigalacticon. This age was confirmed by photometric measurements of bright clumps in the plume by Chromey et al. (1998). It is therefore quite conceivable that the high value of NGC 3628 may be due to an ‘extra’ supply of star clusters which were formed during the gaseous interaction that also caused the tidal plume and bridge. This situation seems to have occurred in M82, another nearby starburst galaxy which has undergone a past starburst triggered by tidal interactions with a gas-rich neighbour, during which a population of GCs did indeed form (see, e.g., de Grijs, O’Connell & Gallagher 2001). As the gas from which such second-generation star clusters are formed is expected to be of relatively high metallicity (relative to halo GCs), this picture is consistent with the observation that the (total) bulge of NGC 3628 (i.e., the number of metal-rich GC candidates per unit bulge luminosity) is higher than those of the other Sb–Sc galaxies in our sample by a factor similar to the total . This idea should be verified by performing wide-field imaging as well as spectroscopy of a significant number of GC candidates in NGC 3628.
As to the deviant result for NGC 7814, it is perhaps somewhat surprising to find that the two earliest-type spirals in this sample (NGC 4594 and NGC 7814) have very different specific frequencies. NGC 4594 (Sa) has values that are similar to those of field ellipticals (e.g., Ashman & Zepf 1998) and S0 galaxies (Kundu & Whitmore 2001), and thus seems to have formed GCs at a similarly high efficiency relative to its field stars. It is therefore highly unlikely that bulges like the one of NGC 4594 can be formed through the ‘secular evolution’ scenario of Pfenniger & Norman (1990). On the other hand, NGC 7814 has a much lower , which is consistent with the values found for the bulk of the latest-type spirals. This difference in persists when considering the ‘bulge ’ values. At face value, this result suggests that the (star–) formation histories of galaxy bulges of early-type spirals can be significantly different from one galaxy to another. The formation process of some bulges (such as that of NGC 4594) may have involved dissipative collapse, being accompanied by the creation of a significant number of (metal-rich) GCs, while bulges in other spiral galaxies (like NGC 7814) may have been built from the redistribution of angular momentum through bar-like instabilities as in the ‘secular evolution’ scenario. In this context, it may well be relevant that NGC 7814 is the least luminous (and thus presumably least massive) spiral galaxy in our sample, being 5 times less luminous than NGC 4594. As Pfenniger (1991) showed, the accretion of small satellite galaxies (with a mass of 10% of that of the massive galaxy) can trigger the formation of a bar and produce a bulge through secular evolution. It is tempting to suggest that the difference in value between NGC 4594 and NGC 7814 is simply due to the fact that satellite galaxies at a satellite-to-giant galaxy mass ratio of 10% are more common at low (giant) galaxy luminosities than at high luminosities. Thus suggestion is certainly consistent with observed luminosity functions of galaxies in poor groups (Jerjen, Binggeli & Freeman 2000; Flint, Bolte & Mendes de Oliveira 2001).
Given the importance of this issue in the context of our understanding of the formation of the Hubble sequence of galaxies, we argue that this suggestion be tested with a statistically significant sample of (edge-on) Sa – Sab spirals which covers an appropriate range of luminosities. This can now be realized with only very modest amounts of observing time using the recent ACS camera aboard HST, which reaches some 2 magnitudes deeper than WFPC2 at a given exposure time. The current generation of large-area CCD mosaics on ground-based 4-m-class telescopes will be very valuable as well in terms of covering the whole GC populations around such galaxies in one shot.
5 Summary
We have studied the GC systems of 7 giant, edge-on spiral galaxies covering the Hubble types Sa to Sc, allowing us to study the variation of the properties of GC systems along the Hubble sequence. Our high-resolution HST/WFPC2 data (supplemented by archival WFPC2 data for two galaxies) reached 1.5 mag beyond the turn-over magnitude of the GC luminosity function for each galaxy.
Specific frequencies of GCs ( values) were evaluated by comparing the numbers of GCs found in our WFPC2 pointings with the number of GCs in our Milky Way which would be detected in the same spatial region if placed at the distance of the target galaxies. Results from this method were compared with the more commonly used method of constructing radial distribution functions of GCs to correct for incomplete spatial coverage in the case of NGC 4594 (where both methods were possible), and found to be consistent with one another to within 1.
The values of spirals with (i.e., spirals with a Hubble type later than about Sb) are consistent with a value of . We suggest that this population of GCs represents a ‘universal’, old halo population that is present around each galaxy.
Most galaxies in our sample have values that are consistent with a scenario in which GC systems are made up of (i) the aforementioned halo population plus (ii) a population that is associated with bulges of spirals, which grows linearly with the luminosity (and mass) of the bulge. Such scenarios include the ‘merger scenario’ for the formation of elliptical galaxies as well as the ‘multi-phase collapse’ scenario, but it seems inconsistent with the ‘secular evolution’ scenario of Pfenniger & Norman (1990), in which bulges are formed from disc stars by means of the redistribution of angular momentum through minor perturbations and/or bar instabilities.
On the other hand, the bulge-dominated spiral NGC 7814 shows a low value, consistent with those of the latest-type spirals. NGC 7814 is the least luminous galaxy in our sample. Based on observed luminosity functions of galaxies in poor groups, we suggest that the ‘secular evolution’ scenario to build bulges in early-type spirals is most viable for low-luminosity spirals.
Thus, our results suggest that the formation histories of galaxy bulges of early-type spirals can be significantly different from one galaxy to another. Given the importance of our understanding of the formation of the Hubble sequence of galaxies in the context of galaxy evolution, we argue that the GC systems of a statistically significant sample of luminous, edge-on Sa – Sab spirals be studied in the near future.
Acknowledgments.
This paper is based on observations obtained with the NASA/ESA Hubble Space Telescope, which is operated by AURA, Inc., under NASA contract NAS 5–26555. We are grateful to Chris Howk for making his WIYN images of our Northern targets available to us, and thank David Clements for his contribution during the proposal preparation stage. We thank the referee, Duncan Forbes, for a fast, thorough and constructive review. We have made use of the NASA/IPAC Extragalactic Database (NED) which is operated by the Jet Propulsion Laboratory, Caltech, under contract with the National Aeronautics and Space Administration. PG was affiliated with the Astrophysics Division of the Space Science Department of the European Space Agency during part of this project. DM is supported by FONDAP Center for Astrophysics 15010003. JS and LB would like to thank the Space Telescope Science Institute for financial support through its Summer Student Program.
References
- [1973] Arp H., 1966, Atlas of Peculiar Galaxies. California Institute of Technology Press, Pasadena
- [1992] Ashman K. M., Zepf S. E., 1992, ApJ 384, 50
- [1998] Ashman K. M., Zepf S. E., 1998, Globular Cluster Systems. Cambridge University Press, Cambridge
- [1998] Baggett W. E., Baggett S. M., Anderson K. S. J., 1998, AJ, 116, 1626
- [2002] Barmby P., Holland S., Huchra J.P., 2002, AJ, 123, 1937
- [1992] Bothun G. D., Harris H. C., Hesser J. E., 1992, PASP, 104, 1220
- [2000] Brown R. J. N., Forbes D. A., Kissler–Patig M., Brodie J. P., 2000, MNRAS, 317, 406
- [1981] Burkhead M. S., Hutter D. J., 1981, ApJ, 86, 523
- [1998] Chromey F. R., Elmegreen D. M., Mandell A., McDermott J., 1998, AJ, 115, 2331
- [1999] Côté P., 1999, AJ, 118, 406
- [1990] Couture J., Harris W. E., Allwright J. W., 1990, ApJS, 73, 671
- [1997] de Grijs R., Peletier R. F., van der Kruit P. C., 1997, A&A, 327, 966
- [2001] de Grijs R., O’Connell R. W., Gallagher J. S. III, 2001, AJ, 121, 768
- [1953] de Vaucouleurs G., 1953, MNRAS, 113, 134
- [1991] de Vaucouleurs G., de Vaucouleurs A., Corwin G., et al., 1991, Third Reference Catalog of Bright Galaxies. Springer-Verlag, New York (RC3)
- [2000] Dolphin A. E., 2000, PASP, 112, 1397
- [1962] Eggen O. J., Lynden-Bell D., Sandage A. R., 1962, ApJ, 136, 748
- [1979] Faber S. M., Gallagher J. S. III, 1979, ARA&A, 17, 135
- [2000] Ferrarese L., Ford H. C., Huchra J. P. et al., 2000, ApJS, 128, 431
- [2001] Flint K., Bolte M., Mendes de Oliveira C., 2001, in de Boer K. S., Dettmar R.–J., Klein U., eds, Dwarf galaxies and their environment. Shaker Verlag, Aachen, p. 209
- [1997] Forbes D. A., Brodie J. P., Grillmair C. J., 1998, AJ, 113, 1652
- [1998] Forbes D. A., Grillmair C. J., Williger G. M., Elson R. A. W., Brodie J. P., 1998, MNRAS, 293, 325
- [2001] Forbes D. A., Brodie J. P., Larsen S. S., 2001, ApJ, 556, L83
- [1996] Ford H. C., Hui X., Ciardullo R., Jacoby G. H., Freeman K. C., 1996, ApJ, 458, 455
- [2000] Gavazzi G., Franzetti P., Boselli A., Pierini D., Scodeggio M., 2000, A&A, 361, 863
- [2001] Georgakakis A. E., Forbes D. A., Brodie J. P., 2001, MNRAS, 324, 785
- [1999] Goudfrooij P., Gorgas J., Jablonka P., 1999, Ap&SS, 269, 109
- [2001] Goudfrooij P., Alonso M. V., Maraston C., Minniti D., 2001, MNRAS 328, 237
- [1992] Guthrie B. N. G., 1992, A&AS, 93, 255
- [1991] Harris W. E., 1991, ARA&A 29, 543
- [1996] Harris W. E., 1996, AJ, 112, 1487
- [1981] Harris W. E., van den Bergh S., 1981, AJ 86, 1627
- [1979] Haynes M. P., Giovanelli R., Roberts M. S., 1979, ApJ, 229, 83
- [1995] Holtzman J. A., Burrows C. J., Casertano S. et al., 1995, PASP, 107, 165
- [1999] Howk J. C., Savage B. D., 1999, AJ, 117, 2077
- [1926] Hubble E., 1926, ApJ, 64, 321
- [1996] Jacoby G. H., Ciardullo R., Harris W. E., 1996, ApJ, 462, 1
- [2000] Jerjen H., Binggeli B., Freeman K. C., 2000, AJ, 119, 593
- [1998] Kissler-Patig M., Brodie J. P., Schroder L. L., Forbes D. A., Grillmair C. J., Huchra J. P., 1998, AJ, 115, 105
- [1999] Kissler-Patig M., Ashman K. M., Zepf S. E., 1999, AJ, 118, 197
- [2001] Kundu A., Whitmore B. C., 2001, AJ, 122, 1251
- [2001] Larsen S. S., Forbes D. A., Brodie J. P., 2001, MNRAS, 327, 1116
- [1989] Lauberts A., Valentijn E. A., 1989, The surface photometry catalogue of the ESO-Uppsala galaxies. European Southern Observatory, Garching
- [1973] Nilson P., 1973, Uppsala General Catalogue of Galaxies. Uppsala Astron. Obs., Uppsala
- [1995] Minniti D., 1995, AJ, 109, 1663
- [1994] Morrison H. L., Boroson T. A., Harding P., 1994, AJ, 108, 1191
- [2002] Paturel G., Thureau G., Fouqué P., Terry J. N., Musella I., Ekholm T., 2002, A&A, 383, 398
- [2002] Perrett K. M., Bridges T. J., Hanes D. A., Irwin M. J., Brodie J. P., Carter D., Huchra J. P., Watson F. G., 2002, AJ, 123, 2490
- [1991] Pfenniger D., 1991, in Sundelius B., ed, Dynamics of disc galaxies. Chalmers Univ. Press, Göteborg, p. 191
- [1990] Pfenniger D., Norman C. A., 1990, ApJ, 363, 391
- [2002] Rhode K. L., Zepf S. E., 2002, in Kissler-Patig M., ed, Extragalactic Globular Cluster Systems. Springer, Berlin, in press
- [1996] Rich R. M., Mighell K. J., Freedman W. L., Neill J. D., 1996, AJ, 111, 768
- [1985] Rieke G. H., Lebofsky M. J., ApJ, 288, 618
- [1978] Rots A. H., 1978, AJ, 83, 219
- [1987] Schweizer F., 1987, in Faber S. M., ed, Nearly normal galaxies: from the Planck time to the present. Springer, New York, p. 18
- [1987] Stetson P. B., 1997, PASP, 99, 191
- [2001] Tonry J. L., Dressler A., Blakeslee J. P., et al., 2001, ApJ, 546, 681
- [2000] Tully R. B., Pierce M. J., 2000, ApJ, 533, 744
- [1999] van den Bergh S., 1999, A&AR, 9, 273
- [1997] Whitmore B. C., 1997, in Livio M., Donahue M., Panagia N., eds, The Extragalactic Distance Scale. STScI, Baltimore, p. 254
- [1999] Whitmore B. C., Heyer I., Casertano S., 1999, PASP, 111, 1559
- [1997] Willick J. A., Courteau S., Faber S. M., Burstein D., Dekel A., Strauss M. A., ApJS, 109, 333
- [2002] Wu H., Burstein D., Deng Z. et al., 2002, AJ, 123, 1364
- [1993] Zepf S. E., Ashman K. M., 1993, MNRAS, 264, 611
Appendix A Bulge/disc decompositions
Since bulge/disc decompositions are not the main topic of this paper, we will only provide a brief description of our method here. A more detailed description will be provided elsewhere. We first determined the scale heights of the discs at 4 independent positions along their major axes, outside the region where the bulge contribution dominates. In general, the positions of the galaxy planes were determined by assuming symmetrical light distributions with respect to the disc plane, and the vertical profiles on either side of the plane were averaged together. However, the latter was not done for the bulge fits on NGC 4013 and IC 5176, since the WFPC2 frames only covered a large enough spatial extent on one side of the galaxy centre.
The vertical brightness distributions of the discs were well fitted by an exponential profile
| (1) |
where is the disc scale height. We found that as long as one stays outside the central areas where there is an obvious contribution from bulge light, the disc scale heights generally do not exhibit any significant variation with distance along the major axis. This is consistent with the findings of de Grijs, Peletier & van der Kruit (1997). The average disc scale heights are listed in Table 1.
To obtain structural parameters for the bulges of these galaxies, we used a least-square program that fits a two-component (disc+bulge) model to the minor-axis brightness profiles. The disc component was fit by an exponential profile and the bulge component was fitted by two different functions, namely (i) a de Vaucouleurs’ (1953) profile
| (2) |
where is the effective radius along the minor axis and is the intensity at , and (ii) a (second) exponential profile. For each galaxy, the disc scale height as found above was fixed in the fit. Areas where dust extinction is prominent (such as the central dust lanes) were flagged and ignored during the fitting process. The choice between the de Vaucouleurs’ profile and the (second) exponential profile was dictated by the value of the fit.
Among the sample galaxies, only the bulges of NGC 4013, NGC 4517, NGC 4594 and NGC 7814 were well fit by a de Vaucouleurs’ profile. The bulges of the other galaxies were better fit by an exponential profile. The effective radii (or exponential scale radii rexp) of the bulges are listed in Table 1, after converting them to equivalent radii , where and are the semimajor and semiminor axes of the ellipse, and its ellipticity. For NGC 3628, NGC 4013, NGC 4517 and IC 5176, the bulge ellipticities were determined by using the ellipse fitting program in the isophote package within IRAF. The dusty areas of the galaxies were flagged and ignored in the ellipse fitting process. For the galaxies with exponential bulge profiles, we also list the bulge half-light radii (= 1.678 rexp) for comparison with the effective radii of the bulges with de Vaucouleurs’ profiles.
Appendix B Tables of globular cluster candidates
The photometry and astrometry of the 50 brightest GC candidates on the WFPC2 images of the galaxies for which GC photometry was not published before are given in Tables 4 – 8. For the photometry of GC candidates in NGC 4565 and NGC 4594 we refer to Kissler-Patig et al. (1999) and Larsen et al. (2001), respectively.
| ID | RA | DEC | ||
|---|---|---|---|---|
| (J2000) | (J2000) | mag | mag | |
| 3628–1 | 11:20:14.64 | +13:32:27.6 | ||
| 3628–2 | 11:20:21.12 | +13:35:38.4 | ||
| 3628–3 | 11:20:19.92 | +13:35:45.6 | ||
| 3628–4 | 11:20:19.44 | +13:36:50.4 | ||
| 3628–5 | 11:20:14.40 | +13:33:57.6 | ||
| 3628–6 | 11:20:17.76 | +13:35:45.6 | ||
| 3628–7 | 11:20:17.76 | +13:37:22.8 | ||
| 3628–8 | 11:20:12.72 | +13:34:04.8 | ||
| 3628–9 | 11:20:15.60 | +13:33:32.4 | ||
| 3628–10 | 11:20:16.56 | +13:33:36.0 | ||
| 3628–11 | 11:20:12.72 | +13:33:57.6 | ||
| 3628–12 | 11:20:19.92 | +13:35:31.2 | ||
| 3628–13 | 11:20:16.80 | +13:35:34.8 | ||
| 3628–14 | 11:20:16.32 | +13:35:38.4 | ||
| 3628–15 | 11:20:18.00 | +13:35:31.2 | ||
| 3628–16 | 11:20:16.80 | +13:35:52.8 | ||
| 3628–17 | 11:20:17.04 | +13:35:31.2 | ||
| 3628–18 | 11:20:15.84 | +13:35:38.4 | ||
| 3628–19 | 11:20:15.84 | +13:35:34.8 | ||
| 3628–20 | 11:20:18.48 | +13:36:07.2 | ||
| 3628–21 | 11:20:17.76 | +13:35:45.6 | ||
| 3628–22 | 11:20:16.08 | +13:35:34.8 | ||
| 3628–23 | 11:20:17.28 | +13:35:42.0 | ||
| 3628–24 | 11:20:13.44 | +13:34:04.8 | ||
| 3628–25 | 11:20:16.08 | +13:35:38.4 | ||
| 3628–26 | 11:20:20.40 | +13:34:40.8 | ||
| 3628–27 | 11:20:17.28 | +13:34:44.4 | ||
| 3628–28 | 11:20:18.24 | +13:35:27.6 | ||
| 3628–29 | 11:20:16.80 | +13:36:36.0 | ||
| 3628–30 | 11:20:16.32 | +13:35:31.2 | ||
| 3628–31 | 11:20:17.28 | +13:35:38.4 | ||
| 3628–32 | 11:20:19.20 | +13:35:34.8 | ||
| 3628–33 | 11:20:19.92 | +13:35:52.8 | ||
| 3628–34 | 11:20:18.00 | +13:35:27.6 | ||
| 3628–35 | 11:20:20.40 | +13:35:34.8 | ||
| 3628–36 | 11:20:16.56 | +13:35:42.0 | ||
| 3628–37 | 11:20:17.04 | +13:35:27.6 | ||
| 3628–38 | 11:20:16.56 | +13:35:34.8 | ||
| 3628–39 | 11:20:20.40 | +13:37:37.2 | ||
| 3628–40 | 11:20:16.32 | +13:35:31.2 | ||
| 3628–41 | 11:20:18.96 | +13:35:27.6 | ||
| 3628–42 | 11:20:18.72 | +13:34:33.6 | ||
| 3628–43 | 11:20:18.48 | +13:33:43.2 | ||
| 3628–44 | 11:20:17.04 | +13:35:27.6 | ||
| 3628–45 | 11:20:18.48 | +13:36:25.2 | ||
| 3628–46 | 11:20:17.04 | +13:35:31.2 | ||
| 3628–47 | 11:20:17.52 | +13:35:34.8 | ||
| 3628–48 | 11:20:14.88 | +13:36:32.4 | ||
| 3628–49 | 11:20:15.84 | +13:37:01.2 | ||
| 3628–50 | 11:20:16.80 | +13:35:38.4 |
| ID | RA | DEC | ||
|---|---|---|---|---|
| (J2000) | (J2000) | mag | mag | |
| 4013–1 | 11:58:34.32 | +43:56:24.0 | ||
| 4013–2 | 11:58:30.96 | +43:56:34.8 | ||
| 4013–3 | 11:58:29.52 | +43:56:02.4 | ||
| 4013–4 | 11:58:33.36 | +43:57:18.0 | ||
| 4013–5 | 11:58:35.28 | +43:57:46.8 | ||
| 4013–6 | 11:58:29.76 | +43:56:52.8 | ||
| 4013–7 | 11:58:32.64 | +43:56:16.8 | ||
| 4013–8 | 11:58:30.24 | +43:57:14.4 | ||
| 4013–9 | 11:58:31.44 | +43:56:13.2 | ||
| 4013–10 | 11:58:33.84 | +43:57:25.2 | ||
| 4013–11 | 11:58:28.56 | +43:56:52.8 | ||
| 4013–12 | 11:58:31.68 | +43:57:00.0 | ||
| 4013–13 | 11:58:33.36 | +43:56:45.6 | ||
| 4013–14 | 11:58:34.08 | +43:56:24.0 | ||
| 4013–15 | 11:58:25.44 | +43:57:43.2 | ||
| 4013–16 | 11:58:31.44 | +43:58:08.4 | ||
| 4013–17 | 11:58:30.00 | +43:57:21.6 | ||
| 4013–18 | 11:58:29.52 | +43:56:56.4 | ||
| 4013–19 | 11:58:32.40 | +43:56:34.8 | ||
| 4013–20 | 11:58:27.36 | +43:56:09.6 | ||
| 4013–21 | 11:58:32.88 | +43:56:27.6 | ||
| 4013–22 | 11:58:30.96 | +43:57:00.0 | ||
| 4013–23 | 11:58:33.36 | +43:55:51.6 | ||
| 4013–24 | 11:58:31.68 | +43:57:10.8 | ||
| 4013–25 | 11:58:29.76 | +43:57:10.8 | ||
| 4013–26 | 11:58:31.20 | +43:57:57.6 | ||
| 4013–27 | 11:58:32.88 | +43:56:34.8 | ||
| 4013–28 | 11:58:28.80 | +43:56:13.2 | ||
| 4013–29 | 11:58:32.40 | +43:57:57.6 | ||
| 4013–30 | 11:58:31.20 | +43:57:03.6 | ||
| 4013–31 | 11:58:32.64 | +43:56:42.0 | ||
| 4013–32 | 11:58:31.92 | +43:56:42.0 | ||
| 4013–33 | 11:58:29.52 | +43:56:49.2 | ||
| 4013–34 | 11:58:24.72 | +43:57:25.2 | ||
| 4013–35 | 11:58:30.72 | +43:57:39.6 | ||
| 4013–36 | 11:58:33.84 | +43:57:32.4 | ||
| 4013–37 | 11:58:31.20 | +43:56:16.8 | ||
| 4013–38 | 11:58:30.72 | +43:56:34.8 | ||
| 4013–39 | 11:58:33.84 | +43:56:20.4 | ||
| 4013–40 | 11:58:28.56 | +43:57:03.6 | ||
| 4013–41 | 11:58:30.00 | +43:57:07.2 | ||
| 4013–42 | 11:58:32.40 | +43:57:14.4 | ||
| 4013–43 | 11:58:30.24 | +43:56:56.4 | ||
| 4013–44 | 11:58:33.12 | +43:56:38.4 | ||
| 4013–45 | 11:58:31.68 | +43:58:15.6 | ||
| 4013–46 | 11:58:28.80 | +43:56:52.8 | ||
| 4013–47 | 11:58:34.08 | +43:56:42.0 | ||
| 4013–48 | 11:58:33.84 | +43:56:45.6 | ||
| 4013–49 | 11:58:31.92 | +43:56:34.8 | ||
| 4013–50 | 11:58:33.84 | +43:57:28.8 |
| ID | RA | DEC | ||
|---|---|---|---|---|
| (J2000) | (J2000) | mag | mag | |
| 4517–1 | 12:32:43.68 | +00:06:07.2 | ||
| 4517–2 | 12:32:47.52 | +00:06:00.0 | ||
| 4517–3 | 12:32:43.68 | +00:06:32.4 | ||
| 4517–4 | 12:32:42.48 | +00:05:16.8 | ||
| 4517–5 | 12:32:48.72 | +00:05:31.2 | ||
| 4517–6 | 12:32:46.32 | +00:05:16.8 | ||
| 4517–7 | 12:32:42.96 | +00:06:03.6 | ||
| 4517–8 | 12:32:43.44 | +00:07:08.4 | ||
| 4517–9 | 12:32:42.72 | +00:05:38.4 | ||
| 4517–10 | 12:32:46.32 | +00:06:28.8 | ||
| 4517–11 | 12:32:41.52 | +00:06:25.2 | ||
| 4517–12 | 12:32:44.16 | +00:06:32.4 | ||
| 4517–13 | 12:32:43.92 | +00:06:32.4 | ||
| 4517–14 | 12:32:43.20 | +00:06:28.8 | ||
| 4517–15 | 12:32:42.96 | +00:06:21.6 | ||
| 4517–16 | 12:32:43.68 | +00:06:21.6 | ||
| 4517–17 | 12:32:46.08 | +00:06:28.8 | ||
| 4517–18 | 12:32:44.40 | +00:06:25.2 | ||
| 4517–19 | 12:32:41.04 | +00:04:58.8 | ||
| 4517–20 | 12:32:48.48 | +00:05:27.6 | ||
| 4517–21 | 12:32:47.76 | +00:05:24.0 | ||
| 4517–22 | 12:32:45.12 | +00:06:25.2 | ||
| 4517–23 | 12:32:46.32 | +00:06:36.0 | ||
| 4517–24 | 12:32:45.36 | +00:06:36.0 | ||
| 4517–25 | 12:32:44.88 | +00:06:25.2 | ||
| 4517–26 | 12:32:43.20 | +00:07:08.4 | ||
| 4517–27 | 12:32:45.84 | +00:06:21.6 | ||
| 4517–28 | 12:32:45.36 | +00:06:32.4 | ||
| 4517–29 | 12:32:43.20 | +00:07:12.0 | ||
| 4517–30 | 12:32:45.60 | +00:04:55.2 | ||
| 4517–31 | 12:32:45.84 | +00:06:28.8 | ||
| 4517–32 | 12:32:45.36 | +00:06:32.4 | ||
| 4517–33 | 12:32:45.60 | +00:06:25.2 | ||
| 4517–34 | 12:32:43.44 | +00:06:21.6 | ||
| 4517–35 | 12:32:43.20 | +00:06:32.4 | ||
| 4517–36 | 12:32:45.60 | +00:06:25.2 | ||
| 4517–37 | 12:32:44.40 | +00:06:25.2 | ||
| 4517–38 | 12:32:42.00 | +00:06:25.2 | ||
| 4517–39 | 12:32:45.84 | +00:06:36.0 | ||
| 4517–40 | 12:32:44.40 | +00:06:21.6 | ||
| 4517–41 | 12:32:42.96 | +00:06:14.4 | ||
| 4517–42 | 12:32:44.40 | +00:06:10.8 | ||
| 4517–43 | 12:32:43.44 | +00:06:25.2 | ||
| 4517–44 | 12:32:45.84 | +00:06:36.0 | ||
| 4517–45 | 12:32:45.84 | +00:06:32.4 | ||
| 4517–46 | 12:32:45.84 | +00:06:36.0 | ||
| 4517–47 | 12:32:43.20 | +00:06:32.4 | ||
| 4517–48 | 12:32:44.40 | +00:06:25.2 | ||
| 4517–49 | 12:32:45.60 | +00:06:32.4 | ||
| 4517–50 | 12:32:45.36 | +00:06:28.8 |
| ID | RA | DEC | ||
|---|---|---|---|---|
| (J2000) | (J2000) | mag | mag | |
| 5176–1 | 22:14:54.96 | 66:50:38.4 | ||
| 5176–2 | 22:14:43.44 | 66:51:03.6 | ||
| 5176–3 | 22:15:00.00 | 66:51:14.4 | ||
| 5176–4 | 22:15:05.04 | 66:50:09.6 | ||
| 5176–5 | 22:14:51.84 | 66:51:18.0 | ||
| 5176–6 | 22:15:01.68 | 66:50:34.8 | ||
| 5176–7 | 22:14:56.88 | 66:51:25.2 | ||
| 5176–8 | 22:15:00.96 | 66:50:42.0 | ||
| 5176–9 | 22:14:52.08 | 66:51:00.0 | ||
| 5176–10 | 22:14:51.12 | 66:51:32.4 | ||
| 5176–11 | 22:14:50.16 | 66:51:21.6 | ||
| 5176–12 | 22:14:51.36 | 66:51:21.6 | ||
| 5176–13 | 22:14:57.12 | 66:51:18.0 | ||
| 5176–14 | 22:14:54.96 | 66:51:32.4 | ||
| 5176–15 | 22:15:02.88 | 66:49:51.6 | ||
| 5176–16 | 22:14:58.08 | 66:51:39.6 | ||
| 5176–17 | 22:14:59.76 | 66:49:55.2 | ||
| 5176–18 | 22:15:02.64 | 66:50:09.6 | ||
| 5176–19 | 22:14:52.80 | 66:51:00.0 | ||
| 5176–20 | 22:14:53.52 | 66:50:56.4 | ||
| 5176–21 | 22:14:58.56 | 66:49:55.2 | ||
| 5176–22 | 22:14:56.64 | 66:51:18.0 | ||
| 5176–23 | 22:14:51.36 | 66:51:18.0 | ||
| 5176–24 | 22:14:51.60 | 66:51:07.2 | ||
| 5176–25 | 22:14:56.64 | 66:51:39.6 | ||
| 5176–26 | 22:15:03.84 | 66:50:20.4 | ||
| 5176–27 | 22:14:53.52 | 66:50:56.4 | ||
| 5176–28 | 22:14:51.84 | 66:51:18.0 | ||
| 5176–29 | 22:15:00.24 | 66:50:38.4 | ||
| 5176–30 | 22:14:56.40 | 66:51:25.2 | ||
| 5176–31 | 22:14:54.72 | 66:50:42.0 | ||
| 5176–32 | 22:14:56.64 | 66:50:24.0 | ||
| 5176–33 | 22:15:01.92 | 66:50:13.2 | ||
| 5176–34 | 22:14:55.92 | 66:50:24.0 | ||
| 5176–35 | 22:14:53.04 | 66:50:52.8 | ||
| 5176–36 | 22:14:51.12 | 66:51:18.0 | ||
| 5176–37 | 22:15:05.04 | 66:50:09.6 | ||
| 5176–38 | 22:14:55.68 | 66:50:31.2 | ||
| 5176–39 | 22:14:55.68 | 66:50:31.2 | ||
| 5176–40 | 22:14:51.84 | 66:51:21.6 | ||
| 5176–41 | 22:15:04.08 | 66:49:48.0 | ||
| 5176–42 | 22:14:54.96 | 66:51:36.0 | ||
| 5176–43 | 22:14:50.64 | 66:51:18.0 | ||
| 5176–44 | 22:15:01.68 | 66:50:45.6 | ||
| 5176–45 | 22:15:01.20 | 66:50:45.6 | ||
| 5176–46 | 22:14:59.52 | 66:49:58.8 | ||
| 5176–47 | 22:15:01.68 | 66:50:56.4 | ||
| 5176–48 | 22:14:52.56 | 66:50:13.2 | ||
| 5176–49 | 22:14:51.36 | 66:51:21.6 | ||
| 5176–50 | 22:14:54.72 | 66:50:20.4 |
| ID | RA | DEC | ||
|---|---|---|---|---|
| (J2000) | (J2000) | mag | mag | |
| 7814–1 | 00:03:13.20 | +16:08:27.6 | ||
| 7814–2 | 00:03:09.84 | +16:06:50.4 | ||
| 7814–3 | 00:03:10.80 | +16:08:02.4 | ||
| 7814–4 | 00:03:08.64 | +16:08:49.2 | ||
| 7814–5 | 00:03:13.44 | +16:08:24.0 | ||
| 7814–6 | 00:03:12.72 | +16:08:20.4 | ||
| 7814–7 | 00:03:11.28 | +16:07:55.2 | ||
| 7814–8 | 00:03:12.24 | +16:08:42.0 | ||
| 7814–9 | 00:03:12.48 | +16:07:26.4 | ||
| 7814–10 | 00:03:10.80 | +16:08:45.6 | ||
| 7814–11 | 00:03:14.16 | +16:06:50.4 | ||
| 7814–12 | 00:03:13.20 | +16:06:57.6 | ||
| 7814–13 | 00:03:15.12 | +16:08:13.2 | ||
| 7814–14 | 00:03:12.96 | +16:07:30.0 | ||
| 7814–15 | 00:03:13.68 | +16:08:24.0 | ||
| 7814–16 | 00:03:13.44 | +16:08:24.0 | ||
| 7814–17 | 00:03:13.44 | +16:08:34.8 |