Motion Statistics in the CJ Survey – The Status in October 2002
Abstract
In the Caltech-Jodrell Survey of bright flat-spectrum radio sources, 3–5 epochs have now been observed for nearly all 293 sources; a uniquely large sample. The derivation of component motions has not yet been completed; it is complicated by, for example, variability and jet curvature. Nevertheless, some basic results are clear. The average apparent velocity in CJF quasars is near , while for radio galaxies and BL Lacs it is around . The distribution of velocities is broad, indicating a broad distribution of jet Lorentz factors, with many low values, and/or a decoupling of the Lorentz factors between the cores and the moving jet components, due to bending, speed changes, or due to pattern motions (shocks). A hint has emerged at this workshop that the average apparent velocities might be lower at lower radio frequencies; this will need careful verification.
Astron, P.O. Box 2, 7990 AA, Dwingeloo, The Netherlands
Astron, P.O. Box 2, 7990 AA, Dwingeloo, The Netherlands
Landessternwarte, Königstuhl, 69117 Heidelberg, Germany
National Radio Astronomy Observatory, PO Box O, Socorro, NM 87801, USA
California Institute of Technology, Pasadena, CA 91125, USA
Jodrell Bank Observatory, University of Manchester, Macclesfield, Cheshire SK11 9DL, UK
1. Introduction
Superluminal motion is one of the many astronomical research topics in which Ken Kellermann has been deeply involved ever since it arose. Ken was of course already playing a central role in the exploration of variability in extragalactic radio sources (e.g., Pauliny-Toth & Kellermann 1966; Kellermann 1966). Then, with the development of VLBI (one of the earlier papers on the subject being Kellermann et al. 1968), came the gradual establishment of the fact that, as predicted by Rees (1967), evolving, relativistically moving components not only cause rapid flux density variability, but indeed also display superluminal velocities, due to geometrical effects when the motion is directed close to our line of sight. It is historically interesting to see the development of this interpretation in papers (co)authored by Ken through the late 1960s, the 1970s, and even the early 1980s, for example Cohen et al. (1971), Shaffer et al. (1972), Kellermann et al. (1973), Kellermann et al. (1974), and Cohen et al. (1977); perhaps this can be said to have culminated in Ken’s 1985 review (Kellermann 1985).
In the early days, there was a focus on some very interesting individual cases of rapidly varying and very bright sources, including quasars such as 3C 273 and 3C 279, as well as galaxies such as 3C 84 and 3C 120. But, clearly, the statistics of a significantly sized sample are needed in order to obtain a more systematic overview of jet properties, such as the range of Lorentz gamma factors, and, for example, to probe the occurrence of pattern motions distinct from the bulk flow (e.g., Vermeulen & Cohen 1994). A more statistical approach is also needed to study how the properties of relativistic jets are related to the other physical parameters of the radio sources and their hosts, and also to test unification models, which explain apparent differences between object classes as being due to viewing them at different angles to the line of sight. Ken himself long ago recognised the need for large surveys, and, when the VLBA, of which he has of course been a long-term advocate, started operations in the 1990s, he initiated the 2 cm VLBA survey (Kellermann et al. 1998), as described elsewhere in these proceedings.
Meanwhile, the 6 cm Pearson-Readhead (PR) survey (Pearson & Readhead 1981), which had already been started on the Global VLBI Network in the late 1970s, had been extended into the first and second Caltech-Jodrell Bank surveys (CJ1: Polatidis et al. 1995, CJ2: Taylor et al. 1994). In order to allow unified use of these samples, we defined the Caltech-Jodrell Flat-spectrum (CJF) sample of 293 sources (Taylor et al. 1996). The present paper is a brief status update on the effort to measure the motions in the jets of all of the CJF sources.
2. CJF
CJF is a complete flux-limited sample of 293 flat-spectrum radio sources, drawn from the 6 cm and 20 cm Green Bank Surveys. The CJF sample is now 97% optically identified, and spectroscopic redshifts are available for 92% of the sources. Most of them are quasars, at redshifts ranging from to . There are also a significant number of low redshift objects, but in addition there are some 25 galaxies and 20 BL Lac objects at 0.6; enough to allow a meaningful comparison of their motion statistics with that of quasars of the same redshift and luminosity. Between March 1990 and November 2000 there were numerous multi-antenna global VLBI and VLBA snapshot runs at 6 cm. For every source, including those in the PR subsample, this has resulted in 3–5 “modern” VLBI datasets, spanning 4–8 years.
3. Measuring jet component motions
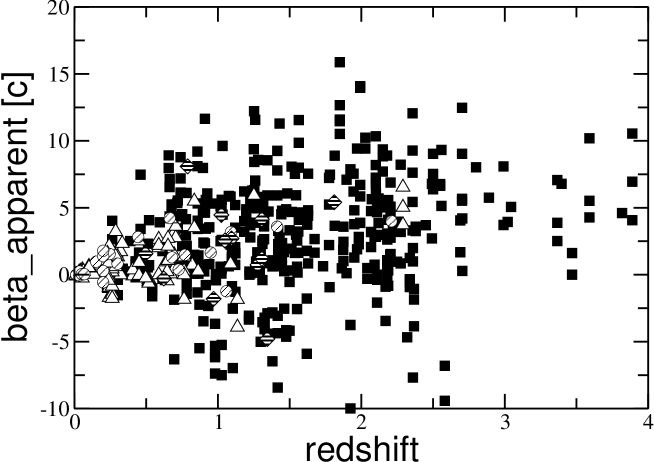
All observing epochs for all sources are being analysed in the same standardised way (e.g., Britzen et al. 1999, 2001). We show in Figure 1 all of the currently available motions for all of the source components, using km s-1 Mpc-1 and . The source structures can usually be described fairly well by using a limited number of Gaussian image components, fitted to the -data using difmap. However, it is not trivial to derive meaningful, consistent motions from the positions of these Gaussians.
The flux density and indeed the morphology of a feature clearly recognisable at one epoch may have changed considerably in the next epoch. This can lead to difficulties in “connecting” features between epochs. Expansion or brightness profile changes in resolved knots can also affect the centroid positions obtained. Furthermore, while in numerous cases the “core” is an unmistakable and presumably fixed reference point for the positions of the other features, there are also sources in which new jet features were emerging from the core (often accompanied by radio flaring), and these events can lead to a temporary shift in the “core” centroid. In some sources there is no component which, by its compactness and/or spectral index, is clearly the non-moving core; evidently, sometimes there is either little radio emission produced in the immediate vicinity of the central engine, or, more likely, the core emission is faint at 5 GHz due to either synchrotron self-absorption or free-free absorption.
We think that most and quite possibly all of the negative motions (i.e., inward towards the core) in Figure 1 are due to component misidentifications or to brightness changes which do not necessarily correspond to motion of a well-defined component. It would obviously be of great interest to find and then study a case of significant inward motion, but so far none of the candidates has survived close scrutiny.
Some of the components also clearly accelerate, decelerate, or follow a curved trajectory; these are not well characterised by a single separation velocity from the core. We plan to make a proper statistical description of the non-linear jet motions encountered, which we hope will prove to be very valuable in confronting the various models for jet acceleration, collimation, and propagation, and (shock) models for the generation of radio emitting particles inside those jets.
We have found that many of the ambiguities are substantially ameliorated for those sources where 4 or 5 rather than 3 epochs are available. However, there are no indications of any systematic velocity differences relating to the number of epochs, the time intervals between the epochs, or the total time spanned between the first and the last epoch. The measurements shown in Figure 1 also do not show selection effects, due to either resolution limitations (against low velocities at high redshifts), or to time sampling limitations (against high velocities at low redshifts).
4. Results
We are still in the process of defining an adequately homogeneous sub-sample of the highest quality motion measurements in which the impact of the effects described above is minimised. But a number of interesting conclusions can already be drawn from the current motion dataset. This includes 262 sources (the other 41 CJF sources have either no redshift or no jet components that could be monitored), with a total of 597 components.
The quasars have a mean apparent velocity of . This is also close to the peak in the distribution, with lower apparent velocities being somewhat less common, as are higher values; most of the quasar apparent velocities are below , but the tail of the distribution extends up to . These statistics confirm the finding of Vermeulen & Cohen (1994) that many of the superluminal velocities reported in the first studies of the 1970s and 1980s have turned out to be amongst the fastest ones in the larger population now available. Apart from the selection effect that faster motions may have been more amenable to study early on, many of the very brightest sources are also amongst the most luminous ones, and we also confirm the strong correlation between apparent velocity and 5 GHz luminosity (see below) already noted in Vermeulen (1995).
There is a pronounced difference between the apparent velocity distributions of the quasars on the one hand, and the galaxies and BL Lac objects on the other hand. Whereas the mean apparent velocity in the quasar jets is , the galaxies have a mean apparent velocity of , and in fact here the distribution peaks at the lowest values, , with most of the apparent velocities below , although there is a tail in the distribution which goes all the way up to . The BL Lacs may be slightly faster than the galaxies on average, with a mean apparent velocity of , but again the distribution peaks at the lowest values, . Most of the BL Lacs have apparent velocities below , and the distribution then cuts off steeply, with no values larger than . In general, such results are in line with previous work (e.g., Vermeulen & Cohen 1994), and with the predictions of beaming and unification models. But we have a much more extensive sample than hitherto available, with different source types at comparable redshifts and luminosities. Before coming to final conclusions, we are carefully re-examining the optical identifications. For example, using very deep optical images some objects may have been labelled as galaxies on the basis of faint extended emission which would not have been visible in less sensitive images. We also have the impression that it is important for the final statistics to differentiate not only between broad-lined (quasar-like) and narrow-lined (galaxy-like) objects, but also between between strong-lined and weak-lined (FR-I BL Lac ?) objects.
Doppler favouritism in simple beaming models combines with the solid angle available to predict a sample in which the apparent velocity distribution is sharply peaked at the maximum possible value (); such models would predict that the measurements shown in Figure 1 would crowd against an upper velocity envelope (e.g., Vermeulen & Cohen (1994). This is obviously not the case, and the actual apparent velocity distribution may instead be dominated by a distribution of Lorentz factors which spans a very broad range over the sample of radio sources (see also Vermeulen & Cohen 1994). There is evidence for this in the very strong correlation with luminosity of the mean apparent velocity, which was already found in a subset of the CJF dataset (Vermeulen 1995), in the sense that no high velocities exist at low luminosity. The correlation can be attributed to a form of Malmquist bias in a sample selected on beamed radio emission (e.g., Lister & Marscher 1997).
Perhaps it will prove to be possible to turn this relationship around, and to deduce, from the observed distributions of apparent velocity, luminosity, and redshift, the luminosity distribution of the parent population from which the CJF sample arose through beaming. But, we first have to study carefully whether the Lorentz factors responsible for the selection of the sources, through relativistic boosting of the radio cores, are indeed tightly related to the Lorentz factors corresponding to the motions of the components. The latter could reflect patterns or shocks moving through the fluid of the jets. And even if the components move at the bulk flow velocity, bending of the jets will give different apparent speeds.
By compiling the statistics of the apparent velocities as a function of distance from the core, we also plan to investigate whether there is evidence for jet acceleration or deceleration between the core and the moving components. Perhaps related to this, very interesting hints have emerged at this Green Bank workshop that the average apparent velocity observed might decrease when going to lower observing frequency. The apparent velocities for CJF at 5 GHz, reported above, seem to be about a factor of two slower than those reported in these proceedings for the 15 GHz VLBA Survey (Zensus et al., these proceedings, page 27), and those in turn might be another factor of two lower than the 43 GHz velocities reported at this workshop by Marscher (these proceedings, page 133). Most of these measurements are as yet preliminary, and the differences between the selections of the various samples will also have to be carefully understood, before it will be warranted to incorporate correlations between observing frequency and apparent velocity firmly into the models. But several options do spring to mind immediately. Jet bending, or deceleration along the jets might be involved. Alternatively, each jet might incorporate a range of flow velocities, possibly in a “spine-sheath” or “onion-skin” geometry (perhaps akin to some models for FR-I sources, for instance in Laing et al. 1999). A decrease in average apparent velocity with decreasing frequency might then result from an increase of the average size and/or distance from the core of the components observed when going to lower frequency. In turn this could plausibly be connected to changing turnover frequencies for features with synchrotron self-absorbed spectra.
And so we have again found at this workshop that Ken Kellermann plays a central role in superluminal motion studies, in which a novel feature now is that we will be able to compare two large surveys: the 6 cm CJF and the 2 cm VLBA Survey, which Ken initiated, and in which he provides important momentum and inspiration.
References
Britzen, S., et al. 1999, in ASP Conf. Ser. Vol. 159, BL Lac Phenomenon, ed. L. O. Takalo, A. Sillanpää, (San Francisco: ASP), 431
Britzen, S., et al. 2001, in IAU Symp. 205, Galaxies and Their Constituents at the Highest Angular Resolutions, ed. R. T. Schilizzi, S. Vogel, F. Paresce, & M. Elvis (San Francisco: ASP), 106
Cohen, M. H., et al. 1971, ApJ, 170, 207
Cohen, M. H., et al. 1977, Nature, 268, 405
Kellermann, K. I. 1966, ApJ, 146, 621
Kellermann, K. I. et al. 1968, ApJ, 153, L209
Kellermann, K. I., et al. 1973, ApJ, 183, L51
Kellermann, K. I., et al. 1974, ApJ, 189, L19
Kellermann, K. I. 1985, Com. Ap., 11, 69
Kellermann, K. I., Vermeulen, R. C., Zensus, J. A., & Cohen, M. H. 1998, AJ, 115, 1295
Laing, R. A., Parma, P., de Ruiter, H. R., & Fanti, R. 1999, MNRAS, 306, 513–530.
Lister, M. L., & Marscher, A. P. 1997, ApJ, 476, 572
Pauliny-Toth, I. I. K., & Kellermann, K. I. 1966, ApJ, 146, 634
Polatidis, A. G., et al. 1995, ApJS, 98, 1
Rees, M. J. 1967, MNRAS, 135, 345
Shaffer, D. B., Cohen, M. H., Jauncey, D. L., & Kellermann, K. I. 1972, ApJ, 173, L147
Taylor, G. B., et al. 1994, ApJS, 95, 345
Vermeulen, R. C. 1995, Proc. Natl. Acad. Sci. USA, 92, 11385 (correction in Proc. Natl. Acad. Sci. USA, 93, 6846)
Vermeulen, R. C., & Cohen, M. H. 1994, ApJ, 430, 467