Sensitive observations at 1.4 and 250 GHz of QSOs
Abstract
We present 1.4 and 5 GHz observations taken with the Very Large Array (VLA), and observations at 250 GHz obtained with the Max-Planck millimeter bolometer (MAMBO) at the IRAM 30 m telescope, of ten optically selected Quasi-stellar Objects (QSOs) at 5.0 . Four sources are detected at 1.4 GHz. Two of the sources have rest-frame 1.4 GHz luminosity densities W Hz-1, placing them in the regime of radio-loud QSOs. Both of these sources are also detected at 5 GHz. These results are roughly consistent with there being no evolution of the radio-loud QSO fraction out to .
Three sources have been detected at 250 GHz or 350 GHz by these, and previous, observations. The (sub)mm flux densities for these three sources are much larger than their 1.4 GHz flux densities. The rapidly rising spectra into the (rest frame) far IR argue that the observed mm emission is likely thermal emission from warm dust, although more exotic possibilities cannot be precluded. The implied IR luminosities are between and 1013 L⊙. For J0301+0020 the radio continuum emission is clearly above that expected for a star forming galaxy based on the radio-FIR correlation. In this case it seems likely that the radio emission relates to the AGN. For J0756+4104 the radio emission is within the range expected for a star forming galaxy, while for J1044–0125 the radio upper limit is at least consistent with a star forming galaxy. If the dust is heated by star formation, the implied massive star formation rates are between 200 and 1000 M⊙ year-1.
We do not detect radio emission from the reported X-ray jet associated with J1306+0356. The lack of radio emission implies that the magnetic field is well below typical equipartition values in powerful radio jets, or that particle acceleration ceased between and years ago, or that the X-ray emission is not inverse Compton emission from a jet related to J1306+0356.
The highest redshift source in our sample (J1030+0524 at ) is not detected at 1.4 or 250 GHz, but four fairly bright radio sources (mJy) are detected in a 2′ field centered on the QSO, including an edge-brightened (’FRII’) double radio source with an extent of about 1′. A similar over-density of radio sources is seen in the field of the highest redshift QSO J1148+5251. We speculate that these over-densities of radio sources may indicate clusters along the lines-of-sight, in which case gravitational lensing by the cluster could magnify the QSO emission by a factor 2 or so without giving rise to arcsecond-scale distortions in the optical images of the QSOs.
1 Introduction
Surveys such as the Sloan Digital Sky Survey (SDSS) (York et al. 2000) have generated large samples of QSOs out to z6. Optical spectroscopy of two of the highest z QSOs revealed, for the first time, evidence for broad, optically thick absorption regions in the (rest frame) far UV, as expected for the neutral intergalactic medium (Gunn & Peterson 1965; Becker et al. 2001; Djorgovski et al. 2001; Pentericci et al. 2002; Fan et al. 2003), suggesting that we are probing into the epoch of reionization, the edge of the “dark ages” when the first stars and massive black holes were formed. Assuming that the intrinsic continuum spectra of the z 5 QSOs are similar to those of nearby QSOs as compiled by Elvis et al. (1994), and that these QSOs are not lensed, Eddington limit arguments result in lower limits of several times for the masses of the black holes in these high redshift objects.
Study of the dynamics of stars and gas in the nuclear regions of nearby galaxies has led to two remarkable discoveries: (i) the overwhelming majority of spheroidal galaxies in the nearby universe contain massive black holes and (ii) there is a correlation between the black hole mass and the velocity dispersion of the stars in the spheroid (Magorrian et al. 1998, Ferrarese & Merritt 2000, Gebhardt et al. 2000, Tremaine et al. 2002). Assuming that these relations also apply in the high redshift universe (Shields et al. 2002), implies that the highest redshift QSOs are associated with massive galaxies (). Furthermore, strong metal emission lines in these QSOs suggests that their environments have been quickly enriched, possibly through starburst activity (Fan et al. 2001).
These fundamental results allow us to investigate the nature of these earliest objects, and in particular to probe the relationship between massive black hole and spheroidal galaxy formation. To address this and other related questions, and in general, to study the cosmic evolution of the radio-to-optical spectra of QSOs, we have undertaken an extensive observational program from radio through millimeter wavelengths of high redshift QSOs which includes: searches for emission from warm dust at millimeter wavelengths from a large sample of z 1.8 QSOs (Carilli et al. 2001a, Omont et al. 2001, 2003), high resolution imaging at cm wavelengths of the non-thermal radio continuum emission from these sources (Carilli et al. 2001a, b), and observations of the CO line emission from selected sources with large infrared luminosities (Carilli, Menten & Yun 1999; Carilli et al. 1999, 2002a, b; Cox et al. 2002; Beelen et al. in prep.).
Millimeter-continuum observations of high redshift QSO’s show that about 30 of the sources are detected in surveys with flux density limits of 1 to 2 mJy at 250 GHz (Omont et al. 2001; Carilli et al. 2001b; Isaak et al. 2002). Multifrequency studies of the rest-frame radio through far IR (FIR) spectral energy distributions (SEDs) of these sources reveal that the mm emission is thermal emission from warm dust (Benford et al. 1999), and in many of the sources the cm-to-mm flux density ratios are consistent with the radio-to-FIR correlation for star forming galaxies (Carilli et al. 2001b). Furthermore, searches for CO line emission from FIR luminous QSOs have resulted in the detection of molecular line emission indicating the presence of large gas reservoirs (M⊙; Cox et al. 2002). These detections lead some authors to conclude that active star formation is inevitable (Omont et al. 2001) in these FIR luminous, CO-rich quasars. Andreani et al. (2002) reached a similar conclusion for lower redshift QSOs, although for both low and high redshift samples the case for star formation is by no means proven.
In this paper we extend our radio study of distant QSOs to the highest redshifts (). We present observations at 1.4, 5, and 250 GHz. These observations are an order of magnitude, or more, more sensitive than survey observations, such as FIRST and NVSS (Becker, White, & Helfand 1995; Condon et al. 1998). We assume a concordance cosmology () and H0 = 65 km sec-1 Mpc-1 throughout.
2 Observations
We observed with the VLA all QSOs known at the time of observation, except J2245+0024 (Sharp, McMahon, Irwin & Hodgkin 2001), which was outside our LST range. The sources are listed in Table 1. Most of the sources come from the SDSS, and hence are luminous QSOs (), with the exception of J0301+0020, which is a low luminosity QSO discovered by Stern et al. (2000b).
VLA observations at 1.4 GHz were made in the A configuration (max. baseline = 30 km), with a total bandwidth of 100 MHz and two polarizations. Each source was observed for about two hours. In addition, J0756+4104 was observed for 2 hours at 1.4 GHz in B configuration (max. baseline = 10 km). Standard phase and amplitude calibration was applied, and all sources were self-calibrated using field sources. The absolute flux density scale was set with observations of either 3C48 or 3C286.
The final images were generated using the wide field imaging (Cotton 1999; Bridle & Schwab 1999) and deconvolution capabilities of the AIPS task IMAGR. The theoretical rms noise () value corresponding to 2 hours of observing in continuum mode at 1.4 GHz is 16 Jy, and in most of the maps presented here this sensitivity is roughly achieved. The noise level in one source (J1204-0021) was higher (35 Jy), possibly due to some low level terrestrial interference. We also include a uncertainty in absolute flux density scale determination. The Gaussian restoring CLEAN beam Full Width at Half Maximum (FWHM) was typically for the A configuration observations.
Two of the sources, J0836+0054 and J0913+5919, were observed at 5 GHz on August 17, 2002 in B configuration for about 20 minutes, achieving an rms sensitivity of about 60Jy111D. Rusin and collaborators also observed J0836+0054 on May 5 at 5 GHz. Their flux densities are equal to ours within the errors.. The Gaussian restoring CLEAN beam (FWHM) was , matching the resolution of the 1.4GHz observations.
Observations at 250 GHz were made using MAMBO (Kreysa et al. 1999) at the IRAM 30m telescope on Pico Veleta in Spain, during the winter of 2001-2002 within dynamically scheduled, pooled observations, except for J0301+0020, which was reported on by Bertoldi & Cox (2002). MAMBO is a 37 element bolometer array with an effective central frequency of 250 GHz for thermal sources. The beam for the feed horn of each bolometer is matched to the telescope beam of 106. Observations were made in standard on-off mode, with 2 Hz chopping of the secondary by 50′′ in azimuth. The data were reduced using the MOPSI software package (Zylka 1998). Pointing was monitored every hour, and was found to be repeatable to within 2′′. The sky opacity was monitored every hour. Zenith optical depths were lower than 0.3 at all times. Gain calibration was performed using observations of Mars, Uranus, and Ceres. We estimate a 20 uncertainty in absolute flux density calibration based on these observations.
The target sources were centered on the central bolometer in the array, and the temporally correlated variations of the sky signal (sky noise) detected in the surrounding six bolometers were subtracted from the central bolometer signal. The total sky + source observing time for each source was about 1 hour, leading to rms sensitivities of 0.5 to 1.0 mJy, depending on the weather.
3 Results
The results from the 1.4 and 250 GHz observations are listed in Table 1. The abbreviated source names (column 1), the redshifts (column 2), the absolute blue magnitude () obtained by assuming a flat dominated cosmology (column 3), and the optical position (columns 4 and 5) are compiled from the optical discovery papers. Columns 6 and 7 give the 1.4 and 250 GHz flux densities with 1 error-bars, and 3 upper limits are given for non-detections.
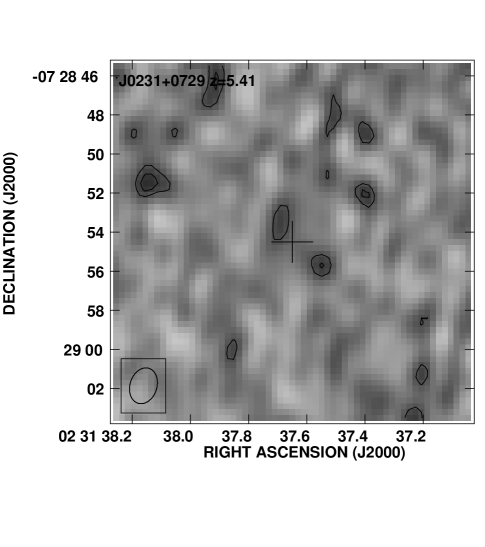
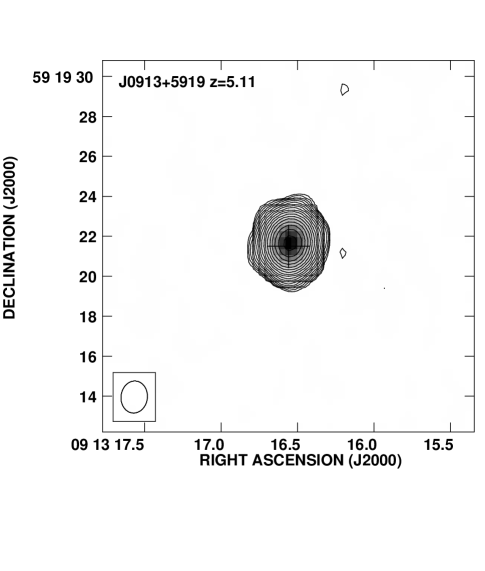
The 1.4 GHz images of these sources are shown in Figure 1. The positional uncertainty for the radio observations is given by: (Fomalont 1999), where FWHM corresponds to that of the Gaussian restoring beam, and SNR=Signal-to-Noise ratio of the detection. For a 3 detection this corresponds to 05 for most of our sources. To this must be added the typical astrometric uncertainty 01 (Pier et al. 2003) of the optical data, and the uncertainty in the relationship between radio and optical reference frame which is about 025 (Deutsch 1999). Thus, we only consider emission within 06 of the optical position to be associated with the QSO.
Fomalont et al. (2003) show that the sub-mJy source counts follow the relation: arcmin-2, with 1.4 GHz flux density, S1.4, in mJy. Hence, within 06 of a given source we expect sources with Jy by chance. Blain et al. (2002) show that there are about 2000 sources deg-2 with S mJy. At this flux density level we then expect 0.01 sources by chance within the beam of the 30m telescope (ie. within of the target source).
Notes on individual sources
J0231–0728 (z=5.41) There is a 3 unresolved source at 1.4 GHz situated 10 away from the optical position of the QSO. This is farther than the 06 positional accuracy of our measurements so J0231-0728 is considered a non-detection at 1.4GHz. This source is also not detected at 250 GHz.
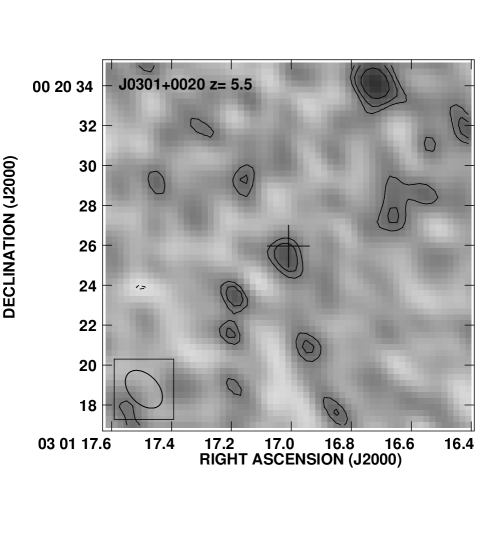
J0301+0020 (z=5.50) A radio continuum source with Jy is detected within 05 of the optical QSO position. The radio source is not resolved, and Gaussian fitting sets an upper limit to its size at 1.4 GHz of 16 . Bertoldi & Cox (2002) detect this QSO at 250 GHz with a flux density of mJy.
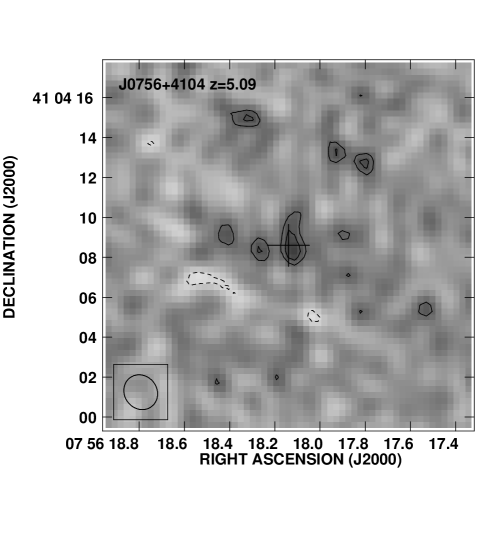
J0756+4104 (z=5.09) The combined A and B configuration observations show a 1.4 GHz source with Jy within of the optical QSO position. Gaussian fitting to the radio emission sets an upper limit to its size of 23 . This QSO is also detected with MAMBO with mJy.
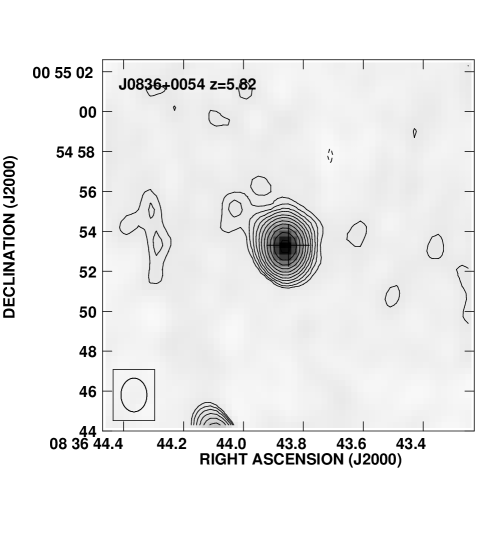
J0836+0054 (z=5.82) This source is clearly detected at 1.4 GHz with a flux density of mJy. Gaussian fitting sets an upper limit to the source size of at 1.4 GHz. J0836+0054 is also detected at 5 GHz with a flux density of Jy. The implied radio spectral index is –0.8. A second radio source with SmJy is detected 10″ south of the QSO. Deep optical and near-IR imaging of this field suggests that this second source is associated with a lower redshift galaxy, and unrelated to the QSO (Rusin et al. in prep). J0836+0054 is not detected at 250 GHz with a upper limit of 2.9 mJy.
J0836+0054 was also detected in the FIRST radio survey (Becker, White & Helfand 1995) at 1.4 GHz with a flux density of 1.10.15 mJy. The difference in flux density between the FIRST measurement and our more recent measurement is significant at the 4 level, such that the radio source appears to be variable on yearly time-scales.
J0913+5919 (z=5.11) This source is clearly detected at 1.4 GHz with mJy. Gaussian fitting to the radio emission sets an upper limit to the source size of at 1.4 GHz. J0913+5919 is also clearly detected at 5 GHz with mJy, implying a spectral index for this source of –0.7. This source is not detected at 250 GHz with a upper limit of 2.8 mJy.
J0913+5919 was also detected in the NVSS radio survey (Condon et al. 1998) with a total flux density of 18.50.5 mJy, implying that the source is not variable on yearly time-scales.
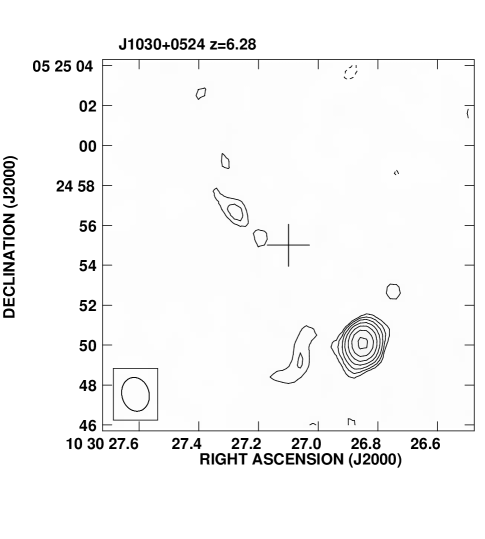
J1030+0524 (z=6.28) This source was the highest redshift QSO published at the time of observation. The source is not detected at 1.4 or 250 GHz. However, four fairly bright sources (Jy) are detected at 1.4 GHz in a 2′ field centered on the QSO (Figure 2), including an edge-brightened double radio source (’Fanaroff-Riley Class II’; Fanaroff & Riley 1974) with an extent of about 1′ and a total flux density of 29 mJy.
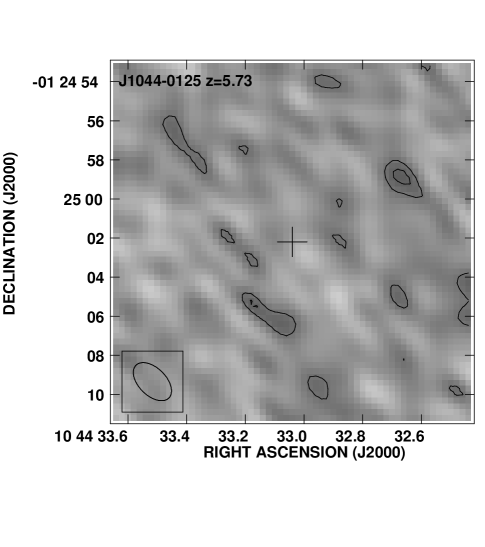
J1044-0125 (z=5.73) This source is not detected at 1.4 GHz with a 3 upper limit of SJy. We did not observe this source with MAMBO. Iwata et al. (2001) report a flux density at 350 GHz for J1044–0125 of mJy. Assuming a thermal IR spectrum typical for Ultraluminous IR galaxies leads to an expected 250 GHz flux density of mJy for a source at . Near-IR spectroscopic observations of this source reveal a prominent CIV absorption feature whose shape suggests that this is a Broad Absorption Line QSO (Maiolino et al. 2001; Goodrich et al. 2001).
4 Analysis
4.1 Fraction of radio loud objects
Questions regarding both the bi-modality of the radio luminosity function of QSOs, and its evolution, have been investigated by numerous workers (e.g. Peacock, Miller & Longair 1986; Miller, Peacock, & Mead 1990; Schmidt, van Gorkom, Schneider, & Gunn 1995; Stern et al. 2000; Lacy et. al 2001; Ivezic et. al. 2002). Two definitions are generally used to demarcate radio-quiet and radio-loud QSOs. One criterion is based on the radio-optical ratio, Rro, of the specific fluxes at rest-frame 5GHz and 4400Å (Kellerman et al. 1989) where typical radio–loud sources have Rro in the range 10–1000, while radio quiet sources have R. Peacock, Miller & Longair (1986) point out that Rro can be used as a discriminating parameter only if the radio and optical luminosities are linearly correlated, which does not seem to be the case (Stocke et al. 1992). The second definition divides the sources at the 1.4 GHz luminosity density of W Hz-1 (Gregg et al. 1996). Ivezic et al. (2002) find that for optically selected QSOs the two definitions are consistent as a consequence of selection effects in flux limited samples, so for the remainder of this paper we will use the Gregg et al. (1996) definition to classify a source as radio loud.
Having the radio spectral indices of the two bright radio sources, J0836+0054 and J0913+5919 ( and , respectively), allows us to estimate their luminosity densities at a rest frame frequency of 1.4 GHz. For J0836+0054 the value is W Hz-1, while that for J0913+5919 is W Hz-1. Both these sources are radio-loud by any definition.
The radio spectral indices for J0756+4104 and J0301+0020 are unknown, so we calculate luminosity densities using the spectral index of adopted in previous studies (eg. Stern et al. 2000, Ivezic et al. 2002). The 1.4 GHz rest frame luminosities for these two sources are and W Hz-1 respectively, placing them below the radio-loud demarcation.
4.2 The radio-FIR correlation
Three sources (J0756+4104, J0301+0020 and J1044-0125) are detected at (sub)mm wavelengths at levels at least ten times above their 1.4 GHz flux densities, implying rapidly rising spectra from cm-to-mm wavelengths. Note that an observing frequency of 250 GHz corresponds to a rest frequency of 1600 GHz (= 188 m) for a source at , such that the MAMBO observations sample the rest frame far IR part of the spectra. Benford et al. (1999) have performed multiwavelength observations of a number of mm-loud high redshift QSOs, and in every case they find that the rest frame far IR SEDs are consistent with a gray body spectrum characteristic of thermal emission from warm dust. In the analysis below we will assume that the rapidly rising cm-to-mm spectra of the three mm-loud sources in our sample imply thermal emission from warm dust. However, we cannot preclude more exotic explanations for the rapidly rising spectra, such as synchrotron self absorption at rest frame far IR wavelengths.
One possible method for addressing the question of dust heating is using the fact that star-forming galaxies at low redshift follow a very tight linear relation between radio continuum and FIR luminosity (Condon & Yin 1990; Condon 1992; Crawford, Marr, Partridge & Strauss 1996; Miller & Owen 2001; Yun, Reddy, & Condon 2001). This correlation holds over four orders of magnitude in luminosity with only a factor of two scatter around linearity for galaxy samples selected in the optical, IR, and radio. While a general correlation is expected since the synchrotron radiation at centimeter wavelengths, and thermal dust emission at IR wavelengths, both relate to massive star formation, the tightness and linearity of the correlation remain puzzling. A further uncertainty in using the FIR-radio correlation, to assess the significance of star-formation in heating the dust, is that lower luminosity radio quiet QSOs at lower redshift also follow the standard radio–FIR correlation for star forming galaxies (Sopp & Alexander 1991). Whether the sources in the Sopp & Alexander sample also host active star formation remains unknown. Also, there is the question of whether the radio-FIR correlation holds in star forming galaxies at high redshift (Carilli & Yun 1999; 2000; Yun & Carilli 2002; Garrett 2001). Given these uncertainties, we feel that comparing centimeter and millimeter continuum luminosities is simply a consistency check for star formation, but not conclusive evidence for it.
Figure 3 shows the relationship between redshift and the 250-to-1.4 GHz spectral index () for a star-forming galaxy taken from the study of Carilli & Yun (2000). This model consists of the mean SED (plus scatter) of 17 low-redshift star-forming galaxies. The far IR part of this model SED corresponds roughly to a modified blackbody spectrum with a dust temperature of 50K and emissivity index of 1.5, and the centimeter part of the spectrum is constrained to follow the radio-to-FIR correlation for star forming galaxies. A point located below the curve (plus scatter) on this diagram indicates a source that is radio loud relative to a star-forming galaxy. In such an object it is likely that the radio emission is due to the AGN and not star formation (Yun et al. 2001).
For J0301+0020 we find , well below the region defined by star forming galaxies. For J0756+4104 we find , which is consistent (within the errors) with the low end of the range for star forming galaxies. For J1044-0125 we extrapolate to 250 GHz from the measured 350 GHz flux density (section 3). This source was not detected at 1.4 GHz, implying , which is at least consistent with star formation. A factor two deeper radio observations are required to test whether this source follows the radio-FIR relationship defined by low redshift galaxies.
4.3 Inverse Compton emission from J1306+0356?
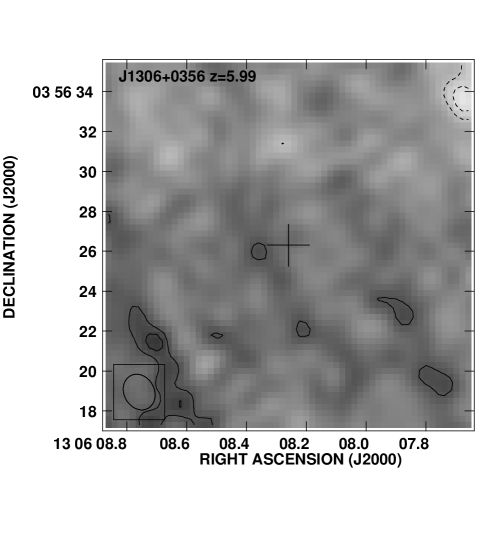
X-ray observations of the source J1306+0356 (Brandt et al. 2002) suggest a possible jet-like feature 23″ from the QSO position (Schwartz 2002). Schwartz (2002) argues that the emission may be due to inverse Compton (IC) scattering of the cosmic background by relativistic electrons in a jet emanating from the QSO. These same relativistic electrons would emit radio synchrotron radiation in the presence of a magnetic field, hence we have searched for radio emission from the location of the jet-like X-ray feature.
We have not detected radio emission from the possible X-ray jet in J1306+0356 to a 3 limit of 150 Jy at 1.4 GHz (after convolving to the resolution corresponding to the box containing the X-ray ’jet’). The flux density of the X-ray feature at 1 keV ( Hz) is Jy, assuming a spectral index of .
A long standing and well documented technique for deriving magnetic fields in extragalactic radio sources is by comparing the radio synchrotron and X-ray IC flux densities (Harris & Grindlay 1979). The constraint on the magnetic field strength comes from the fact that the IC X-ray emissivity is a function of the relativistic electron density and the energy density in the dominant ambient photon field (presumably the microwave background), and the synchrotron radio emissivity is a function of the relativistic electron density and the magnetic energy density. A recent simple parameterization of this calculation can be found in equation 4 in Carilli & Taylor (2002). In the case of the jet-like X-ray feature in J1306+0356, only a radio upper limit is available, such that we can only derive an upper limit to the magnetic field strength. Using equation 4 from Carilli & Taylor (2002), and the X-ray flux density and radio upper limits given above, we derive an upper limit of 3G to the magnetic field in the jet-like feature in J1306+0356. Note that this limit assumes the X-ray emission is IC, and that the relativistic electrons have a power-law energy distribution of index –3 over a wide range in energy (see Section 5.3 for more details).
5 Discussion
5.1 Radio loud QSOs at high redshift
There has been considerable debate in the literature about the redshift evolution of the radio-loud fraction of QSOs (e.g. Visnovsky et al. 1992; Schneider, van Gorkom, Schmidt & Gunn 1992; Schmidt, van Gorkom, Schneider, & Gunn 1995; Hooper et al. 1995; Goldschmidt et al. 1999; Stern et al. 2000). Most recently Ivezic et al. (2002) have investigated this question using large samples of QSOs out to from the SDSS. They conclude that about 8 of QSOs are radio-loud, independent of redshift. Two out of the ten QSOs at observed in our study are radio-loud, which is roughly consistent (given the small number statistics) with the fraction seen at lower redshift, eg. the Poisson probability of seeing 2 radio–loud quasars when the expectation value is 0.8 is 14. As emphasized by Ivezic et al (2002), larger QSO samples at high redshift are required to separate effects related to redshift-luminosity biases in flux limited samples.
The radio loud sources J0836+0054 and J0913+5919 are compact (″ ) and have steep spectra (–0.8 and –0.7), classifying them as Compact Steep Spectrum (CSS) objects. CSS objects are a mixed-bag of source types, ranging from steep spectrum core-jets (size few pc), to small (size kpc), double-lobed radio galaxies, ie. compact symmetric objects (CSOs; Tzioumis et al. 2002). The CSOs are particularly intriguing since they are thought to be very young radio sources, and their ages can be measured through VLBI observations of the proper motions of the radio hot spots, with typical measured ages between 103 and 104 years (Polatidis & Conway 2002). Recent VLBI imaging of J0836+0054 by Frey et al (2003) at 1.6 GHz shows a marginally resolved source at 10 mas resolution, suggesting that this source is a steep spectrum core-jet, and not a CSO. Similar VLBI imaging has not been performed for J0913+5919, but the lack of variability of this source (section 3) makes it a prime candidate for a high redshift CSO.
In either case, the fact that the radio-loud fraction of QSOs appears to be relatively constant out to very high redshift, and that the two radio-loud QSOs at discovered thus far have steep radio spectra, is encouraging from the perspective of studying the neutral intergalactic medium (IGM) during the epoch of reionization through observation of HI 21cm absorption (the ’21cm Forest’). Calculations by Carilli, Gnedin, & Owen (2002), and Furlanetto & Loeb (2002) show that the next generation low frequency, large area radio telescopes, such as the LOFAR and the Square Kilometer Array, will be able to study the neutral IGM beyond the epoch of reionization (EOR) in H I 21cm absorption toward discrete radio sources as faint as a few mJy at frequencies below 200 MHz. Both J0836+0054 and J0913+5919 would be easily adequate for such studies if they were placed beyond the EOR.
5.2 Thermal emission from warm dust and star formation
Three of the ten sources in our study (J0301+0020, J0756+4104, and J1044-0125) have been detected at (sub)mm wavelengths with flux densities much larger than their 1.4 GHz flux densities. Again, such steeply rising spectra provide strong evidence that the (sub)mm emission is thermal emission from warm dust.
We have considered these sources in the context of the radio-to-FIR correlation for star forming galaxies, as quantified in the 1.4-to-250 GHz spectral index, (Figure 3). For J0301+0020 the value is clearly below that expected for a star forming galaxy. In this case it seems likely that the radio emission relates to the AGN activity. For J0756+4104 the value is within the range defined by star forming galaxies, while for J1044–0125 the lower limit to is at least consistent with a star forming galaxy.
Given the interest in co-eval massive black hole–spheroidal galaxy formation, it is instructive to consider what the properties of these sources would be if the 250 GHz emission were a result of dust heated by a starburst. Using the relations between 250 GHz flux density, FIR luminosity, and star formation rates, in Omont et al. (2003) based on typical spectra of low redshift ultra-luminous infrared galaxies (i.e. Arp 220) leads to: L⊙ for J0301+0020, L⊙ for J0756+4104, and L⊙ for J1044–0125222Shioya et al. (2003) have found a faint optical galaxy located within 19 of the quasar. They suggest that the QSO may be gravitationally magnified by this galaxy by a factor of about two. We have not corrected for this magnification in the calculations above., and massive ( M⊙) star formation rates of 200, 1000, and 500 M⊙ year-1, respectively. At these extreme star-formation rates most of the stars in a large spheroidal galaxy could form in a dynamical time of years. However, it should again be stressed that these rates assume the dust is heated by star formation, as opposed to being heated by the AGN itself.
5.3 X-ray-loud, radio-quiet jets at high redshift?
We have not detected radio emission from the reported X-ray ’jet’ in J1306+0356 (Schwartz 2002). The implied upper limit to the magnetic field (3G) is more than an order of magnitude below typical magnetic field values in powerful radio jets. Perhaps the simplest conclusion from these results is that the X-ray feature is not IC emission from a jet emanating from J1306+0356.
It is possible that such a jet could be Inverse Compton X-ray-loud and still be radio-quiet, even for strong magnetic fields, due to the different radiative lifetimes of the particles involved. The spectral peak of the CMB behaves as (1+z) Hz, such that observations at 1 keV are sensitive to electrons with Lorentz factors, , independent of redshift. The radiative lifetime of such electrons at is years. For comparison, observations of a jet at 1.4 GHz probe electrons with , assuming a 50G magnetic field, corresponding to a radiative lifetime years. If particle acceleration ceased between 106 and 107 years ago, then the exponential cut-off at high energies in the relativistic particle population might lead to the situation observed, ie. an X-ray-loud but radio-quiet jet. More sensitive X-ray observations, and lower frequency radio observations, are required to test this interesting possibility.
5.4 Over-densities of radio sources toward the highest redshift QSOs
For the highest redshift QSO in our sample, J1030+0524 at (Figure 2), we find four fairly bright radio sources (Jy) within 1′ of the QSO, one of which is an arcmin-scale powerful double (FRII) radio source. Note that for a 2′ field one expects only 0.5 sources by chance with SJy. It seems unlikely that the sources are at the redshift of the QSO, since an arcmin-scale double radio galaxy has never been detected beyond (Carilli et al. 1997). Interestingly, the highest redshift QSO known, J1148+5251 at (Fan et al. 2003), also has two bright radio sources (8 and 70 mJy at 1.4 GHz) within 1′ of the QSO position (Bertoldi et al. 2003).
A possible explanation for the excess radio source density in the fields of the two highest redshift QSOs is that the radio sources are in a group or cluster that happens to lie along the line-of-sight. If this is the case, then gravitational lensing by the cluster could magnify the QSO emission by a factor 2 or so without giving rise to arcsecond-scale distortions in the optical images of the QSOs.
The National Radio Astronomy Observatory is operated by Associated Universities, Inc., under a cooperative agreement with the National Science Foundation. M.A.S. acknowledges support of NSF grant AST-0071091.
References
- (1) Anderson, S. F., Fan, X., Richards, G.T. et al. 2001, AJ 122, 503
- (2) Andreani, P., Cristiani, S., Grazian, A., La Franca, F., & Goldschmidt, P. 2002, AJ, in press
- (3) Becker, R. H., White, R.L., Helfand, D. J., 1995, ApJ, 450, 559
- (4) Becker, R. H., Fan, X., White, R. L., Strauss, M.A. et al. 2001, AJ, 122, 2850
- (5) Beelen, A., 2003, in prep.
- (6) Benford, D. J., Cox, P., Omont, A., Phillips, T.G., & McMahon, R.G., 1999, ApJ 518, 65
- (7) Bertoldi, F., & Cox, P., 2002, A&A, 384L, 11
- (8) Blain, A.W., Smail, I., Ivison, R.J., Kneib, J.-P., & Frayer, D.T., 2002, Phys. Rept. 369, 111
- (9) Brandt, W.N., Schneider, D.P., Fan, S., Strauss, M.A., et al. 2002, ApJ, 569, L5
- (10) Bridle, A.H. & Schwab, F.R. 1999, Bandwidth and Time-Average Smearing, in Synthesis Imaging in Radio Astronomy II eds. Taylor, G.B., Carilli, C.L., & Perley, R.A., Astronomical Society of the Pacific Conference Series vol. 180, p. 371
- (11) Carilli, C.L., Bertoldi, F., Omont, A., Cox, P. et al. 2001a, AJ, 122, 1679
- (12) Carilli, C.L., Bertoldi, F., Rupen, M.P., Fan, X., et al. 2001b, ApJ, 555, 625
- (13) Carilli, C.L., Cox, P., Bertoldi, F., Menten, K.M, et al. 2002b, ApJ, 575, 145
- (14) Carilli, C.L., Gnedin, N.Y. & Owen, F. 2002, ApJ 577, 22
- (15) Carilli, C.L., Kohno, K., Kawabe, R., Ohta, K., et al. 2002a, 123, AJ, 1838
- (16) Carilli, C.L., Rottgering, H., Miley, G., Pentericci, L., & Harris, D. 1997, in The most distant radio galaxies, eds. H. Rottgering, P. Best, & M. Lehnert, (Amsterdam: Royal Dutch Academy), p. 123
- (17) Carilli, C.L. & Taylor, G.B. 2002, ARA&A, 40, 319
- (18) Carilli, C.L. & Yun, M.S., 2000, ApJ, 530, 618
- (19) Carilli, C.L. & Yun, M.S., 1999, ApJ, 513, 13
- (20) Carilli, C.L., Menten, K.M., & Yun, M.S.,1999, ApJ, 521, L25
- (21) Condon, J.J., Cotton, W.D., Greisen, E. W., Yin, Q. F., et al. 1998, AJ, 115, 1693
- (22) Condon, J.J. 1992, ARA&A, 30, 575
- (23) Condon, J.J. & Yin, Z.F. 1990, ApJ 357, 97
- (24) Cotton, W.D., 1999, in Synthesis Imaging in Radio Astronomy II, ASP Vol. 180, eds. Taylor, G.B., Carilli, C.L., & Perley, R.A., (San Francisco: Astronomical Society of the Pacific), p. 357
- (25) Cox, P., Omont, A., Djorgovski, S.G., Bertoldi, F., et al. 2002, A&A, 387, 406
- (26) Crawford, T., Marr, J., Partridge, B., & Strauss, M.A., 1996, ApJ, 460, 225
- (27) Dale, D., Silbermann, N.A, Helou, G., Valjavec, E., et al. 2000, AJ, 120, 583
- (28) Dale, D., Helou, G., Contursi, A., Silbermann, N., & Sonali, K., 2001, ApJ, 549, 215
- (29) Deutsch, E. W., 1999, AJ, 118, 1882
- (30) Djorgovski, S. G., Castro, S., Stern, D., Mahabal, A. A. 2001, ApJ, 560, L5
- (31) Elvis, M., Wilkes, B.J., McDowell, J.C., Green, R., et al. 1994, ApJS, 95, 1
- (32) Fan, X., Strauss, M.A., Schneider, P., Gunn, J.E., et al. 2000a, AJ 119, 1
- (33) Fan, X., White, R.L., Davis, M., Becker, R. H., et al. 2000b, AJ, 120, 1167
- (34) Fan, X., Narayanan, V., Lupton, R. H., Strauss, M. A., et al., 2001, AJ, 122, 2833
- (35) Fan, X., Strauss, M.A., Becker, R., Schneider, D. et al. 2003, AJ, in press
- (36) Fanaroff, B.L. & Riley, J.M. 1974, MNRAS, 167, 31
- (37) Ferrarese, L., & Merritt, D. 2000, ApJ, 539, L9
- (38) Fomalont, E. B., 1999 in Synthesis Imaging in Radio Astronomy II, ASP Vol. 180, eds. Taylor, G.B., Carilli, C.L., & Perley, R.A., (San Francisco: Astronomical Society of the Pacific), 301
- (39) Fomalont, E.G., 2002 in prep.
- (40) Frey, S., Mosoni, L., Paragi, Z., & Gurvits, L. MNRAS 2003, submitted
- (41) Furlanetto, S.R. & Loeb, A. 2002, ApJ, 579, 1
- (42) Garrett, M.A. 2001, in The Central Kiloparsec of Starbursts and AGN, ASP Vol. 249, eds J. H. Knapen, J. E. Beckman, I. Shlosman, and T. J. Mahoney (San Francisco: Astronomical Society of the Pacific), 652
- (43) Gebhardt, K., Kormendy, J., Ho, L., Bender, R., et al. 2000, ApJ, 543, L5
- (44) Goldschmidt, P., Miller, L., La Franca, F., & Christiani, S. 1992, MNRAS, 256, P65
- (45) Goodrich, R.W., Campbell, R., Chaffee, F.H, Hill, G.M., et al. 2001, ApJ, 561, L23
- (46) Gregg, M. D., Becker, R. H., White, R.L., Helfand, D.J., et al. AJ, 112, 470
- (47) Gunn, J.E. & Peterson, B. A. 1965, ApJ, 142, 1633
- (48) Harris, D.E. & Grindlay, J.E. 1979, MNRAS, 188, 25
- (49) Hooper, E.J., Impey, C.D., Foltz, C.B., & Hewett, P.C. 1995, ApJ, 445, 62
- (50) Isaak, K. et al. 2002, MNRAS, 329, 149
- (51) Ivezic, Z., Menou, K., Strauss, M., Knapp, G.R., et al. 2002, AJ, 124, 2364
- (52) Iwata, I., Ohta, K., Nakanishi, K., Kohno, K. & McMahon, R. 2001, PASJ, 53, 871
- (53) Kreysa, E., Gemuend, H.P., Gromke, J., Haslam, C.G., et al. 1999, SPIE, 3357, 319
- (54) Magorrian, J., Tremaine, S., Richstone, D., Bender, R., et al. 1998, AJ, 115, 2285
- (55) Maiolino, R., Mannucci, F., Baffa, C., Gennari, S., & Oliva, E., 2001, A&A, 372, L5
- (56) Miller, L., Peacock, J. A., Mead, A. R. G. 1990, MNRAS, 244, 207
- (57) Omont, A., Cox, P., Bertoldi, F., McMahon, R.G., et al. 2001, A&A, 374, 371
- (58) Omont, A., Beelen, A., Bertoldi, F. et al. 2003, A&A, in press
- (59) Peacock, J. A., Miller, L., & Longair, M.S., 1986 MNRAS 218, 265
- (60) Pentericci, L., Fan, X., Rix, H.-W., Strauss, M. A., et al. 2002, AJ, 123, 2151
- (61) Pier, J.R., Munn, J.A., Hindsley, R.B., Hennessy, G.S., et al. 2003, AJ in press, ASTROPH 0211375
- (62) Polatidis, A.G. & Conway, J.E. 2002, in The third GPS/CSS workshop, Pub. Astron. Soc. Australia, Vol 20, eds. Tzioumis, T., de Vries, W., Snellen, I., Koekemoer, A. (ASA: Sydney)
- (63) Schmidt, M., van Gorkom, J.H., Schneider, D.P., Gunn, J. E. 1995, AJ 109, 473
- (64) Schneider, D.P., van Gorkom, J.H, Schmidt, M., & Gunn, J.E. 1992, AJ 103, 1451
- (65) Schwartz, D.A., 2003, ApJ, in press., ASTROPH 0202190
- (66) Sharp, R.G., McMahon, R.G., Irwin, M.J., & Hodgkin, S.T., 2001, MNRAS 326, L45
- (67) Shields, G.A., Gebhardt, K., Salviander, S. et al. 2002, ApJ, in press
- (68) Shioya, Y., Taniguchi, Y., Murayama, T., Ajiki, M., et al. 2003, PASJ, in press, ASTROPH 021388
- (69) Sopp, H. & Alexander, P., 1991, MNRAS 251P 14
- (70) Stern, D., Djorgovski, S.G., Perley, R.A., de Carvalho, R.R, & Wall, J.W. 2000b, AJ, 119, 1526
- (71) Stern, D., Spinard, H., Eisenhard, P., Bunker, A., et al. 2000a, ApJ, 533, L75
- (72) Stocke, J., Morris, S. L., Weymann, R. J., & Foltz, C. B. 1992, ApJ, 396, 487
- (73) Tremaine, S., Gebhardt, K., Bender, R., Bower, G., et al. 2002, ApJ 574, 740
- (74) Tzioumis, T., de Vries, W., Snellen, I., Koekemoer, A. 2002, The third GPS/CSS workshop,’, Pub. Astron. Soc. Australia, Vol 20, (ASA: Sydney)
- (75) Visnovsky, K. L., Impey, C. D., Foltz, C. B., Hewett, P. C., et al. 1992, ApJ, 391, 560
- (76) York, D.G., Adelman, J., Anderson, J.E., Anderson, S.F., et al. 2000, AJ 120, 1579
- (77) Yun, M.S. & Carilli, C. L. 2002, ApJ 568, 88
- (78) Yun, M.S., Reddy, N.A., & Condon, J.J. 2001, ApJ 554, 803
- (79) Zheng, W., Tsvetanov, Z., Schneider, D., Fan, X., et al. 2000, AJ 120, 1607
- (80) Zylka, R. 1998, MOPSI Users Manual, (IRAM: Grenoble)
| Optical Position (J2000) | S1.4 | S250 | ||||
|---|---|---|---|---|---|---|
| QSO | RA () | DEC (° ′ ″ ) | [Jy] | [mJy] | ||
| J0231–0729aaAnderson et al. 2001 | 5.41 | -27.37 | 02 31 37.65 | -07 28 54.5 | ||
| J0301+0020bbStern et al. 2000b | 5.50 | -24.00 | 03 01 17.01 | 00 20 26.0 | 73 18 | 0.87 0.2 |
| J0756+4104aaAnderson et al. 2001 | 5.09 | -26.50 | 07 56 18.14 | 41 04 08.6 | 65 17 | 5.50.5 |
| J0836+0054ccFan et al. 2001 | 5.82 | -28.10 | 08 36 43.85 | 00 54 53.3 | 1750 40 | |
| J0913+5919aaAnderson et al. 2001 | 5.11 | -26.20 | 09 13 16.56 | 59 19 21.5 | 18950 380 | |
| J1030+0524ccFan et al. 2001 | 6.28 | -27.37 | 10 30 27.10 | 05 24 55.0 | ||
| J1044–0125ddDjorgovski et al. 2001; Fan et al. 2000b | 5.73 | -27.63 | 10 44 33.04 | -01 21 49.6 | 3.41.1eeExtrapolated from 350 GHz (section 3) | |
| J1204–0021ffFan et al. 2000a | 5.03 | -27.64 | 12 04 41.73 | -00 21 49.6 | NA | |
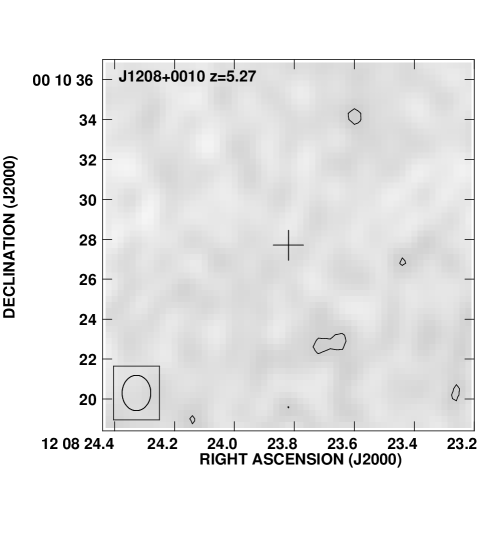
| J1208+0010ggZheng et al. 2000 | 5.27 | -26.30 | 12 08 23.82 | 00 10 27.7 | ||
| J1306+0356ccFan et al. 2001 | 5.99 | -27.41 | 13 06 08.26 | 03 56 26.3 | ||
Figure Captions
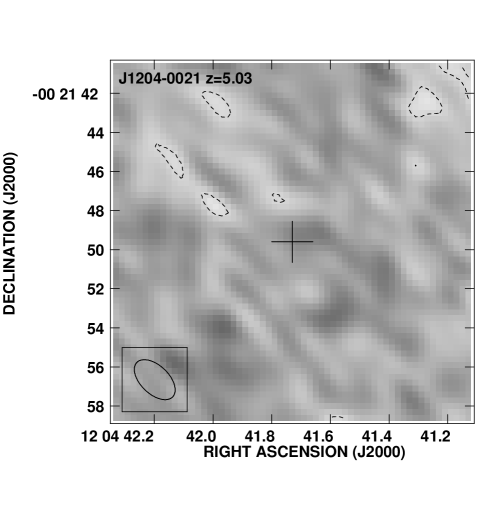
Figure 1: Images at 1.4 GHz of the ten high redshift quasars discussed in
this paper. The FWHM of
the Gaussian restoring beams are shown in the insets in all frames.
Contour levels (solid lines) are a geometric
progression in the square root of two starting at 2, with
listed below
( corresponds to the measured rms on the image). Two negative
contours (dashed) are included. The central cross in each image
marks the optical QSO location.
Fig1a = J0231-0728, = 16.6 Jy beam-1;
Fig1b = RD J0301+0020, = 17.2 Jy beam-1;
Fig1c = J0756+4104, = 17 Jy beam-1;
Fig1d = J0836+0054, = 21.6 Jy beam-1;
Fig1e= J0913+5919, = 14 Jy beam-1;
Fig1f= J1030+0524, = 20.3 Jy beam-1;
Fig1g= J1044-0125, = 26.5 Jy beam-1;
Fig1h= J1204-0021, = 29 Jy beam-1;
Fig1i= J1208+0010, = 20 Jy beam-1;
Fig1j= J1306+0356, = 17.8 Jy beam-1;
Figure 2: A wider field image of J1030+0524 at 1.4 GHz. The FWHM of the Gaussian restoring beam is . Contour levels are a geometric progression in the square root two starting at 0.13 mJy beam-1. Three negative contours (dashed) are included. The cross shows the position of the optical QSO.
Figure 3: The relationship between redshift and the observed spectral index between 250 and 1.4 GHz for star-forming galaxies (solid curve), as derived from the models presented in Carilli & Yun (2000). The dashed lines show the rms scatter in the distribution. The 250–to–1.4 GHz spectral indexes for QSOs detected at 250 GHz are shown with 1 error bars.
![[Uncaptioned image]](/html/astro-ph/0304097/assets/x11.png)
![[Uncaptioned image]](/html/astro-ph/0304097/assets/x12.png)