HOW ARE EMERGING FLUX, FLARES AND CMES RELATED TO MAGNETIC POLARITY IMBALANCE IN MDI DATA?
Abstract
In order to understand whether major flares or coronal mass ejections (CMEs) can be related to changes in the longitudinal photospheric magnetic field, we study 4 young active regions during seven days of their disc passage. This time period precludes any biases which may be introduced in studies that look at the field evolution during the short-term flare or CME period only. Data from the Michelson Doppler Imager (MDI) with a time cadence of 96 minutes are used. Corrections are made to the data to account for area foreshortening and angle between line of sight and field direction, and also the underestimation of the flux densities. We make a systematic study of the evolution of the longitudinal magnetic field, and analyze flare and CME occurrence in the magnetic evolution. We find that the majority of CMEs and flares occur during or after new flux emergence. The flux in all four active regions is observed to have deviations from polarity balance both on the long-term (solar rotation) and on the short term (few hours). The long-term imbalance is not due to linkage outside the active region; it is primarily related to the east-west distance from central meridian, with the sign of polarity closer to the limb dominating. The sequence of short term imbalances are not closely linked to CMEs and flares and no permanent imbalance remains after them. We propose that both kinds of imbalance are due to the presence of a horizontal field component (parallel to the photospheric surface) in the emerging flux.
keywords:
sun: flares – sun: magnetic fields1 Introduction
Flares and coronal mass ejections (CMEs) are magnetic phenomena, thought to derive their energy from the coronal magnetic fields. However, reliable observations of the weak coronal fields are not yet available even though some attempts have recently been made [Lin, Penn, & Tomczyk (2000)]. Instead, indirect methods are used to determine information on the coronal fields by reconstruction using extrapolations, which have the photospheric flux distribution as the boundary condition, and use certain assumptions (e.g. that the field is force–free). The coronal fields are line tied at the photosphere, and it is then natural to investigate the photospheric field observations to search for signatures of flares and CMEs. Understanding the long-term evolution of the photospheric magnetic field leading up to the onset of CMEs and flares will help to constrain the theoretical models, and to identify the instabilities involved. Still a confident signature relating the magnetic field evolution to event onset remains elusive.
Vector magnetic field data enable us to study the magnetic shear in an active region (AR) by comparing the observed magnetic field direction with the one of the potential field computed with the same vertical field distribution. Most studies (e.g. \opencitehagyard84 and references here after) have focused on the analysis of the magnetic shear across the photospheric inversion line of the vertical field component (because at this location the transverse field is best measured due to the absence of cross talk and Faraday rotation). Observations of M and X class flares have shown that the shear angle can decrease [Sakurai et al. (1992)], increase [Wang et al. (1994)] or remain the same [(22), Li et al. (2000a)] after a flare. These different results, from flare to flare, are even present when data from the same instrument are analyzed by the same authors [(2), Chen et al. (1994)]. Moreover, significant change in the magnetic shear is likely to be localized in the flaring part of the active region rather than on the inversion line [Li et al. (2000b)].
In order to use vector data, the 180 degree ambiguity in the magnetic field direction must first be resolved. This ambiguity is not a simple problem to deal with (a general solution is not presently known, see e.g. \inlinecitegary95 and references therein). Moreover, magnetic fields crossing the inversion line in the opposite way to that of a potential field are known to exist, e.g. in a prominence body [Bommier et al. (1994)] and also extending down in the prominence feet [Aulanier and Démoulin (1998)]. Furthermore, the errors in transverse vector field measurements are large, around 200 G, meaning that only data in high field strength regions can be considered as reliable. However, even for large flares, flare ribbons are hardly observed within sunspots, indicating that energy release involves mostly the weaker fields around sunspots. These large uncertainties on the transverse vector field are even reflected on global quantities, such as the free magnetic energy, and present observations do not have large enough spatial resolution and precise measurements to monitor the changes during a large flare [Klimchuk, Canfield & Rhoads (1992)]. Then, the 180 degree ambiguity and the errors on the transverse field play an important role in the apparently mixed results of how the field changes around flare times.
Measurements of the longitudinal field component are more precise, because the errors are an order of magnitude smaller (20G). Studies of flares have shown that they occur frequently in magnetically complex regions, such as -spots (see e.g. \opencitegaizauskas98 and references therein) which are known to have highly sheared fields. Flares have also been linked to emerging flux (see e.g. \opencitemartres68). Indeed, Martres et al. found that flares are often linked to two evolving polarities of opposite magnetic sign. They where able to follow the time evolution only with the white light images. They found that flares are preferentially related to polarities where one has a growing area while the other one is decreasing. They interpreted the white light area evolution as an increase in the magnetic polarity imbalance. However, \inlineciteharvey76 had difficulties finding a reliable polarity evolution related to flares using magnetograms in both H and Fe I lines (in particular, they concluded “flares do not seem to be associated with the areas where the largest flux changes occur”).
The most energetic flares, namely those with X-ray flux above 10-4 Wm-2 (GOES X-class), are expected to be related to the largest evolution of the magnetic field configuration, and so they are the first to be investigated. Most X-class X-ray flares occur in concert with CMEs (although this is not always the case, \opencitegreen02) and these may offer a way to study the change in the AR fields related not only to the flare, but also to the CME. Changes in the longitudinal magnetic field associated to X-class flares were investigated by \inlinecitewang02. They looked for changes in the magnetic field at the photospheric level around the time of the flare only, and found an impulsive change in each of the six cases studied which they proposed to be permanent. They observed a lack of balance between the leading and following polarity; the magnetic flux in the leading polarity increased from 1020 Mx to 1021 Mx, while each event showed a decrease in the following polarity that could be between one order of magnitude lower and of similar magnitude as the corresponding increase in the leading polarity. This effect was seen to be independent of the flare distance to the central meridian and was localized to a small area on the flaring neutral line in four out of the six cases, while it involved the full AR in the two others. The authors suggest that the presence of a very inclined magnetic field could explain these deviations from polarity balance (due to projection effects). Still they needed three different mechanisms to, at least qualitatively, explain their observations (see their Table 2).
When using longitudinal data to study CME onsets, it may be more useful to look to the long-term evolution of the magnetic field in the period leading up to the CME to find clues on the instability which results in the eruption, since a long-term shearing of the magnetic configuration is expected in most theoretical models. It is also important to investigate the magnetic field variations outside the flare and CME period to infer if the changes associated to the flare and CME are relevant or not.
On the short term, since the coronal instability initiating the CME is not able to alter significantly the vertical magnetic field distribution at the photosphere, we do not expect to observe important magnetic changes at the photospheric level as a result of a CME. However, we may see an evolution of the longitudinal field indicating, for example, the role of new flux emergence. \inlinecitelara00 used MDI data to search for a photospheric signature in a time period of a few days, before, during and after 8 CMEs. They found that the observed magnetic flux in the entire active region showed no obvious change associated to the CME on the short term, but that flare associated CMEs occurred during the maximum phase of magnetic flux emergence. In fact, many works have related flare and CME activity to emerging flux; for example, for flares most of the works cited in the second and fourth paragraphs of this section, while for CMEs we refer to \inlinecitefeynman95, \inlineciteplunkett97, \inlinecitetang99, and \inlinecitewang99. The usual requirement being that the emerging magnetic flux is oriented favourably to allow reconnection with the pre-existing field.
In this paper we present observations of the evolution of the longitudinal magnetic field of 4 emerging active regions as they cross the solar disc. Magnetic data from the MDI instrument onboard SOHO are used to determine the total observed flux of both magnetic polarities in each AR. We study whether any deviation from polarity balance is an instrumental or geometrical artifact. Section 2 describes the Michelson Doppler Imager and Section 3 details our analysis. Section 4 presents the ARs chosen and their flare and CME activity. Section 5 details the time evolution of the deviation from polarity balance. In Section 6 we discuss the possible origins for these deviations. We conclude in Section 7 about the absence of a confident signature which relates CME or flare occurrence to deviation from polarity balance. We rather relate these imbalances to flux emergence.
2 Overview of MDI
The Michelson Doppler Imager (MDI, \opencitescherrer95) takes five narrowband (94 mÅ) filtergrams at different positions along the Ni I 6767.8 Å absorption line, formed in the mid-photosphere. MDI then computes Doppler velocity and continuum intensity from the filtergrams. The velocity calculation refers to an onboard lookup table constructed from synthetic line profiles and measured filter transmission profiles. Waveplates allow the right (RCP) and left-handed circular (LCP) polarization signals to be measured, and the longitudinal magnetic flux density is given by the difference in Doppler shifts of the RCP and LCP values. The spatial resolution of the full disc magnetograms is 4 arcsec (pixel size is 2 arcsec). MDI returns the flux density averaged over the pixel field of view and from this the flux within a required area can be found.
As with any magnetograph, MDI has some instrumental effects. Data with low continuum intensities are expected to be related to strong field regions and, therefore, they should have high flux densities. Lower than expected flux densities may be produced by mixed polarities within the resolution element, as MDI returns the flux density averaged over the pixel field of view. However, it has also been observed that sunspot umbras with very low continuum intensity values sometimes return low flux densities instead of the high values expected. Further investigation showed that this is produced by a failure in the onboard algorithm when the lookup table saturates [Liu and Norton (2001)]. Indeed, very low continuum intensities can result in the Ni I line profile almost disappearing. This produces corrupted pixels and the observations show the unexpected result of the flux densities in the centre of the sunspot umbra being much lower than that in the surrounding, outer pixels. These corrupted pixels can be identified by plotting the pixel continuum intensity against flux density. A tail of data points, where counter-intuitively the lowest intensity pixels have low magnetic flux densities, is formed when corrupted data are present. \inlineciteliu01 also found, using the Harvard-Smithsonian Reference Atmosphere model [Giggerich et al. (1971)] to compute line profiles, that MDI underestimates flux densities by as much as 30%, with the largest underestimation applying to the higher flux densities.
berger02 analyzed co-temporal and co-spatial MDI data with data from the Advanced Stokes Polarimeter (ASP) to compare the flux densities measured by each instrument. They found that MDI systematically measured lower flux densities than did ASP. MDI underestimated the flux densities in a linear way for MDI pixel values below 1200G by approximately a factor 1.45. For flux densities higher than 1200G the underestimation became strongly non-linear and the magnetic field measured by MDI saturated at G, whereas for ASP the corresponding field increased. The underestimation appears to be inherent to the MDI calibration and does not result from the different instrument resolutions.
3 Data Analysis
This study uses the full disc level 1.5 MDI magnetograms. These data are the average of 5 magnetograms with a cadence of 30 seconds and a noise error of 20 G per pixel [Scherrer et al. (1995)]. They are constructed once every 96 minutes. The error in the flux densities per pixel in the averaged magnetograms is then G, and each pixel has a mean area of Mm2 (the exact area depends on the Sun-Earth distance).
In order to find the AR flux, a polygonal contour defined by eye is fitted around the AR, taking as the boundary the sharp flux density change between the young AR and the network field. Within this region the flux is summed. In this way we minimize the contribution of the background field not related to the AR. The number of sides to the polygon is determined by the complexity of the AR shape, but is typically close to 20. The flux evolution of the ARs cannot be followed to the solar limb as the data become too distorted within approximately 25 degrees of the limb.
The G noise in each MDI pixel introduces an error into the AR flux measurements, since each AR covers around 5000 pixels. For an AR with a total flux of the order of Mx, the noise introduces an error of around 0.1%. In fact, the main error in the AR flux measurement arises from the definition of the polygonal region within which the flux is found. There will be included in the region small flux elements of the background field. The change in the total flux, from one flux measurement to the next, associated to these flux elements moving across the polygon boundary produces a modification of the imbalance of the order of 1% of the AR flux as the flux in these elements is low (of the order Mx). Whenever these elements enter or cancel with the opposite polarity inside the defined polygon, they produce short term (on time scale of hours) deviations from polarity balance. The tiny fluctuations present in the curves in Figure 4 include such effects (curves are not smoothed, so they have a time resolution of 96 min). On the long-term, the presence of a dominant background polarity surrounding the AR has a cumulative effect (with or without cancellation with the AR field) since more and more background field is included in the ever increasing AR area. The magnitude of this effect is more difficult to quantify, but we note that the main objective is rather to study the possible link between CMEs, flares and the short-term imbalance. It is possible to derive an upper bound estimate of this systematic effect at CMP, Figure 4 shows that it is below Mx for the four ARs studied (and that other contributions to the imbalance are present: see Section 6.6).
In order to study the evolution of the magnetic field, the MDI data must be corrected for the instrument calibration effects and geometrical distortions. These include:
-
•
Correcting for the angle between the magnetic field direction and the observer’s line of sight. In this case we assume that the field is radial at the photosphere and correct for the reduction by that the flux density experiences as the AR moves toward the limb, where is the angular distance of the pixel from the central meridian of the image.
-
•
The foreshortening of the AR area with distance from central meridian passage (CMP).
-
•
Underestimation of the flux density.
-
•
Identification of corrupted pixels.
Following the results of \inlineciteberger02, we first correct all the magnetic field measurements by a factor (because they have found ). When MDI is measuring flux densities above approximately 1200 G, the relationship between the data from the two instruments becomes non-linear and the flux recorded by MDI appears to saturate. To evaluate this effect we make a second flux measurement in which the field above 1200 G is multiplied by a factor (rather than , as before). This factor 1.9 is introduced as an upper bound to the MDI underestimation, this comes from the largest difference between ASP and MDI measurements found by \inlineciteberger02 when the MDI data saturates (see their Fig. 2). The change in flux, , after the correction for both linear and non-linear response of MDI is then given by:
| (1) |
So the further non-linear correction of MDI response is relatively small after taking into account the linear correction (e.g. even if half the flux is above G, the non-linear correction is upward bounded by a 15% increase).
| NOAA number | 7978 | 8086 | 8100 | 8179 |
|---|---|---|---|---|
| Central meridian | 7 Jul. 1996 | 18 Sep. 1997 | 2 Nov. 1997 | 15 Mar. 1998 |
| Leading polarity | positive | positive | negative | negative |
| Latitude (degrees) | S10 | N27 | S19 | S22 |
In order to search for any association between eruptive events and changes in the longitudinal field, CMEs from each AR were identified using white light data from the C2 (2-6 solar radii) and C3 (4-30 solar radii) Large Angle and Spectroscopic Coronagraphs (LASCO, \opencitebrueckner95) onboard SOHO. The CME times given in this paper are the times when each CME was first observed in C2 and not the onset time, which is harder to determine. Lower coronal signatures [Thompson et al. (1998)] were used to locate the source region of each CME using data from the Extreme-ultraviolet Imaging Telescope onboard SOHO (EIT, \opencitedelaboudiniere95). Major flares, that is those with GOES class M (10-5 Wm-2) or X (10-4 Wm-2), were identified for each region during their disc passage and correlated with Solar Geophysical data reports on H solar flares. Flare times shown in Figure 4 are the start times of the X-ray flares. Four emerging active regions were studied from 1996 to 1998, they had the NOAA numbers 7978, 8086, 8100 and 8179. Information on these ARs are detailed in Table 1.
4 Active Regions Studied
Each AR was studied during its first disc passage. After proceeding as summarized in Section 3, it was found that corrupted pixels were not a significant problem for any of the ARs. ARs 7978, 8086 and 8100 have no corrupted pixels during the time periods studied. In AR 8179 there is a maximum of 3 corrupted pixels in any one magnetogram, first seen in the positive polarity on 16 March 1998 14:24 UT and until 18 March 1998 16:03 UT. The corrupted pixels account for a loss of approximately 1% of the total flux in the positive polarity.
AR 7978 was born onto the solar disc with positive leading polarity in July 1996, into a region of dominantly negative background field in the southern hemisphere. Flux emergence was first observed on 4 July 1996 (see \opencitedemoulin02, Section 2.2). The long-term evolution and activity of this AR has been well studied by several authors including \inlinecitedryer98, \inlinecitevandriel99, \inlinecitemandrini00 and \inlinecitedemoulin02. The new flux emergence occurred close to the time of CMP and so the evolution is monitored only in the western hemisphere. During this disc transit the AR produced 4 slow CMEs and 3 major flares (GOES class M1.4, X2.6 and M1.0). The X-class flare and second M-class flare are associated to the second and third CMEs respectively, and so these flare times reflect also the CME initiation time.
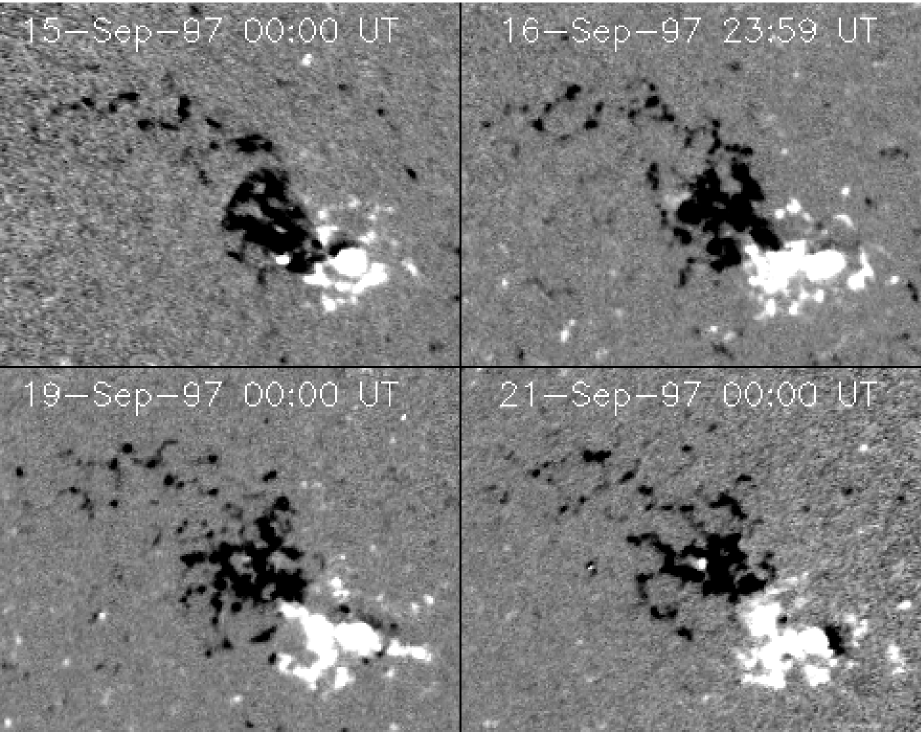
AR 8086 was born in the northern hemisphere with positive leading polarity. The region formed sunspots when it was close to the east limb. The new flux emerged into the magnetic fields of a decaying AR. Sunspot decay and flux dispersal were observed during the disk passage (Figure 1). The AR showed flare activity but produced no M or X-class flares. Transient emission in the low corona and changes in the magnetic topology (as detected with EIT/SOHO) showed that 2 CMEs occurred during the disc passage, observed in LASCO/C2 on 13 September 1997 11:33 UT and 22 September 1997 07:29 UT. The AR was very close to the limb on both occasions and so these events do not occur within the time period in which the AR flux is being measured. AR 8086 allows us to study the flux evolution in a region during a period of no flare or CME activity.
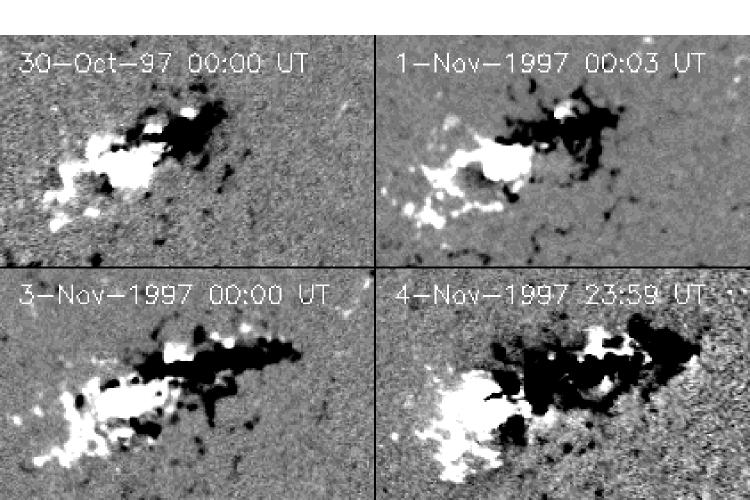
AR 8100 is a southern hemisphere AR with negative leading polarity that first appeared on 28 October 1997. A revival of strong flux emergence was observed beginning on 2 November 1997 (Figure 2). AR 8100 was highly flare and CME productive [Delannée, Delaboudiniére and Lamy (2000), Green et al. (2002b)] producing 5 M-class flares, 2 X-class flares and 15 CMEs between 2 and 9 November 1997. The evolution of the magnetic field in this AR is detailed in \inlinecitegreen02b.
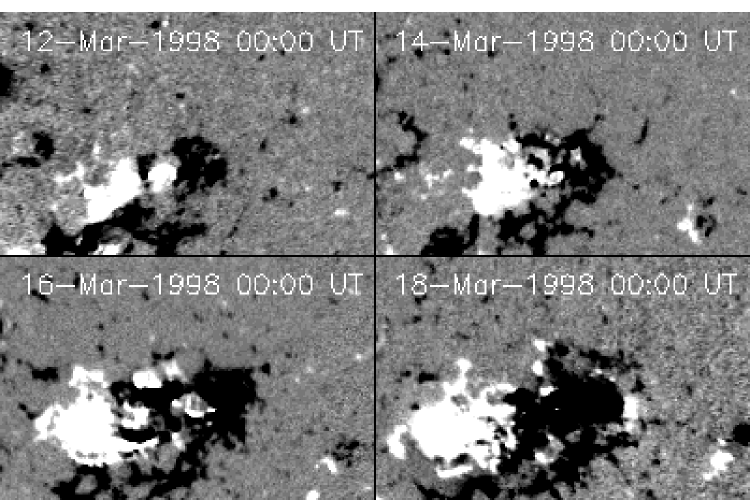
AR 8179 emerged into the southern hemisphere and had a negative leading polarity. Figure 3 shows the formation of the AR in MDI data. New flux emerged late on 13 March 1998 into a pre-existing bipole in a complex of decaying active regions. The negative leading polarity was observed to be more dispersed than the following positive, opposite to the general rule. Two CMEs were produced which were first observed in LASCO/C2 on 15 March 1998 19:31 UT and 18 March 1998 11:35 UT, 4 M-class X-ray flares occurred during the same period, the second of which is associated to the first CME.
5 Magnetic Flux Evolution
Figure 4 shows the flux evolution of the 4 active regions after corrections for area foreshortening, reduction in flux density due to the angle between observer and (assumed radial) magnetic field direction, and MDI underestimation of the field. The time that each region crosses the central meridian is indicated by a thick dashed line. CME times, as first observed in LASCO/C2, and start times of major flares are marked by solid and dash-dotted lines, respectively. The upper plot for each AR shows the evolution of the positive (continuous line) and negative (dashed line) fluxes after the correction by factor 1.45 for flux underestimation. This is applied to all flux density values. The lower plot shows the difference between observed flux in the leading polarity and following polarity as follows. The continuous line gives the polarity imbalance after the factor 1.45 correction for all flux densities. The dotted line, however, shows the polarity imbalance after correction by factor 1.45 for flux densities below 1200 G, and also the additional correction by factor 1.9 for flux densities above 1200G. The lower plots of Figure 4 make more visible the deviations from polarity balance and also the contribution of the two corrections.
The new flux emergence into each region is clearly observed and in all regions the deviation from polarity balance has variations on both the long and short-term, as we describe in more detail below. The long-term imbalance increases with distance from CMP and the polarity which is closest to the limb always appears to have more observed flux than the polarity closer to disc center.
For AR 7978, the observed magnetic flux of both polarities grows monotonically with time (Figure 4). The deviation from polarity balance is first observed approximately one day after central meridian passage when more positive (leading polarity) than negative (following polarity) flux is measured. Later, the deviation from polarity balance has a long-term monotonical increase with time, as the AR rotates toward the western limb, with only a weak modulation superimposed on top. The first CME (seen in LASCO/C2 on 8 July 1996) occurs close to the time when the deviation from polarity balance started to grow ( Mx in 6 hours, at the time of new flux emergence). However, the imbalance stops increasing, and even slightly decreases after the X2.6 flare on 9 July 1996 associated to the second CME (decrease of Mx). This lasts approximately 5 hours before the imbalance starts again on its long-term increase. The two M-class flares (and so the third CME which is associated to the second M flare) appear not to be accompanied by any changes on top of the long-term increase. Conversely, short-term deviations from polarity balance are observed without the occurrence of a major flare (although one may be coincident with a C-class flare), e.g., notice the increase of Mx at the end of 10 July and the decrease of Mx by midday on 11 July, both lasting a few hours.


In AR 8086 there is a clear imbalance in favour of the negative (following) polarity in the eastern hemisphere and in favour of the positive (leading) polarity in the western hemisphere (Figure 4). The polarities have equal magnitudes on 17 September around 18:00 UT, just prior to central meridian passage. The CMEs from this AR occur very close to the limb, and so it is not possible to look for deviations from polarity balance associated to the eruptive events. Except in the early times, the mean flux of the polarities of this AR is steadily decreasing with time. The imbalance shows a long-term trend, with the limbward polarity measuring more flux than the other, with smaller variations on top ( Mx).
Fluxes in AR 8100 are imbalanced in a way that the positive (following) polarity dominates when the AR is in the eastern hemisphere, but the imbalance reduces as the AR approaches CMP (Figure 4). Just after CMP the polarities have the same flux and remain this way during 1 day when, coincident with new flux emergence, the negative (leading) polarity begins to dominate. This imbalance increases as the AR flux increases and as the AR moves toward the western limb. AR 8100 is the source of 15 CMEs and 7 major flares between 2 and 9 November 1997 (see Table 1 of \opencitegreen02b). For 2 of the CMEs it was not possible to determine with confidence the time of first observation in LASCO/C2 (so they are not represented in Figure 4); they are observed after CME 1 and 2 respectively. The first CME (on 2 November) occurs around the start of the revival of flux emergence. CME number 2, which occurs on 3 November, is observed to occur before the time when the deviation from polarity balance in the AR starts to grow, while CME 3 is just in the growing phase of the imbalance. The imbalance grows by Mx in 12 hours with only one CME associated flare (CME 3) and two more flares at the beginning and end phase! The first M-class flare on 4 November appears to be accompanied by a decrease in the imbalance (the positive flux increases by Mx in 6 hours). The X-flare (4 November 1997 05:52 UT), which is associated to CME 4, is followed by a decrease of the imbalance ( Mx in 6 hours). For CMEs 5 and 6 there are no related changes in the imbalance and it continues to grow monotonically. CME 7 is too close to the end of the plot to look for changes.
Flux measured in AR 8179 is balanced until the time of the new flux emergence in the eastern hemisphere at which time the positive (following) polarity becomes dominant (Figure 4). The flux becomes balanced just before central meridian passage, and then in the western hemisphere, the negative (leading) polarity becomes dominant. The first CME and associated M-class flare are seen to occur with an increase in the deviation from polarity balance (this happens close to the CMP and lasts less than 3 hours). The second CME (on 18 March) shows no significant change of flux evolution on top of the long-term trend. Still, earlier, significant changes are present without any flare or CME association (e.g. the two imbalanced flux increases by Mx in 6 hours on 16 and 17 March).
6 Origin of the deviation from polarity balance
6.1 MDI non-linear response
An a priori possible origin of the above described deviation from polarity balance is the non-linear response of MDI. For example, if magnetic flux evolves from sunspot-like to plage-like, a false field increase can be detected by MDI. In the study of \inlineciteberger02, this became important for flux densities above 1200G as MDI underestimates the field in a non-linear way (Section 2). For the ARs chosen in this work, we suppose that the linear response breaks down as in the AR studied by \inlineciteberger02 (see Section 3). In ARs 7978, 8100 and 8179 flux densities above 1200G are observed in each polarity. In AR 8086 flux densities above 1200G are only seen in the positive polarity. The difference in flux between the leading and following polarity, after correction for flux densities larger than 1200G are shown in the lower plots of Figure 4 by the dotted line. This correction has the effect of increasing the long-term imbalance in AR 7978, but decreases the long-term imbalance in ARs 8100 and 8179, while it has a negligible effect in AR 8086. As expected from Eq. (1), Figure 4 shows that correcting for the non-linear underestimation has a minor effect (even when we have done an upper bound correction). We conclude that the non-linear response of MDI is not the source of both the long-term and short-term lack of balance between opposite polarities.
6.2 Flare and/or CME origin
Studying the flux evolution during the entire disc passage of an AR, allows any relation between changes in flux and times of flares and CMEs to be investigated systematically. On the short-term ( hours), some flares and CMEs show a deviation from polarity balance around the flare/CME time, for example the 9 July 1996 09:05 UT X2.6 flare. These changes are typically of the order of Mx. In our data set, 4 flares (and their 4 associated CMEs) show such related short-term imbalance but the same numbers of events show no significant changes (while others, 4 flares and 2 CMEs, were occurring too close to CMP to expect any significant change). We conclude that the association between the polarity imbalance and the occurrence of major flares and CMEs is not systematic. In the cases where we do have a deviation from polarity balance, this effect has a typical duration hours.
Complementary work carried out by \inlinecitewang02 led to the proposal that deviations from polarity balance associated to flares are permanent, although at most their observations cover the time period of 4 hours after flaring. They look at 6 ARs with a cadence of one minute (compared to our 96 minute cadence). In the fully comparable cases, short-term effects were seen corresponding to a change lasting 1 hour in AR 9591, and only 30 minutes in AR 9672. The flare related changes are very small, of the order of - Mx. Changes of Mx are hard to distinguish from noise in this study, where the total AR flux is at least one order of magnitude larger than that measured by \inlinecitewang02. The total flux measured by these authors is much smaller than in our study because, except in one case (AR 9672), they defined a sub-region which covers only a small part of the studied AR. Having such a defined sub-region located exactly on the same portion of the AR during the time period studied, is certainly an important challenge! The results are also very dependent on the location of the sub-region in the studied AR, as found by \inlinecitelara00. We fully confirm the difficulties of such an attempt and, finally, we rely only on the flux evolution of the full AR (even in this case the AR is never fully isolated because it is surrounded by network field, and this is indeed the main source of noise in the deduced magnetic flux, see Section 3).
The cadence in our case is 96 minutes, restricting our determination of short-term changes, but allowing us to study the permanent and long-term polarity imbalance more precisely. However, no permanent imbalance is observed to be related to flares as proposed by \inlinecitewang02. We do see imbalance associated to some flares, but our systematic study shows that imbalances of similar magnitude can also occur outside flare and CME times. We conclude that flares and CMEs are not closely related to the observed changes in magnetic polarity balance.
6.3 Global connectivities
The results presented in Figure 4 show that the polarity imbalance increases with the distance from the CMP. For the four ARs, the imbalance is minimum near the CMP. It shows that the main source of the imbalance is not due to global connectivities which link part of the AR flux to outside distant flux (as proposed by \opencitechoudhary02).
6.4 Flux emergence
The nature of the imbalance corresponds to what is expected from the presence of an east-west horizontal field component which links the two AR polarities as follows. Such a horizontal component gives a stronger contribution to the line-of-sight flux as the AR moves away from the central meridian (where it nearly vanishes), just because of a geometrical effect. This increase of imbalance with the distance from the CMP is clearly present in Figure 4. Moreover, the long-term evolution of the polarity imbalance is associated with an increase of flux in both polarities, so with new emerging flux (Figure 4). The east-west horizontal component of this new flux introduces a longitudinal component in the observed field component (there is also a much smaller contribution from the north-south component, see the end of Section 6.6). With a static magnetic configuration, the polarity imbalance created by the east-west component would have a sinus dependence on the distance from the CMP. In an evolving magnetic configuration, only the reversal at CMP, and an average increase with the distance from CMP remain as shown in Figure 4 and described in Section 5.
It has been suggested previously that CMEs occur during the maximum phase of new flux emergence (e.g. \opencitelara00). We observe CMEs during all stages of flux emergence, i.e. from first emergence to days after but we do also observe important flux emergence without CMEs. In fact, it is likely that CME occurrence depends on the stability of the overlaying coronal field and its interaction with the emerging flux. Indeed, from a wide range of models, new emerging flux (and/or cancellation of flux and/or increasing magnetic stress) is not expected to systematically produce a flare or a CME (e.g. \openciteisenberg93, \openciteamari96, \openciteantiochos99, \opencitelin01). So finally, it is physically grounded that we find the deviations from polarity balance related to flux emergence, without any systematic link to flare or CME.
6.5 Implication of the radial field hypothesis
It is also worth remembering that our above results are obtained after correcting the magnetic flux using a radial field hypothesis (see Section 3). If we do not make the corrections implied by this assumption, the observed flux of the polarity which is closer to the limb is systematically lower (the opposite of what is shown in Figure 4 !). Indeed, for an AR with a nearly constant magnetic flux (e.g. AR 8086) and without the radial correction, we find that the longitudinal magnetic flux of both polarities has an approximate cosine dependence with the distance from CMP; the leader polarity flux peaks earlier than the following polarity flux (with a time difference proportional to the east-west AR size). Multiplying each pixel of the magnetogram by a factor (Section 3) corrects most of this projection effect (because the magnetic field is dominantly vertical at the photosphere in the spots or in the network).
Still, we attribute above, most of the remaining deviation from polarity balance to the east-west horizontal component! The correction by a factor certainly does not apply to such component, but we are unable to separate the contributions of the vertical and horizontal components to the longitudinal field. Therefore, we choose to do the projection correction on the component which has the strongest flux. This implies that the polarity imbalance coming from the horizontal component are over-estimated (with a factor increasing with the distance from CMP). For an AR at a latitude around degrees, and 3 days before or after CMP, this over estimation is lower than a factor 1.5. It is also worth noticing that this correction has only a long-term effect (linked to the solar rotation), and so it cannot be linked to the short term ( hours) deviations from polarity balance.
6.6 Other possible contributions
Aside from an horizontal contribution due to emerging flux, horizontal fields are also known to exist in the penumbra of sunspots. If sunspots are axisymmetric this would not produce a deviation from polarity balance (because of the averaging in the total flux). However, sunspots are usually not symmetric. Moreover, \inlinecitehoward91 deduced from the east-west flux difference that leading and following photospheric magnetic fields are inclined toward each other by about 16 degrees. Howard found this result for both growing and decaying regions. Then we expect a deviation from polarity balance in decaying ARs with the same longitudinal dependence (but with a weaker magnitude) as for growing ARs. AR 8086 is one such example.
Exact measurements of the flux in each polarity, with only an east-west contribution from the horizontal field, would result in fluxes having equal magnitude at the time when the AR crosses the central meridian. Figure 4 indicates that at CMP, most notably for AR 8086 and 8100, the fluxes of opposite polarity are not equal. This may result from the inclusion of some of the background field or pre-existing bipolar fields in the flux summations; in particular, even if we isolate the AR the best we could, network field present in the AR area cannot be removed from the flux computation.
Another possible contribution comes from a north-south oriented horizontal field component in the AR. Both ARs 8086 and 8100 show a much higher inclination toward the equator than ARs 7978 and 8179, which are more aligned in the east-west direction. However, the north-south field component contributes with the correct sign only in AR 8100 (to explain qualitatively a slight positive dominance at CMP), while for AR 8086 only a dominant positive background flux or large scale connections are able to explain the slight positive dominance at CMP. Nevertheless, the dominant effect for the polarity imbalance is the distance in longitude of the AR from CMP, so the contribution of the east-west horizontal field.
7 Conclusion
This study seeks to answer whether short-term, or permanent changes in the longitudinal photospheric magnetic field can be associated to major flares and CMEs by studying ARs during their disc passage. Since MDI, like any magnetograph, has limitations, certain corrections must be made to the data before they can be used. As discussed in Section 2, in pixels recording a very low continuum intensity we can have corrupted values of the flux density. In pixels which are not corrupted, MDI will underestimate the flux density either in a linear or non-linear way [Berger and Lites (2003)]. MDI data in this study have been corrected for these effects. In the ARs studied, corrupted pixels were not a significant problem. They were observed in one of the emerging ARs and produced at most a loss of 1% of the flux in the corresponding sunspot. Corrections have been applied to the data to take into account the geometrical effects of area foreshortening and the inclination of the field away from the line of sight, and also for the underestimation of the field when the response of MDI is linear and non-linear. However, we find that this non-linear underestimation is not the source of the deviation from polarity balance in the ARs.
Even after these corrections, the magnetic flux in both polarities is observed to have a long-term imbalance (with a disk-passage time scale). This lack of polarity balance increases with distance from disk centre, the stronger flux being associated to the polarity which is farther from disk centre. At central meridian passage the fluxes become approximately equal. The nature of the imbalance is that expected from the presence of a horizontal field component linking both polarities of the AR. The ARs studied were young, in the early stages of formation, so that the presence of such horizontal field component is expected (in particular because the emergence of new flux implies that the apex of the flux tube crosses the photosphere).
Furthermore, superposed on the longitude dependent long-term polarity imbalance, we have found several enhancements or decreases of the imbalance on the short-term (with a typical time scale of 6 hours). Some occur around the time of a major flare and/or a CME associated to the same AR, but without a systematic timing between the deviation from polarity balance and the flare and/or CME first detection. Moreover, our systematic study shows as many deviations from polarity balance which were not related to any flare (X or M class) or CME. So, we conclude that these short-term imbalances are not linked to a flare or a CME, but rather linked only to the emergence of new fluxes (which does not always trigger a large coronal activity as expected in a wide range of models).
Acknowledgements.
We thank the referee for careful reading and constructive comments on the paper. L.M.G. is grateful to PPARC for postdoctoral funding. P.D. and C.H.M. acknowledge financial support from ECOS (France) and SECyT (Argentina) through their cooperative science program (A01U04). L.v.D.G. was supported by the Research Fellowship F/02/035 of the K.U. Leuven and by the Hungarian Government grants OTKA T-038013, T-032846. L.M.G., P.D. and L.v.D.G. are grateful to the Royal Society for a Joint Project award. We acknowledge the SURF for providing data for use in this publication. The authors thank the MDI, EIT and LASCO teams for their data. SOHO is a project of international cooperation between ESA and NASA.References
- Amari et al. (1996) Amari, T., Luciani, J. F., Aly, J. J., & Tagger, M.: 1996, Astron. Astrophys., 306, 913.
- (2) Ambastha, A., Hagyard, M. J., & West, E. A.: 1993, Solar Phys., 148, 277.
- (3) Antiochos, S. K., Devore, C. R., & Klimchuk, J. A.: 1999, Astrophys. J., 510, 485.
- Aulanier and Démoulin (1998) Aulanier, G. & Démoulin, P.: 1998, Astron. Astrophys., 329, 1125.
- Berger and Lites (2003) Berger, T., Lites, B. W.: 2003, Solar Phys., submitted.
- Bommier et al. (1994) Bommier, V., Landi Degl’Innocenti, E., Leroy J.-L. & Sahal-Bréchot, S.: 1994, Solar Phys., 154, 231.
- Bumba and Howard (1965) Bumba, V., Howard R.: 1965, Astrophys. J., 141, 1492.
- Brueckner et al. (1995) Brueckner, G. E., Howard, R. A., Koomen, M. J., et al.: 1995, Solar Phys., 162, 357.
- Chen et al. (1994) Chen, J., Wang, H., Zirin, H., Ai, G.: 1994, Solar Phys., 154, 261.
- (10) Choudhary, D. P., Venkatakrishnan, P., & Gosain, S.: 2002, Astrophys. J., 573, 851.
- Delaboudinière et al. (1995) Delaboudinière, J.-P., Artzner, G. E., Brunaud, J., et al.: 1995, Solar Phys., 162, 291.
- Delannée, Delaboudiniére and Lamy (2000) Delannée, C., Delaboudiniére, J.-P., Lamy, P.: 2000, Astron. Astrophys., 355, 725.
- Démoulin et al. (2002) Démoulin, P., Mandrini, C. H., van Driel-Gesztelyi, L., et al.: 2002, Astron. Astrophys., 382, 650.
- Dryer et al. (1998) Dryer, M., Andrews, M. D., Aurass, H., et al.: 1998, Solar Phys., 181, 159.
- Feynman and Martin (1995) Feynman, J. and Martin, S. F.: 1995, J. Geophys. Res., 100, 3355.
- Gaizauskas et al. (1998) Gaizauskas, V., Mandrini, C. H., Démoulin, P., Luoni, M. L., Rovira, M. G.: 1998, Astron. Astrophys., 332, 353.
- Gary and Démoulin (1995) Gary, G. A. & Démoulin, P.: 1995, Astrophys. J., 445, 982
- Giggerich et al. (1971) Giggerich, O., Noyes, R. W., Kalkofen, W., Cuny, Y.: 1971, Solar Phys., 18, 347.
- Green et al. (2002a) Green, L. M., Matthews, S. A., van Driel-Gesztelyi, L., Harra, L. K., Culhane, L. J.: 2002a, Solar Phys., 205, 325.
- Green et al. (2002b) Green, L. M., López Fuentes, M. C., Mandrini, C. H., Démoulin, P., van Driel-Gesztelyi, L., Culhane, J. L.: 2002b, Solar Phys., 208, 43.
- Hagyard et al. (1984) Hagyard, M. J., Smith, J. B. Jr., Teuber, D., West, E. A.: 1984, Solar Phys., 91, 115.
- (22) Hagyard, M. J., Stark, B. A., & Venkatakrishnan, P.: 1999, Solar Phys., 184, 133.
- Harvey and Harvey (1976) Harvey, K. L., Harvey, J. W.: 1976, Solar Phys., 47, 233.
- Howard (1991) Howard, R. F.: 1991, Solar Phys., 134, 233.
- (25) Isenberg, P. A., Forbes, T. G., & Démoulin, P.: 1993, Astrophys. J., 417, 368.
- Klimchuk, Canfield & Rhoads (1992) Klimchuk, J. A., Canfield, R. C., and Rhoads, J. E.: 1992, Astrophys. J., 385, 327.
- Lara, Gopalswamy and DeForest (2000) Lara, A., Gopalswamy, N., DeForest, C.: 2000, J. Geophys. Res., 27, 1435.
- Li et al. (2000a) Li, H., Sakurai, T., Ichimoto, K., Ueno, S.: 2000a, Publ. Astron. Soc. Japan, 52, 465.
- Li et al. (2000b) Li, H., Sakurai, T., Ichimoto, K., Ueno, S.: 2000b, Publ. Astron. Soc. Japan, 52, 483.
- (30) Lin, J., Forbes, T. G., & Isenberg, P. A.: 2001, J. Geophys. Res., 106, 25053
- Lin, Penn, & Tomczyk (2000) Lin, H., Penn, M. J., & Tomczyk, S.: 2000, Astrophys. J., 541, L83
- Liu and Norton (2001) Liu, Y., Norton, A.: 2001, MDI measurement errors: The magnetic perspective, MDI Technical Note, TN-01-144, http://soi.stanford.edu/general/tech_notes.html.
- Mandrini et al. (2000) Mandrini, C.H., van Driel-Gesztelyi, L., Thompson, B. J., et al.: 2000, Geof. Inter., 39, 73.
- Martres et al. (1968) Martres, M.-J., Michard, R., Soru-Iscovici, I., & Tsap, T. T.: 1968, Solar Phys., 5, 187.
- Pevtsov (2000) Pevtsov, A. A.: 2000, Astrophys. J., 531, 553.
- Plunkett et al. (1997) Plunkett, S., Brueckner, G. E., Dere, K. P., et al.: 1997, Solar Phys., 175, 699.
- Pope and Mosher (1975) Pope, T. & Mosher, J.: 1975, Solar Phys., 44, 3.
- Sakurai et al. (1992) Sakurai, T., Shibata, K., Ichimoto, K., Tsuneta, S., & Acton, L. W.: 1992, Publ. Astron. Soc. Japan, 44, L123.
- Scherrer et al. (1995) Scherrer, P. H., Bogart, R. S., Bush, R. I., et al.: 1995, Solar Phys., 162, 129.
- Tang et al. (1999) Tang, Y. H., Mouradian, Z., Schmieder, B., Fang, C., Sakurai, T.: 1999, Solar Phys., 185, 143.
- Thompson et al. (1998) Thompson, B.J., Plunkett, S.P., Gurman, J.B., et al.: 1998, Geophys. Res. Lett., 25, 14, 2461.
- van Driel-Gesztelyi et al. (1999) van Driel-Gesztelyi, L., Mandrini, C. H., Thompson B., et al.: 1999, in B. Schmieder, A. Hofmann, J. Staude. (eds.), Third Advances in Solar Physics Euroconference: Magnetic Fields and Oscillations, ASP Conference Series, 184, 302.
- Wang et al. (1994) Wang, H., Ewell, M. W. Jr., Zirin, H., Ai, G.: 1994, Astrophys. J., 424, 436.
- Wang et al. (2002) Wang, H., Spirock, T. J., Jiong, Q., et al.: 2002, Astrophys. J., 576, 497.
- Wang and Sheeley (1999) Wang, Y.-M., Sheeley, N. R. Jr.: 1999, Astrophys. J., 510, 157.