The Fe XXII I(11.92 Å)/I(11.77 Å) Density Diagnostic Applied to the Chandra High Energy Transmission Grating Spectrum of EX Hydrae
Abstract
Using the Livermore X-ray Spectral Synthesizer, which calculates spectral models of highly charged ions based primarily on HULLAC atomic data, we investigate the temperature, density, and photoexcitation dependence of the line ratio of Fe XXII. We find that this line ratio has a critical density , is approximately 0.3 at low densities and 1.5 at high densities, and is very insensitive to temperature and photoexcitation, so is a useful density diagnostic for sources like magnetic cataclysmic variables in which the plasma densities are high and the efficacy of the He-like ion density diagnostic is compromised by the presence of a bright ultraviolet continuum. Applying this diagnostic to the Chandra High Energy Transmission Grating spectrum of the intermediate polar EX Hya, we find that the electron density of its MK plasma is , orders of magnitude greater than that typically observed in the Sun or other late-type stars.
1 Introduction
Magnetic cataclysmic variables (mCVs; polars and intermediate polars) are bright X-ray sources because the highly supersonic [free-fall velocity ] material raining down on the white dwarf primary passes through a strong shock where most of its kinetic energy is converted into thermal energy and the plasma is heated to a temperature MK. Because of the magnetic funneling of the mass lost by the secondary, the factor-of-four density jump across the accretion shock, and the settling nature of the post-shock flow (wherein the pressure is roughly constant and the density scales inversely with the temperature; Frank, King, & Raine 1992), the hot plasma in mCVs is expected to be dense. For a mass-accretion rate () and a relative spot size , the density of the flow immediately behind the shock is .
The standard density diagnostic of high-temperature plasmas is the intensity ratio of the forbidden to intercombination lines of He-like ions (Gabriel & Jordan, 1969; Blumenthal, Drake, & Tucker, 1972; Porquet et al., 2001), but this diagnostic is compromised in mCVs for two reasons. First, the critical density of this ratio increases with and hence temperature—the opposite of the trend in the accretion column—so the line ratio is effective over only a very narrow slice of the accretion column. Second, in mCVs and other ultraviolet-bright stars, photoexcitation competes with collisional excitation to depopulate the upper level of the forbidden line, so the line ratio can appear to be in the “high-density limit” if the radiation field is sufficiently strong at the appropriate wavelengths: for a plasma illuminated by a 30 kK blackbody, the line ratios of all elements through Mg lie in the high-density limit, regardless of the density (Mauche, 2002).
To circumvent the density/photoexcitation ambiguity of the line ratio of He-like ions, we undertook an investigation of potential density diagnostics of lines of Fe L-shell ions that are observable in the high quality Chandra High Energy Transmission Grating (HETG) spectrum of the intermediate polar EX Hya (Mauche, 2000, 2002). Toward this end, Mauche, Liedahl, & Fournier (2001) investigated the density, temperature, and photoexcitation dependence of the line ratio of Fe XVII, and found that the anomalous ratio observed in EX Hya can be explained if the electron density of its MK plasma is or if the photoexcitation temperature kK. In this Letter, we investigate the density, temperature, and photoexcitation dependence of the line ratio of Fe XXII, which also is anomalous in EX Hya. We find that this line ratio is very insensitive to temperature and photoexcitation and that the observed ratio can be explained if the electron density of EX Hya’s MK plasma is .
2 Model Spectra
The density sensitivity of the X-ray lines of Fe XXII have been discussed previously by Doschek, Meekins, & Cowan (1973), Mason & Storey (1980), Doschek, Feldman, & Cowan (1981), Phillips et al. (1982), Fawcett et al. (1987), Phillips et al. (1996), and Wargelin et al. (1998) in studies of the X-ray spectra of solar and laboratory high-temperature plasmas. These diagnostics have not received more attention because of the relative weakness of Fe XXII emission lines (the Fe XXII ionization fraction peaks at just 22% and is greater than 1% over the relatively narrow temperature range –26 MK; Mazzotta et al. 1998), the relative weakness of lines for , and the fact that the critical densities of these transitions are of order , larger than the densities typically observed in the Sun, tokamaks, and electron beam ion traps. We became interested in the density sensitivity of the lines of Fe XXII because the critical density of this transition is comparable to the lower limit of the electron density derived from the Fe XVII line ratio in the Chandra HETG spectrum of EX Hya, and because the Fe XXII line ratio is anomalous (the 11.92 Å line is unusually strong) in the Chandra HETG spectrum of EX Hya compared to that of the bright late-type binaries HR 1099, Capella, and CrB (Ayres et al. 2001, Phillips et al. 2001, and Osten et al. 2003, respectively).
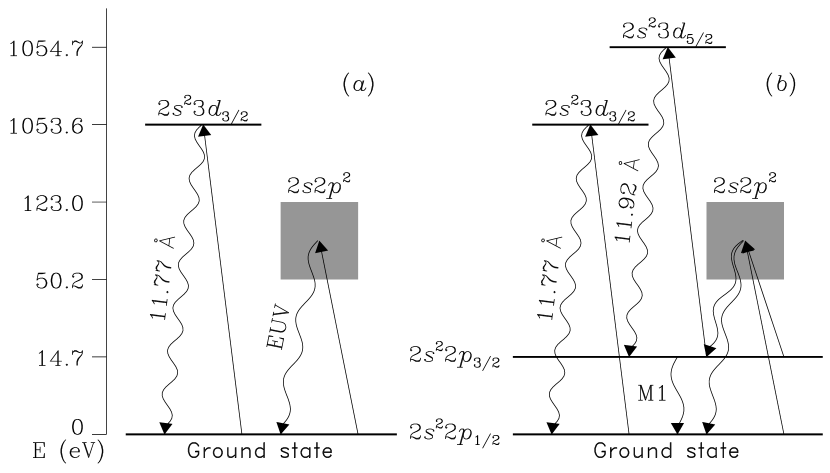
Before wading into the details, we refer the reader to Figure 1, which illustrates the origin of the density dependence of the Fe XXII spectrum. At low densities (), the Fe XXII electron population is primarily in the ground state, and collisional excitations are predominantly from the ground state into the manifold (8 levels total) and the level, both of which decay primarily to ground, producing lines in the extreme ultraviolet (EUV) (–217 Å) and at 11.77 Å, respectively. However, these levels also decay to the first-excited level with approximately 15% probability, producing lines in the EUV (–349 Å) and at 11.93 Å; when that level decays to ground, it produces a line in the ultraviolet (UV) ( Å). As the density increases (), electron population builds up in the first-excited level because the M1 transition to ground is slow (). At high densities, the first-excited level is fed primarily by radiative decays from the manifold. Collisional excitations out of the first-excited level are primarily into the level, which decays primarily back to the first-excited level, producing a line at 11.92 Å. Consequently, the Fe XXII 11.92 Å line is relatively strong in the X-ray spectra of high-density plasmas.
To calculate quantitative models of the X-ray spectrum of Fe XXII, we employed the Livermore X-ray Spectral Synthesizer (LXSS), a suite of IDL codes that calculates spectral models of highly charged ions based on Hebrew University/Lawrence Livermore Atomic Code (HULLAC) atomic data. HULLAC calculates atomic wavefunctions, level energies, radiative transition rates , and oscillator strengths according to the fully relativistic, multiconfiguration, parametric potential method (Klapisch, 1971; Klapisch et al., 1977). Electron impact excitation rate coefficients are computed quasi-relativistically in the distorted wave approximation (Bar-Shalom, Klapisch, & Oreg, 1988) assuming a Maxwellian velocity distribution. Our Fe XXII model includes electron impact excitation rate coefficients and radiative transition rates for E1, E2, M1, and M2 decays for levels with principal quantum number and azimuthal quantum number for a total of 228 levels. Using these data, LXSS calculates the level populations for a given temperature and density assuming collisional-radiative equilibrium; the line intensities are then simply the product of the level populations and the radiative decay rates.
In a preliminary report, we (Mauche, Liedahl, & Fournier, 2003) used LXSS to calculate the X-ray spectrum of Fe XXII for electron densities to and electron temperatures , 12.8, and 25.5 MK (, 1, and 2 times the temperature at which the Fe XXII ionization fraction peaks; Mazzotta et al. 1998). At the resolution of the Chandra HETG, the – line at 11.77 Å is blended with the (very much weaker) – line at 11.76 Å, and the – line at 11.92 Å is blended with the (much weaker) – line at 11.93 Å, so we report as the ratio of the sum of these blends. Figure 3 of Mauche, Liedahl, & Fournier (2003) shows that this line ratio has a critical density , is approximately 0.3 at low densities and 1.4 at high densities, and has only a weak temperature dependence.
2.1 Modifications to LXSS: Collisional Excitation
Motivated by the detailed study of Fournier et al. (2001) of the density-sensitive Fe lines in the EUV spectrum of the high-density Frascati Tokamak Upgrade plasma, for this Letter we investigated the effect on the Fe XXII line ratio of two modifications to the collisional excitation data used in LXSS. First, we investigated the effect of replacing, for all transitions between and among the and levels of Fe XXII, the electron impact excitation rate coefficients computed with HULLAC with those of Zhang & Pradhan (1997), computed with the relativistic R-matrix method. At MK, the Zhang & Pradhan electron impact excitation rate coefficients are larger than those of HULLAC by 1.95 for the – transition, 0.92–1.70 (average 1.27) for the eight – transitions, 1.05–3.23 (average 1.55) for the eight – transitions, and 0.45–8.99 (average 2.20) for transitions between levels within the manifold (but only 1.00–1.02 for the four – transitions). Despite the significant differences between these excitation rate coefficients, we find that for MK the Fe XXII line ratio increases by 7% at , but the low- and high-density limits are unaffected. Second, we investigated the effect of adding proton excitations for transitions among the levels of the and configurations. This was accomplished by fitting the proton impact excitation rate coefficients of Foster, Keenan, & Reid (1997) to an expression of the form , where is the proton impact excitation rate coefficient in units of , and we have assumed that the proton and electron temperatures are equal. Adding proton excitations to the LXSS population kinetics calculation under the assumption that the proton number density (as is appropriate for a high-temperature plasma with solar abundances), we find that for MK the Fe XXII line ratio increases by 19% at , and the high-density limit increases by 7% to approximately 1.5.
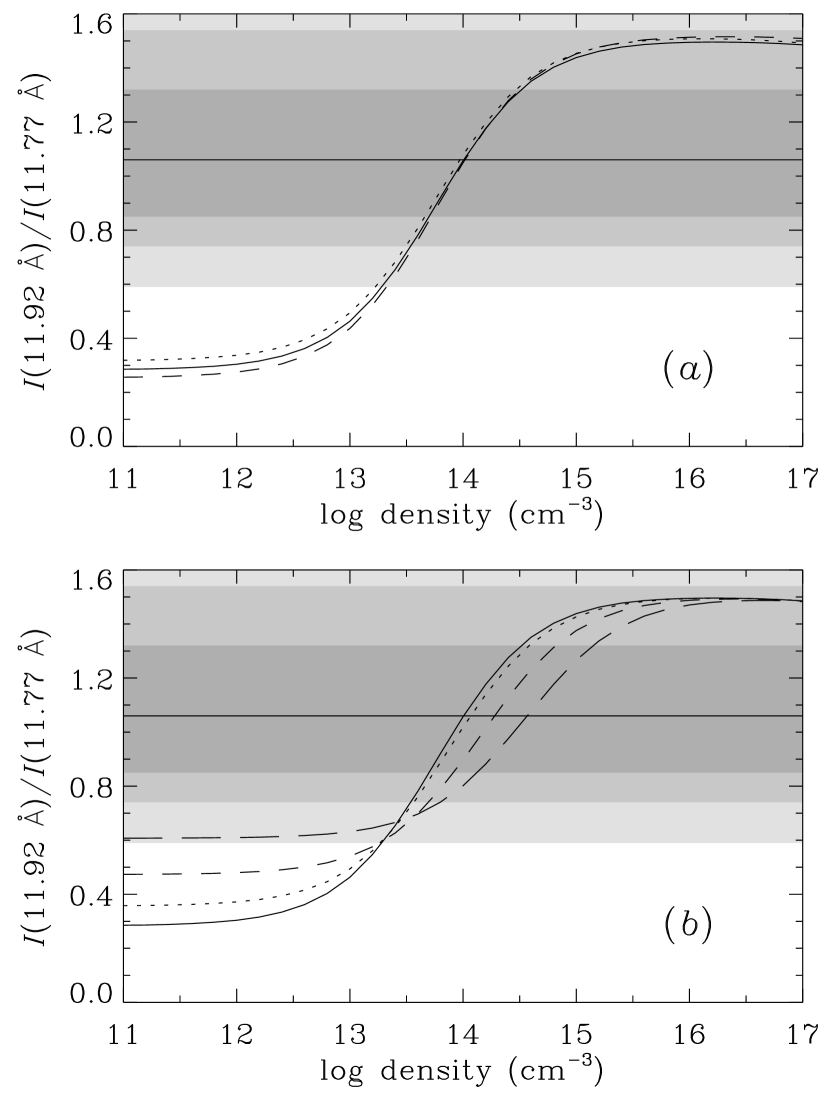
With both of these modifications to LXSS, we recalculated the X-ray spectrum of Fe XXII for electron densities to and electron temperatures , 12.8, and 25.5 MK. The upper panel of Figure 2 shows that the model Fe XXII line ratio has a critical density , is approximately 0.3 at low densities and 1.5 at high densities, and has only a very weak temperature dependence.
2.2 Modifications to LXSS: Photoexcitation
To investigate the effects of photoexcitation on the Fe XXII line ratio, we added to the LXSS population kinetics calculation the photoexcitation rates , where is the spectrum of the photoexcitation radiation field. For simplicity, we assume that (i.e., the radiation field is that of a blackbody of temperature ) and the dilution factor of the radiation field is equal to (i.e., the X-ray emitting plasma is in close proximity to the source of the photoexcitation continuum). With these assumptions, we used LXSS to calculate the X-ray spectrum of Fe XXII for an electron temperature MK, electron densities to , and photoexcitation temperatures , 40, 60, 80, and 100 kK. The lower panel of Figure 2 shows that below kK the Fe XXII line ratio has essentially no photoexcitation dependence, but as the photoexcitation temperature increases the line ratio increases at low electron densities and the critical density shifts to higher densities, while the high-density limit is unaffected. Compared to the Fe XVII line ratio, the Fe XXII line ratio is insensitive to photoexcitation because the – transition in the UV is not optically allowed () and the – transitions lie at such short wavelengths in the EUV.
3 Observations
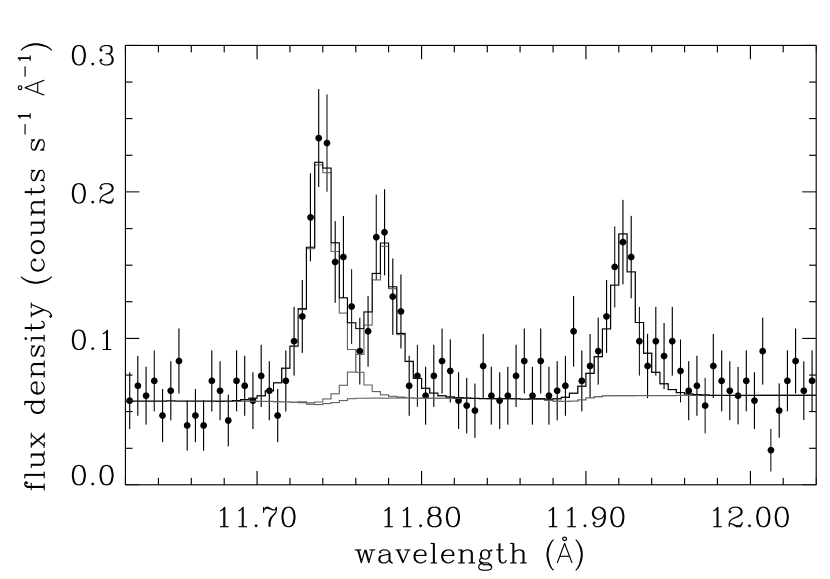
The Chandra HETG/ACIS-S observation of EX Hya was performed between 2000 May 18 and May 19 UT for a total exposure of 59 ks. Extraction of the grating spectra and calculation of the effective area files was accomplished with the CIAO 2.1 suite of software using the reprocessed data products and new calibration data files (version R4CU5UPD8) for sequence 300041. Various aspects of this spectrum have been discussed by Mauche (2000, 2002) and Mauche, Liedahl, & Fournier (2001); here we discuss only a tiny portion (–12.05 Å) of the medium-energy grating (MEG) spectrum as it bears on the relative strengths of the Fe XXII emission lines. This spectrum is shown in Figure 3, where the ordinate is in units of , the wavelength bin width Å, and we have combined first order counts. This portion of the spectrum contains the 11.77 and 11.92 Å emission lines of Fe XXII as well as the 11.74 Å emission line of Fe XXIII.
To determine the flux in these emission lines, we fit the MEG spectrum over the –12.05 Å wavelength interval with a model consisting of a linear background (to account for the thermal bremsstrahlung continuum obvious in the broadband spectrum) and three Gaussians. Assuming a common Gaussian width, the fitting function . To perform the fit, we separately accounted for first orders and used Å bins, so there were 180 data points and 171 degrees of freedom (dof). The resulting fit, combining first orders, is shown by the thick histogram in Figure 3. It gives and fit parameters as follows: Gaussian width mÅ and line wavelengths and fluxes , , and , where the errors on the wavelengths are 1–2 mÅ and all errors are (68% confidence) for one interesting degree of freedom. Formally (e.g., Bevington 1960), the line ratio equals (68% confidence), but this propagation of errors ignores a subtle interplay between the error bars of the numerator and denominator of this ratio. To generate more rigorous values for the error bars of this ratio, we used a Monte Carlo technique with realizations to determine that the observed line ratio equals 1.06 and the errors are (68% confidence), (90% confidence), and (99% confidence). This best-fit line ratio and these error envelopes are shown superposed on both panels of Figure 2.
4 Analysis
Figure 2 shows that the combination of our LXSS models and Chandra HETG spectrum places significant constraints on the density of the MK plasma in EX Hya. Specifically, allowing for a factor-of-two uncertainty in the electron temperature, the upper panel of Figure 2 shows that the electron density at 68% confidence, at 90% confidence, and at 99% confidence. Conversely, the lower panel of Figure 2 shows that the electron density can be arbitrarily low if the photoexcitation temperature kK, but that alternative is excluded by UV observations of EX Hya. First, assuming that the distance to EX Hya is 100 pc, that the radius of its white dwarf is cm, that its 1010 Å flux density equals (Mauche, 1999), and that 100% of this emission is due to a 100 kK hotspot (i.e., assuming that the white dwarf, accretion disk, and accretion curtains do not radiate in the UV), the fractional emitting area of the spot is approximately 0.5%, far smaller than is inferred from optical and UV light curves of mCVs. Second, fits to EX Hya’s UV spectrum yield effective temperatures kK (Greeley et al., 1997; Eisenbart et al., 2002), far lower than that required to produce the anomalous Fe XXII line ratio via photoexcitation.
5 Discussion
To date, four different spectroscopic diagnostics have provided evidence of high densities in the X-ray–emitting plasma of the intermediate polar EX Hya. Hurwitz et al. (1997) used the line ratio of the Fe XX/Fe XXIII 133 Å blend to the Fe XXI 129 Å line observed in the 1994 Extreme Ultraviolet Explorer spectrum of EX Hya to infer under the assumption that the plasma temperature MK. Using the Chandra HETG spectrum of EX Hya, Mauche (2002) showed that the He-like ion line ratios of O, Ne, Mg, Si, and S are all in their high-density limit; Mauche, Liedahl, & Fournier (2001) used the Fe XVII line ratio to infer for its MK plasma; and we here used the Fe XXII line ratio to infer for its MK plasma. Of these diagnostics, the Fe XXII line ratio is the most reliable because it has the highest critical density and is the least sensitive to temperature and photoexcitation. We conclude first that the Chandra HETG spectrum of EX Hya requires plasma densities that are orders of magnitude greater than those typically observed in the Sun or other late-type stars, and second that the Fe XXII line ratio [like the Fe XVII line ratio] is a useful density diagnostic for sources like mCVs in which the plasma densities are high and the efficacy of the He-like ion density diagnostic is compromised by the presence of a bright UV continuum. Finally, we note that our density determinations for EX Hya are consistent with those expected for plasma in the accretion column, where . Additional density diagnostics are needed to begin to map the temperature/density profile of the accretion column of this and other mCVs.
References
- Ayres et al. (2001) Ayres, T. R., et al. 2001, ApJ, 549, 554
- Bar-Shalom, Klapisch, & Oreg (1988) Bar-Shalom, A., Klapisch, M., & Oreg, J. 1988, Phys. Rev. A, 38, 1773
- Bevington (1960) Bevington, P. R. 1969, Data Reduction and Error Analysis for the Physical Sciences (New York: McGraw-Hill)
- Blumenthal, Drake, & Tucker (1972) Blumenthal, G. R., Drake, G. W. F., & Tucker, W. H. 1972, ApJ, 172, 205
- Doschek, Feldman, & Cowan (1981) Doschek, G. A., Feldman, U., & Cowan, R. D. 1981, ApJ, 245, 315
- Doschek, Meekins, & Cowan (1973) Doschek, G. A., Meekins, J. F., & Cowan, R. D. 1973, Sol. Phys., 29, 125
- Eisenbart et al. (2002) Eisenbart, S., Beuermann, K., Reinsch, K., & Gänsicke, B. T. 2002, A&A, 382, 984
- Fawcett et al. (1987) Fawcett, B. C., Jordan, C., Lemen, J. R., & Phillips, K. J. H. 1987, MNRAS, 225, 1013
- Foster, Keenan, & Reid (1997) Foster, V. J., Keenan, F. P., & Reid, R. H. G. 1997, At. Data Nucl. Data Tables, 67, 99
- Fournier et al. (2001) Fournier, K. B., et al. 2001, ApJ, 561, 1144
- Frank, King, & Raine (1992) Frank, J., King, A., & Raine, D. 1992, Accretion Power in Astrophysics (Cambridge: CUP)
- Gabriel & Jordan (1969) Gabriel, A. H., & Jordan, C. 1969, MNRAS, 145, 241
- Greeley et al. (1997) Greeley, B. W., Blair, W. P., Long, K. S., & Knigge, C. 1997, ApJ, 488, 419
- Hurwitz et al. (1997) Hurwitz, M., Sirk, M., Bowyer, S., & Ko, Y.-K. 1997, ApJ, 477, 390
- Klapisch (1971) Klapisch, M. 1971, Computer Phys. Comm., 2, 239
- Klapisch et al. (1977) Klapisch, M., Schwob, J., Fraenkel, B., & Oreg, J. 1977, J. Opt. Soc. Am., 67, 148
- Mason & Storey (1980) Mason, H. E., & Storey, P. J. 1980, MNRAS, 191, 631
- Mauche (1999) Mauche, C. W. 1999, ApJ, 520, 822.
- Mauche (2000) Mauche, C. W. 2000, BAAS, 32, 1561
- Mauche (2002) Mauche, C. W. 2002, in The Physics of Cataclysmic Variables and Related Objects, ed. B. T. Gänsicke, K. Beuermann, & K. Reinsch (San Francisco: ASP), 113
- Mauche, Liedahl, & Fournier (2001) Mauche, C. W., Liedahl, D. A., & Fournier, K. B. 2001, ApJ, 560, 992
- Mauche, Liedahl, & Fournier (2003) Mauche, C. W., Liedahl, D. A., & Fournier, K. B. 2003, in IAU Colloquium No. 190—Magnetic Cataclysmic Variables, ed. M. Cropper & S. Vrielmann (San Francisco: ASP), in press (astro-ph/0301633)
- Mazzotta et al. (1998) Mazzotta, P., Mazzitelli, G., Colafrancesco, S., & Vittorio, N. 1998, A&AS, 133, 403
- Osten et al. (2003) Osten, R. A., Ayres, T. R., Brown, A., Linsky, J. L., & Krishnamurthi, A. 2003, ApJ, 582, 1073
- Phillips et al. (1996) Phillips, K. J. H., Bhatia, A. K., Mason, H. E., & Zarro, D. M. 1996, ApJ, 466, 549
- Phillips et al. (1982) Phillips, K. J. H., et al. 1982, ApJ, 256, 774
- Phillips et al. (2001) Phillips, K. J. H., Mathioudakis, M., Huenemoerder, D. P., Williams, D. R., Phillips, M. E., & Keenan, F. P. 2001, MNRAS, 325, 1500
- Porquet et al. (2001) Porquet, D., Mewe, R., Dubau, J., Raassen, A. J. J., & Kaastra, J. S. 2001, A&A, 376, 1113
- Wargelin et al. (1998) Wargelin, B. J., Beiersdorfer, P., Liedahl, D. A., Kahn, S. M., & von Goeler, S. 1998, ApJ, 496, 1031
- Zhang & Pradhan (1997) Zhang, H. L., & Pradhan, A. K., 1997, A&AS, 123, 575