Discovery of an overdensity of faint red galaxies in the vicinity of the radio galaxy 3C 294††thanks: Based on observations made with ESO Telescopes at the Paranal Observatory under programme ID 68.A–0560
Abstract
We report the discovery of an overdensity of faint red galaxies in the vicinity of the radio galaxy 3C 294. The overdensity, discovered in a 84 min -band ISAAC/VLT image is significant at the level (compared to the local field density), and overlaps with the extended X-ray emission around 3C 294 detected with the Chandra X-ray Observatory. The near-infrared colours of the galaxies making up the overdensity show a large scatter and the galaxies do not follow a red sequence in the colour magnitude diagram. If the galaxies are in a cluster at they must be dominated by young stellar populations with different star-formation histories.
keywords:
galaxies: clusters: individual: 3C 294 - galaxies: evolution - galaxies: formation - galaxies: high redshift - cosmology: observations - X-rays: clusters1 introduction
The most powerful low-redshift radio galaxies are giant elliptical galaxies and are often found to be dominant central galaxies in rich clusters. If this is also the case at high redshift, luminous radio galaxies may be useful tracers of distant clusters. Fabian et al. (2001) reported the detection of diffuse X-ray emission with the characteristics of an intracluster medium, surrounding the radio galaxy 3C 294, suggesting the presence of a cluster of galaxies around it. However, the 200 ksec Chandra follow-up study (Fabian et al. (2003)) indicates that the diffuse emission is most likely non-thermal, but confined by an intracluster medium. 3C 294 is a radio source associated with an emission-line galaxy, with a double-hotspot radio morphology suggestive of precessing jets originating from the weak flat-spectrum core (McCarthy et al., 1990). The galaxy is embedded in a elongated Ly nebula roughly aligned with the radio structure (McCarthy et al., 1990).
A bright () star west of 3C 294 has hampered deep optical observations of the surrounding field, but has allowed the use of adaptive optics for deep, high-resolution imaging of the radio galaxy at near-infrared (NIR) wavelengths (Stockton et al., 1999; Quirrenbach et al., 2001). These observations resolve the radio galaxy in several distinct subclumps in the process of merging, supporting the idea that 3C 294 is located in a dense environment. In this Letter we present NIR imaging of the field around 3C 294 revealing intriguing evidence for an overdensity of faint red galaxies in the vicinity of 3C 294. Sec. 2 describes the observations, the data reduction and analysis techniques. In Sec. 3 we present results on the spatial and colour distribution of galaxies in the field, and in Sec. 4 we discuss the results.
Throughout this Letter we assume a flat , , cosmology. At a redshift of 1.786, one arcsec corresponds to an angular distance of 9.1 kpc.
2 Data
We have obtained NIR observations at the field around 3C 294 with the ISAAC instrument on the VLT UT1 telescope. The observations were carried out in service mode on April 1, 2002 and consist of 84 min in the band and 40 min in each of the and bands. The exposure time at the individual dither positions was kept short (10 sec in all bands) to reduce the effects of the bright star west of 3C 294 on the surrounding field.
The data were reduced using a combination of the eclipse software package (Devillard, 1997) and the IRAF “Experimental Deep Infrared Mosaicing Software” xdimsum. Eclipse was used to remove effects of electrical ghosts from science and calibration frames and to construct flat fields and bad-pixel maps from a series of twilight sky flats. Sky subtraction and combination of the individual science frames was carried out with xdimsum. The and band images were geometrically transformed to the band image (using the IRAF tasks geoform and geotran). The observations were performed in photometric weather conditions. The seeing in the combined frames is approximately in all wavebands.
For the photometric calibration we used zero-points derived for that night by the ESO staff (corrected for atmospheric extinction). These are accurate to about and can be found on the ESO webpage111http://www.eso.org/observing/dfo/quality/ISAAC/img/trend/.
Object detection was performed in the band, using the SExtractor software (Bertin & Arnouts, 1996) with default parameter settings. We searched for the detected objects in the remaining frames using the SExtractor ASSOC option. The SExtractor class_star parameter was used to exclude obvious stars (objects with well-defined FWHM, and class_star 0.5) from the sample. For deriving the total band magnitudes of the objects we used the SExtractor parameter mag_best which has been shown to be accurate to about (Smail et al., 2001). Colours were derived in fixed apertures of 10 pixels which corresponds to approximately 13 kpc at with the ISAAC pixel scale of pix-1.
A 20 ksec observation with the ACIS-S detector aboard the Chandra X-ray Observatory was obtained on October 29, 2000 (Fabian et al., 2001) with 3C 294 placed near the nominal aim point on the back-illuminated S3 CCD. Our analysis uses the standard data products from the public Chandra archive.
We aligned the NIR and CXO images by tying them separately to the Second STScI Digitized Sky Survey image of the field (DSS-II, e.g. McLean et al. (2000)), in order to avoid having to assume that the X-ray and optical emission from 3c294 originate in the same spot.
3 Results
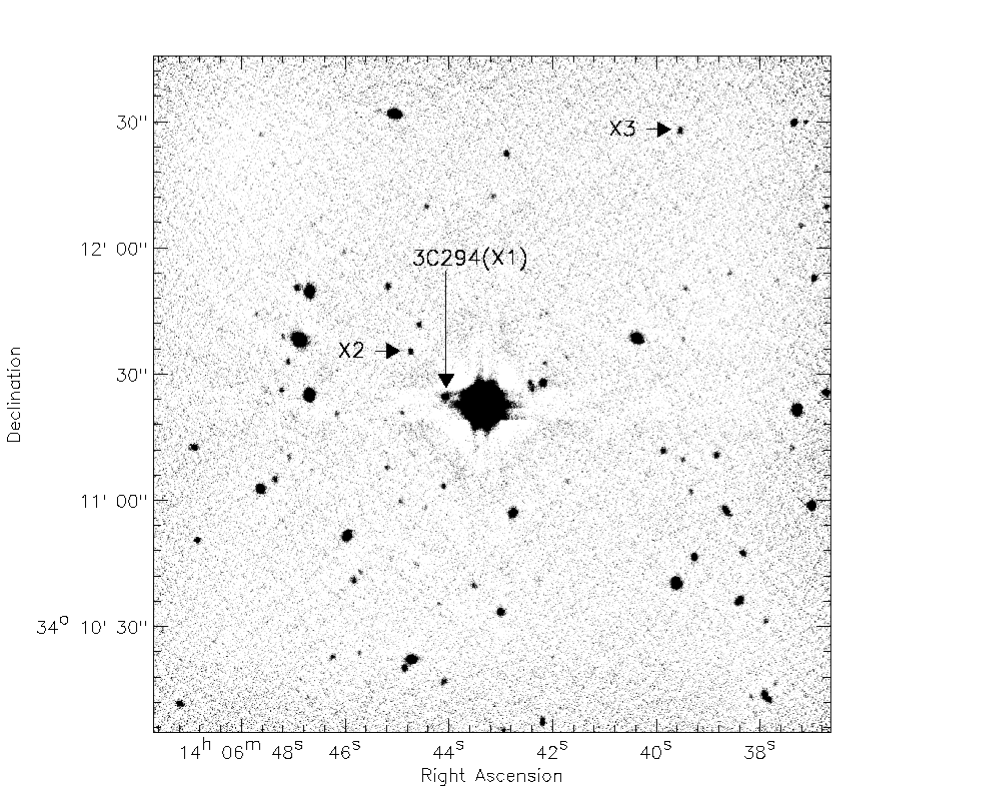
In Fig. 1 we show the band image of the field around 3C 294. The short exposure time and careful background subtraction confines the extent of the bright star to a circular area of radius and a surrounding circular area (extending to radius ) where the background is slightly oversubtracted. The derived photometric errors of objects in this area are not significantly larger than those derived for objects further away from the star. The derived -band magnitude of 3C 294 (see Table 1) is consistent with the magnitude found by McCarthy et al. (1990) in a 3 aperture.
3.1 X-ray emission
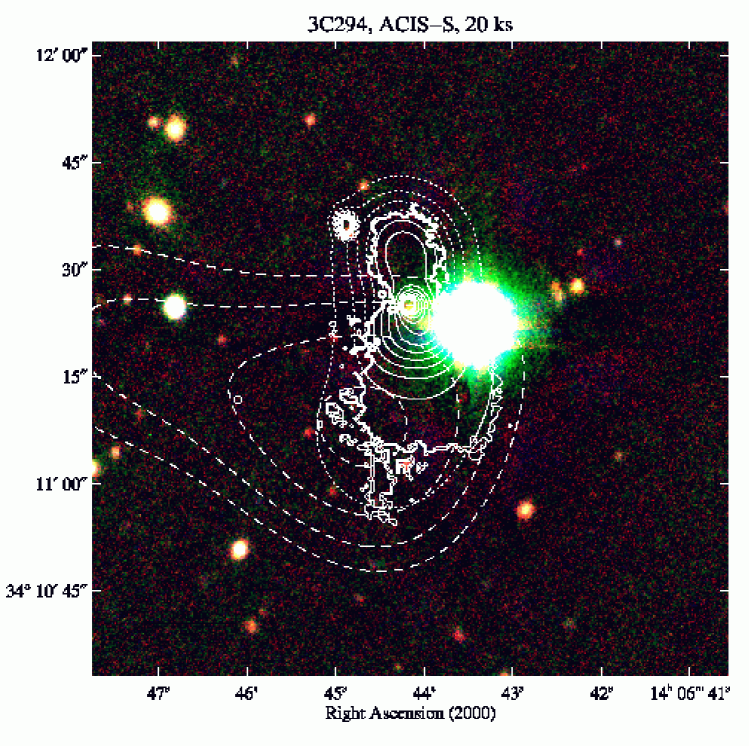
Both pointlike and extended diffuse X-ray emission are detected in the direction of 3C 294. We show the adaptively smoothed X-ray emission as detected in this ACIS-S observation in Fig. 2. Using the asmooth algorithm of Ebeling et al. (2003) we adjust the scale of the Gaussian smoothing kernel such that all features apparent in the smoothed X-ray image are at least significant. This significance criterion is met within the ragged, bold contours shown in Fig. 2. As noted already by Fabian and coworkers the diffuse emission is very compact (about 100 kpc in radius at the redshift of 3C 294) and hour-glass shaped.
3.2 Distribution of faint galaxies
In addition to a few dozen bright foreground galaxies, a substantial number of faint red galaxies were detected in the immediate vicinity of the radio galaxy. The significance of this overdensity was quantified from a smoothed galaxy density map of the central part of the field. Due to the dithering pattern, only the central had the full exposure time. An image was constructed where the pixel values at the centroid of faint () galaxies were set equal to 1 and the rest of pixels in the image were set to zero. This image was then adaptively smoothed, using the asmooth algorithm of Ebeling et al. (2003), aiming at significance. In Fig. 2 we superpose the contours of the resulting smoothed galaxy density distribution and the contours of the Chandra observations of the diffuse X-ray emission on a composite a , , image of the central of the field. The galaxy density contours start at 2.5 times the local background density and increase by 5% between the adjacent contours. The local background density was estimated as the mean density of galaxies in the field (excluding the part of the image containing the overdensity). From Fig. 2 there is evidence for an overdensity of faint galaxies in the vicinity (within 150 kpc) of 3C 294. The peak significance reached at the center of the contours is 2.4 . The contours of the galaxy overdensity overlap with the contours of the extended X-ray emission but are more extended. It should be noted that a substantial number of faint galaxies that could increase the significance of the overdensity are likely to be hidden behind the star and in the surrounding area with poor sky subtraction.
3.3 Colours of the faint galaxies
In Fig. 3 we plot vs for faint () galaxies in the vicinity of 3C 294. Also indicated is the predicted colour magnitude relation at the redshift of 3C 294 for populations of passively evolving elliptical galaxies formed at redshifts , 3 and 5 (Kodama & Arimoto, 1997). No distinct “red sequence” (Stanford et al., 1998) is seen in the diagram. The red sequence of cluster galaxies is predicted to increase its scatter and eventually fall apart as the redshift approaches the formation redshift of the stars in the galaxies. If the majority of the galaxies that make up the overdensity are at the redshift of the radio galaxy, the absence of a red sequence may be due to differences in the dust content, the morphology and/or the age of the stellar populations of the galaxies. Alternatively, the galaxies that make up the overdensity could be a chance alignment of galaxies at different redshifts.
3C 294 has been observed with the WFPC2 camera (aboard the Hubble Space Telescope) through the F702W filter in two epochs. These data are however too shallow to detect the galaxies that make up the overdensity (with a total exposure time of 19 min, the radio galaxy is only marginally detected).

3.4 X-ray point sources
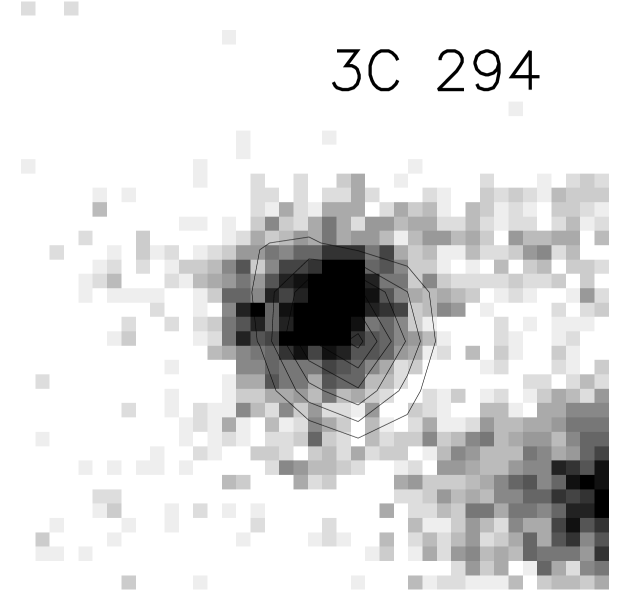
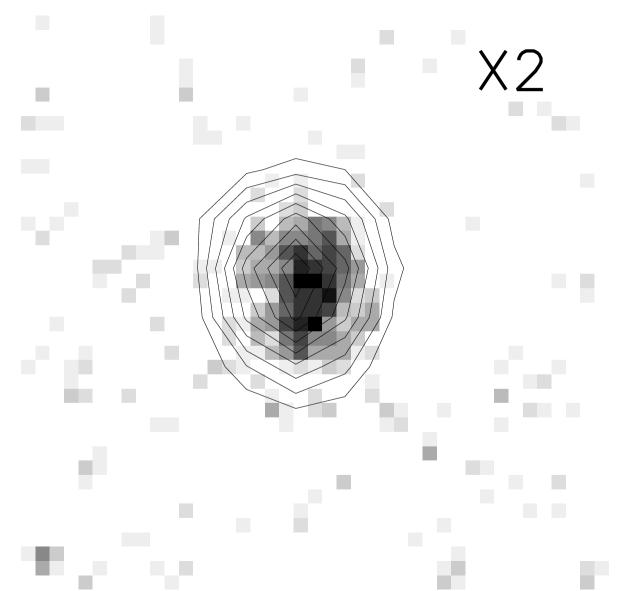
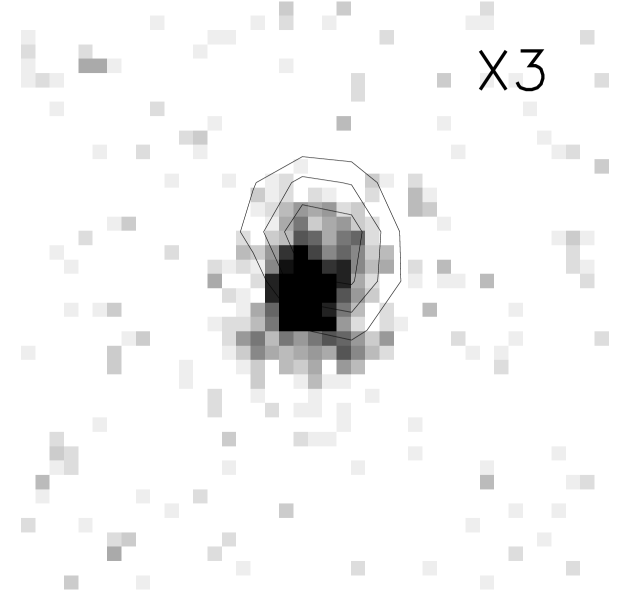
Consistent with expectations from deep Chandra observations (Rosati et al., 2002) of about three random X-ray point sources within the field covered by the -band image, we detect 3C 294 and two other X-ray point sources in the Chandra 0.5–5 keV image. Properties of these point sources are given in Table 1. They all have obvious, extended NIR counterparts (see Fig. 4) with colours compatible with colours of the faint galaxies around 3C 294. If the sources are situated at the redshift of 3C 294, their X-ray luminosities are typical of active galaxies. The derived hardness ratios of the point sources suggest that X2 is an AGN type II, and that X3 is an AGN type I (Fig. 3 in Rosati et al. (2002)). In a Chandra study of the nearby galaxy cluster Abell 2104, Martini et al. (2002) detect two active galaxies with erg s-1 (the detection limit of the 3C 294 Chandra image). The properties of the X-ray point sources in the field of 3C 294 are thus consistent with the expectation for a cluster at .
| 3C 294 (X1) | X2 | X3 | |
| 6.9 | 1.8 | 0.8 | |
| HR | 0.6 | ||
| RA(J2000.0) | 14:06:44.0 | 14:06:44.7 | 14:06:39.5 |
| Dec(J2000.0) | +34:11:25.4 | +34:11:36.4 | +34:12:29.6 |
 ,
, ,
,
4 Discussion
We have presented evidence for an overdensity of faint red galaxies in the vicinity of the massive radio galaxy 3C 294, which overlaps with the extended soft X-ray emission detected with Chandra. We note, however, that the misalignment of the X-ray and galaxy density centroids as well as their very different degrees of angular extent and concentration makes it unlikely that the X-ray emission is due to a relaxed intracluster medium.
The galaxy overdensity detection and the X-ray emission are, as independent pieces of evidence for a cluster in the field, only marginally significant. However, considering that they overlap with each other and with the position of a massive radio galaxy (believed to trace high density environments) makes the case for a cluster of galaxies around 3C 294 appealing, although it has to be confirmed by additional deeper, more detailed studies.
At this redshift, clusters are expected to be in a transition phase between that of the proto clusters picked out by Ly imaging techniques (Pentericci et al., 2000) and the massive clusters selected by optical or X-ray techniques (Stanford et al., 1998; Rosati et al., 1999; Ebeling et al., 2000; Ebeling et al., 2001), and therefore very valuable both for galaxy evolution studies, and structure evolution studies in general.
Studies of the galaxy population, even in the highest redshift clusters known to date, have not been able to distinguish between the hierarchical formation scenario which is supported by an increasing fraction of blue and merging galaxies with redshift (van Dokkum et al., 2000; van Dokkum et al., 2001) and the monolithic elliptical galaxy formation scenario (Eggen et al., 1962) which is supported by the presence of the well defined “red sequence” of elliptical galaxies in most known clusters (Gladders et al., 1998). The presence of the red sequence favors monolithic collapse, but does not exclude the possibility that cluster ellipticals formed from mergers of smaller galaxies as long as the bulk of star formation took place at much larger redshifts and there was little star formation in the subsequent merging process.
If the galaxies making up the overdensity presented here are confirmed to be in a cluster at it will be the first example of a cluster where the characteristic red sequence has not yet formed and the colours of the galaxies are dominated by young stellar populations with different star formation histories. Such a system is potentially very powerful for constraining galaxy formation and evolution models.
5 Acknowledgments
We thank T. Kodama for providing us with his elliptical galaxy evolution models, N. Drory and G. Feulner for letting us use their scripts for distortion corrections. ST acknowledges support from the Danish Ground-Based Astronomical Instrument Centre (IJAF). This work was supported by the Danish Natural Science Research Council (SNF).
References
- Bertin & Arnouts (1996) Bertin E., Arnouts S., 1996, A&AS, 117, 393
- Devillard (1997) Devillard N., 1997, The Messenger, 87
- Ebeling et al. (2001) Ebeling H., Jones L. R., Fairley B. W., Perlman E., Scharf C., Horner D., 2001, ApJL, 548, L23
- Ebeling et al. (2000) Ebeling H., Jones L. R., Perlman E., Scharf C., Horner D., Wegner G., Malkan M., Fairley B. W., Mullis C. R., 2000, ApJ, 534, 133
- Ebeling et al. (2003) Ebeling H., White S., Rangarajan R., 2003, in prep.
- Eggen et al. (1962) Eggen O. J., Lynden-Bell D., Sandage A., 1962, ApJ, 136, 748
- Fabian et al. (2003) Fabian A., Sanders J., Crawford C., Ettori S., 2003, astro-ph/0301486
- Fabian et al. (2001) Fabian A. C., Crawford C. S., Ettori S., Sanders J. S., 2001, MNRAS, 322, L11
- Gladders et al. (1998) Gladders M. D., Lopez-Cruz O., Yee H. K. C., Kodama T., 1998, ApJ, 501, 571
- Kodama & Arimoto (1997) Kodama T., Arimoto N., 1997, A&A, 320, 41
- Martini et al. (2002) Martini P., Kelson D. D., Mulchaey J. S., Trager S. C., 2002, ApJL, 576, L109
- McCarthy et al. (1990) McCarthy P. J., Spinrad H., Dickinson M., van Breugel W., Liebert J., Djorgovski S., Eisenhardt P., 1990, ApJ, 365, 487
- McLean et al. (2000) McLean B. J., Greene G. R., Lattanzi M. G., Pirenne B., 2000, in ASP Conf. Ser. 216: Astronomical Data Analysis Software and Systems IX The Status of the Second Generation Digitized Sky Survey and Guide Star Catalog. pp 145
- Pentericci et al. (2000) Pentericci L., Kurk J. D., Röttgering H. J. A., Miley G. K., van Breugel W., Carilli C. L., Ford H., Heckman T., McCarthy P., Moorwood A., 2000, A&A, 361, L25
- Quirrenbach et al. (2001) Quirrenbach A., Roberts J. E., Fidkowski K., de Vries W., van Breugel W., 2001, ApJ, 556, 108
- Rosati et al. (1999) Rosati P., Stanford S. A., Eisenhardt P. R., Elston R., Spinrad H., Stern D., Dey A., 1999, AJ, 118, 76
- Rosati et al. (2002) Rosati P., Tozzi P., Giacconi R., Gilli R., Hasinger G., Kewley L., Mainieri V., Nonino M., Norman C., Szokoly G., Wang J. X., Zirm A., Bergeron J., Borgani S., Gilmozzi R., Grogin N., Koekemoer A., Schreier E., Zheng W., 2002, ApJ, 566, 667
- Smail et al. (2001) Smail I., Kuntschner H., Kodama T., Smith G., Packham C., Fruchter A., Hook R., 2001, MNRAS, 323, 839
- Stanford et al. (1998) Stanford S. A., Eisenhardt P. R., Dickinson M., 1998, ApJ, 492, 461
- Stockton et al. (1999) Stockton A., Canalizo G., Ridgway S. E., 1999, ApJL, 519, L131
- van Dokkum et al. (2000) van Dokkum P. G., Franx M., Fabricant D., Illingworth G. D., Kelson D. D., 2000, ApJ, 541, 95
- van Dokkum et al. (2001) van Dokkum P. G., Stanford S. A., Holden B. P., Eisenhardt P. R., Dickinson M., Elston R., 2001, ApJL, 552, L101