theDOIsuffix \Volume324 \IssueS1 \CopyrightissueS1 \Month01 \Year2003 \pagespan3 \Receiveddate3 March 2003
A New X-Ray Flare from the Galactic Nucleus Detected with XMM-Newton
Abstract.
The compact radio source Sgr A∗ believed to be the counterpart of the massive black hole at the Galactic nucleus, was observed to undergo rapid and intense flaring activity in X-rays with Chandra in October 2000. We report here the detection with XMM-Newton EPIC cameras of the early phase of a similar X-ray flare from this source, which occurred on 2001 September 4. The source 2-10 keV luminosity increased by a factor 20 to reach a level of 4 1034 erg s-1 in a time interval of about 900 s, just before the end of the observation. The data indicate that the source spectrum was hard during the flare and can be described by simple power law of slope 0.7. This XMM-Newton observation confirms the results obtained by Chandra, suggests that, in Sgr A∗, rapid and intense X-ray flaring is not a rare event and therefore sets some constraints on the emission mechanism models proposed for this source.
keywords:
Accretion, accretion disks — Black hole physics — Galaxy: center — X-rays: generalpacs Mathematics Subject Classification:
04A251. Introduction
The bright, compact radio source Sgr A∗ is believed to be the radiative counterpart of the 2.6 106 M⊙ black hole which governs the dynamics of the central pc of our Galaxy (Melia Falcke 2001). The compelling evidence for such a massive black hole at the Galactic Center (see Schödel et al. 2002 for the most rescent results), contrasts remarkably with the weak high-energy activity of this object. In spite of the fact that stellar winds and hot gas probably provide enough material for a moderate/low level of accretion, the total bolometric luminosity of the source amounts to less than 10-6 of the estimated accretion power (Melia Falcke 2001, Goldwurm 2001). This motivated the development of several black hole accretion flow models with low radiative efficiency, some of which have also been applied to binary systems, low luminosity nuclei of external galaxies and low luminosity active galactic nuclei. These models include spherical Bondi accretion in conditions of magnetic field sub-equipartition with a very small Keplerian disk located within the inner 50 Schwarzschild radii (RS), large hot two-temperature accretion disks dominated by advection (ADAF) or non-thermal emission from the base of a jet of relativistic electrons and pairs, and some other variants or combination of the above models. However any such model still predicts some level of X-ray emission from Sgr A∗ and determining the properties of such emission would constrain the theories of accretion and outflows in the massive black holes and in general in compact objects.
The 20 years search for high energy emission from Sgr A∗ (Watson et al. 1981, Predehl Trümper 1994, Goldwurm et al. 1994) has recently come to a turning point with the remarkable observations made with the Chandra X-ray Observatory in 1999 and in 2000. Baganoff et al. (2001a) first reported the detailed 0.5′′ resolution images obtained with Chandra in the range 0.5-7 keV, which allowed the detection of weak X-ray emission from the radio source. The derived luminosity in the 2-10 keV band was 2 1033 erg s-1, for a distance of 8 kpc with steep power law spectrum (index of 2.7) and some evidence that the source is in part extended on a 1′′ scale. Then, in October 2000, the same source was seen to flare up by a factor of 45 in a few hours (Baganoff et al. 2001b). The luminosity increased from the quiescent level measured in 1999 to a value of 1035 erg s-1. The flare lasted a total of 10 ks but the shortest variation took place in about 600 s, implying activity on length scales of 20 RS, for the above quoted mass of the galactic center black hole. Evidence of spectral hardening during the flare was also reported by the authors who determined a source power law photon index during the event of 1.3 ( 0.55), significantly flatter than observed during the quiescent state. These results constrain models of the accretion flow and radiation mechanism for Sgr A∗.
XMM-Newton, the other large X-ray observatory presently in operation, features three large area X-ray telescopes coupled to three CCD photon imaging cameras (EPIC) operating in the 0.1-15 keV range and to two reflection grating spectrometers (RGS) working in the 0.1-2.5 keV band (Jansen et al. 2001). Although its angular resolution (6′′ FWHM) is insufficient for properly resolving Sgr A∗ in quiescence, an intense flare such as the one seen by Chandra can be easily detected and studied with XMM-Newton. We report here (see also Goldwurm et al. 2003) the detection of such en event during a 26 ks XMM-Newton observation of the Galactic nucleus performed on 2001 September 4 as part of a large Galactic Center survey program with XMM-Newton (Warwick et al. 2003).
2. Results
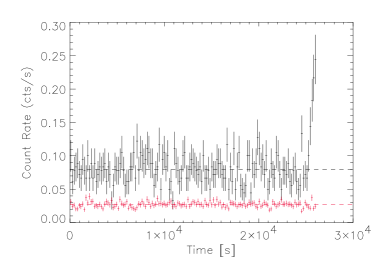
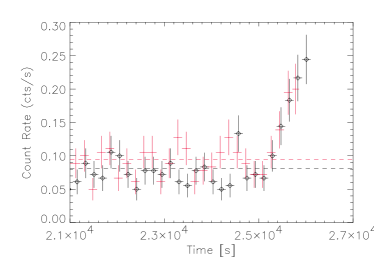
The EPIC data reduction and analysis of this XMM-Newton observation are described in detail in Goldwurm et al. (2003). The image recorded in the central CCD (11′ 11′ for the MOS) was dominated by the diffuse emission of the Sgr A East region, and in order to search for a variable central source we extracted and analyzed light curves from events collected within a 10′′ radius region centered on Sgr A∗. As shown in Fig. 1, the 2-10 keV count rate from the combined MOS 1 and MOS 2 events selected in this way, is quite stable around an average value of 0.08 cts s-1 till the last 900 s of the observation. Then the count rate gradually increases to reach a value of about a factor 3 higher in the last bin. The integrated count rate in the last 900 s reaches 7 over the average value measured before the flare and the detected variation has a negligible probability to be a statistical fluctuation. A similar peak (4.3 ) is observed in the counts extracted from the PN camera which stopped observing about 250 s before the MOS (see Fig. 1 b)). Similar light curves, from a larger region far from the source do not show any evidence of such an increase in the counting rate.
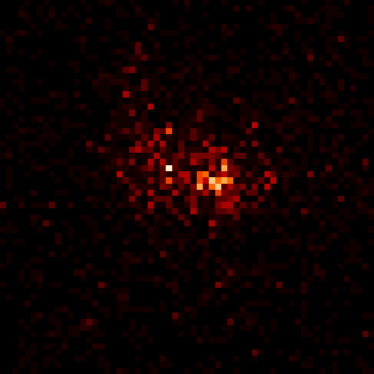
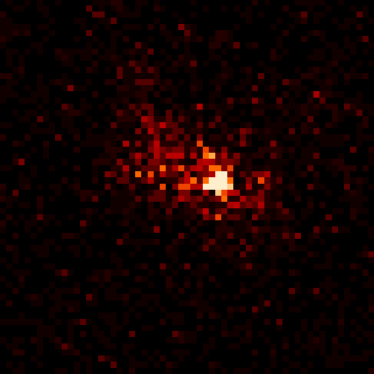
In Fig. 2 we report a MOS image of the region around the nucleus integrated during the 1000 s before the flare and a similar image integrated during the last 1000 s and fully including the source flare. The brightening we detected in the light curves is clearly due to the brightening of a central source. We compared data to the instrument point spread function to determine the location of the excess. On the 2-10 keV MOS 1 and MOS 2 image of the last 1000 s, rebinned to have pixel size of 4′′, we obtained the centroid of the source at R.A. (J2000) = 17h 45m 39.99s Dec (J2000) = -29∘ 00′ 26.7′′, with a total error, dominated by residual systematic uncertainties in the XMM-Newton focal plane, of 1.5′′. The derived flare position is therefore compatible with Sgr A∗ radio location (Yusef-Zadeh et al. 1999), since it is offset from the latter by only 1.5′′ and we conclude that the flare detected by XMM-Newton is associated with the galactic nucleus.
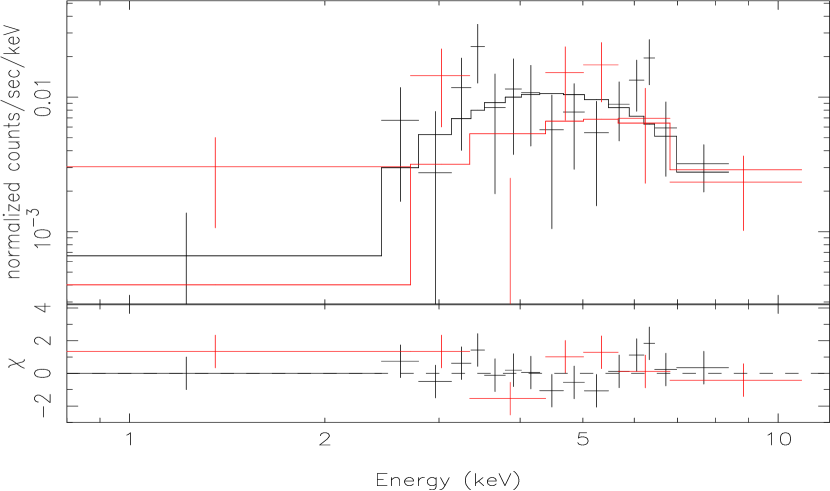
A first spectral analysis of the flaring event was performed by computing a simple hardness ratio, defined as the ratio between the measured counts (including background) in the hard band 4.5-10 keV, and those in the soft band 2-4.5 keV. We found that the hardness ratio increased by 0.32 0.13 during the event with respect to the value before the flare. Though the hardening has a modest statistical significance of 2.5 , it is fairly consistent with the flare trend observed with Chandra. Since Chandra data showed that the quiescent emission within 10′′ from Sgr A∗ position contains a dominant diffuse emission and a large contribution from close point sources, we had to model in someway this components to study the flare spectrum (see Goldwurm et al. 2003). We extracted MOS and PN count spectra from the 10′′ radius circular region centered on Sgr A∗ before the flare and during the flare (last 900 s for MOS and last 700 s for PN). To derive the spectra reported in Fig. 3 we used the spectra extracted before the flare as background components for the flare spectra. After subtraction of the non-flaring count spectrum, the flaring MOS and PN spectra were fitted with a simple absorbed power law with NH fixed to the Chandra measured value of 9.8 1022 cm-2 and leaving untied the MOS and PN normalizations. Results both without and including dust scattering are reported in Table 1. We obtained a best fit photon index of 0.7 0.5 (error at 1 for one interesting parameter) with = 0.98 for 20 d.o.f., that is significantly harder than the spectrum measured with Chandra during the quiescent state (2.7 1.0), and compatible, within uncertainties, to the index measured during the 2000 October flare. This procedure subtracts from the flare spectrum the non flaring component of Sgr A∗ and therefore assumes that the quiescent emission from Sgr A∗ is negligible. This is an acceptable approximation since, if at the level measured in 1999 by Chandra, the quiescent emission contributes by only 5 to the counts of the flare spectrum. On the other hand, this procedure allows to subtract the diffuse emission present in the region of the spectral extraction and the instrumental background in a model-independent way. We remark that the count excess around 6-7 keV in the residuals of the MOS spectrum of Fig. 3 is not significant. Including a narrow gaussian line at 6.4 keV (with fixed centroid and zero width) to the model of the absorbed power law, we can set an upper limit (90 confidence level in 1 parameter) to an iron emission line of about 1.8 keV equivalent width.
The measured absorbed source flux in the 2-10 keV band, corrected for the fraction of encircled energy at a distance of 10′′ (60), is then of (3.3 0.6) 10-12 ergs cm-2 s-1 (1 errors by fixing best fit parameters but normalization), equivalent to a 2-10 keV luminosity at 8 kpc of 4 1034 erg s-1. This is the average value in the last 900 s but the last light curve 180 s bin was about a factor 1.4 higher, thus the luminosity reached a value of 6 1034 erg s-1. These numbers are subject to large errors due to the low statistics available. But the general result which emerges is that the flare we detected presents a harder spectrum than the one measured with Chandra for Sgr A∗ during the quiescent period.
a)
 b)
b)
a)
 b)
b)
3. Discussion
The XMM-Newton discovery of a new X-ray flare of Sgr A∗ in September 2001 confirms the results obtained in the earlier Chandra observations. XMM-Newton observed only the first part of the flare, but the recorded event is fully compatible in intensity, spectrum and time scales with the early phase of the flare seen by Chandra. This detection of another such large X-ray flare from Sgr A∗ indicates that the event is not rare. In spite of the lack of detection of flares from Sgr A∗ in another 50 ks XMM-Newton observation performed in February 2002 (Predehl et al. 2003), the dayly presence of X-ray flares in Sgr A∗ has been recently confirmed by further Chandra observations performed in 2002 (Baganoff et al. 2003). The radio source on the other hand has been observed many times and the detected flux variability has never exceeded a factor 2 (Zhao et al. 2001). This implies that it is unlikely that radio emission presents a comparable large increase in flux and this provides some constraints on the models.
The X-ray flare from Sgr A∗ cannot be explained by pure Bondi or ADAF models (Narayan et al. 1998) as in these models the emission is due to thermal bremsstrahlung from the whole accretion flow and arises from an extended region (between 103 - 105 RS) which cannot account for such rapid variability. Models which predict emission from the innermost regions near the black hole involve a mechanism acting either at the base of a jet of relativistic particles (Markoff et al. 2001) or in the hot Keplerian flow present within the circularization radius of a spherical flow (Melia et al. 2001, Liu Melia 2002). In both cases a magnetic field is present in the flow and the linearly polarized sub-mm radiation is attributed to optically thin synchrotron emission from the inner region, while the X-rays during quiescent period are produced by the synchrotron self-Compton (SSC) mechanism whereby radio to mm photons are boosted to X-ray energies by the same relativistic or subrelativistic electrons that are producing the synchrotron radiation. However large X-ray flux variations produced by a change in accretion rate in these models would imply an equivalent increase in the radio and sub-mm part of the spectrum not compatible with the lower amplitude of radio changes compared to X-rays (Markoff et al. 2001). Not to mention that the X-ray spectrum would remain rather steep. The model of a inner circularized flow however predicts low or anti correlation of the radio emission with the X-rays if the radiation mechanism for the X-ray flare is bremsstrahlung rather than SSC. The sub-mm and far IR domain on the other hand would in this case show a large correlated increase, but at these frequencies the measurements have not been frequent enough to settle the issue. Though the exact modelling of radiation process depends on viscosity behavior and other uncertain details, the observed hardening of the spectrum during the flare indeed favours the bremsstrahlung emission mechanism in this model rather than the SSC one (Liu Melia 2002). Another totally different model for the X-ray flares (Nayakshin Sunyaev 2003) proposes that those result from the interraction of close orbiting stars with a very cold neutral accretion disk around Sgr A∗.
More compelling constraints on the models will be set when simultaneous observations in radio/sub-mm and X-ray wavelengths of such a flare are obtained. We compared the time of the flare to a recent radio light curve of Sgr A∗ obtained at 1.3 cm and 2 cm with the VLA between 2001 March and November (Yuan Zhao 2003). The X-Ray flare occurred 1-2 days after a local maximum of the curve, but no radio data points are reported for the day when our XMM-Newton observation took place. It will be also important to study the shape of the flare spectrum at energies higher than 10 keV to fully understand the radiation mechanism producing the X-rays. In particular by measuring the high energy cut-off of the spectrum one could determine the electron temperature for a thermal emission or the Lorentz factor for non-thermal processes. We estimated that such a flare should be marginally visible in the range 10-60 keV with the low energy instruments on board the new gamma-ray mission INTEGRAL, operating since 2002 October, if the spectrum extends to these energies with the slope observed with Chandra and XMM-Newton.
This paper is based on observations with XMM-Newton, an ESA science mission with instruments and contributions funded by ESA member states and the USA (NASA).
References
- [1] Baganoff, F., et al., 2001a, ApJ, in press (astro-ph/0102151)
- [2] Baganoff, F., et al., 2001b, Nature, 413, 45
- [3] Baganoff, F., et al., 2003, these proceedings
- [4] Goldwurm, A., et al., 1994, Nature, 371, 589
- [5] Goldwurm, A., 2001, Proc. of the 4th INTEGRAL Workshop, ESA-SP 459, 455
- [6] Goldwurm, A., et al., 2003, ApJ, 584, 751
- [7] Jansen, F., et al., 2001, AA, 365, L1
- [8] Liu, S., Melia, F., 2002, ApJ, 566, L77
- [9] Markoff, S., et al., 2001, A&A, 379, L13
- [10] Melia, F. Falcke, H., 2001, ARAA, 39, 309
- [11] Melia, F., Liu, S., Coker, R. F., 2001, ApJ, 553, 146
- [12] Narayan, R., et al., 1998, ApJ, 492, 554
- [13] Nayakshin, S. Sunyaev, R., 2003, MNRAS, submitted (astro-ph/0302084)
- [14] Predehl, P. Trümper, J., 1994, A&A, 290, L29
- [15] Predehl, P., et al., 2003, these proceedings
- [16] Schödel, R., et al., 2002, Nature, 419, 694
- [17] Watson, M.G., et al., 1981, ApJ, 250, 142
- [18] Warwick, R. S., et al., 2003, these proceedings
- [19] Yuan, F. Zhao, J., 2003, Chin. J. Astron. Astrophys., in press (astro-ph/0203050)
- [20] Yusef-Zadeh, F., Choate, D., Cotton, W., 1999, ApJ, 518, L33
- [21] Zhao, J., Bower, G. C., Goss, W. M., 2001, ApJ, 547, L29
[htb]
\vchcaptionSpectral Fit to X-ray Emission from within 10′′
from Sgr A∗ during the Flare
Power-law Model
No Dust Scattering
Dust Scattering
[ cm-2]
9.8
5.3
Photon Index
0.7
0.3
Norm MOS [ ph cm-2 s-1 keV-1]
1.3
0.7
Norm PN [ ph cm-2 s-1 keV-1]
0.3
0.2
0.98 (20)
0.95 (20)
Notes :
Scattering computed for fixed value of AV = 30.
Normalization is the flux density at 1 keV.
Errors are at 68.3 confidence interval
for 1 interesting parameter.