Abstract
I review the relationship between star formation and black hole building, based on spectroscopic observations of the stellar population in active galactic nuclei (AGNs) and their host galaxies. My emphasis is on large, well-defined local samples of AGNs, whose optical continua are dominated by starlight. I summarize the spectroscopic tools used to characterize their stellar content. Surveys of the nuclei of the nearest galaxies show that the stellar population in most low-power AGNs is predominantly old. In contrast, young ( Gyr) stars are detected in about half of the powerful type 2 Seyfert nuclei. I summarize Sloan Digital Sky Survey spectroscopy of the host galaxies of 22,000 AGNs. The AGN phenomenon is commonplace only in galaxies with high mass, high velocity dispersion, and high stellar surface mass density. Most normal galaxies with these properties have old stellar populations. However, the hosts of powerful AGNs (Seyfert 2s) have young stellar populations. The fraction of AGN hosts that have recently undergone a major starburst also increases with AGN luminosity. A powerful AGN presumably requires a massive black hole (host with a substantial bulge) plus an abundant fuel supply (a star-forming ISM). This combination is rare today, but would have been far more common at early epochs.
Chapter 0 Star Formation in Active Galaxies:
A Spectroscopic Perspective
1 Introduction
1 Motivation
There is no doubt that that there is a profound physical connection between the creation of supermassive black holes and the formation of bulges and elliptical galaxies. The remarkably tight correlation between the stellar velocity dispersion and black hole mass in these systems (Ferrarese & Merritt 2000; Gebhardt .et al. 2000) provides powerful evidence for this connection. The similarities and differences between the strong cosmic evolution of active galactic nuclei (AGNs) and star formation (e.g., Steidel et al. 1999; Fan et al. 2001) then lead naturally to the speculation that AGN evolution traces the build up of the spheroidal component of galaxies (e.g., Haehnelt & Kauffman 2000; Kauffmann & Haehnelt 2000).
To put the connection between black hole and galaxy building in context, it is interesting to note that the “universal” ratio of between the black hole and stellar mass in spheroids implies that a moderately powerful AGN with a bolometric luminosity of fueled by accretion with radiative efficiency of 10% would require an associated average star formation rate of 65 yr-1 if the spheroid and black hole were to be built on the same time scale. The young stars would outshine the AGN by nearly an order of magnitude in this case!
Several interrelated questions immediately arise, and have indeed formed the basis for most of the discussion at this conference. What are the relevant astrophysical processes that connect the formation of bulges and black holes? What conditions foster the fueling of a powerful AGN? Given our current understanding of galaxy evolution, can we account for the cosmic evolution of the AGN population? Can we see a scaled-down version of bulge building surrounding powerful AGNs in the local Universe, or, instead, are powerful AGNs today just the temporary rejuvenation of a pre-existing black hole with little associated star formation? Can we make any sense of the complex gas/star/black hole ecosystem with all its messy gastrophysics?
2 My Perspective
My goal is to review what is presently known about the possible connection between star formation and the AGN phenomenon, both in active galaxies and in their nuclei. This is sometimes called the “starburst-AGN connection” (e.g., Terlevich 1989; Heckman 1991), a vast, sprawling topic that cannot be adequately reviewed in a single short paper. Excellent overviews may be found in the volumes edited by Filippenko (1992) and Aretxaga, Kunth, & Mujica (2001a). Other recent reviews that complement the present paper include those by Veilleux (2001) and Cid Fernandes, Schmitt, & Storchi-Bergmann (2001a).
This paper will be focused in scope and methodology. I will just review observations, and only discuss spectroscopic measures of the stellar populations (ignoring indirect evidence for star formation like molecular gas, and far-IR, UV, and radio continuum emission). I will strongly emphasize systematic investigations of large well-defined samples. These restrictions will allow me to make rather robust statements about the empirical basis for a connection between AGNs and star formation. However, these restrictions effectively limit me to the local Universe. While the black hole/bulge connection was largely established at high redshift, I hope to show that we can gain key insights from the fossil record and from local analogs.
3 Spectral Diagnostics of Young Stars
For young massive stars the strongest spectral features with the greatest diagnostic power lie in the vacuum UV regime between the Lyman break and 2000 Å (e.g., Leitherer et al. 1999; de Mello, Leitherer, & Heckman 2000). These include the strong stellar wind lines of the O VI, N V, Si IV, and C IV resonance transitions and a host of weaker stellar photospheric lines. Most of the photospheric lines arise from highly excited states and their stellar origin is unambiguous. While resonance absorption lines may have an interstellar origin, the characteristic widths of the stellar wind profiles make them robust indicators of the presence of massive stars. Unfortunately, observations in this spectral regime are difficult. Only a handful of local type 2 Seyferts and LINERs have nuclear UV fluxes that are high enough to enable a spectroscopic investigation. While this small sample may not be representative, the available data firmly establish the presence of a dominant population of young stars (Heckman et al. 1997; González Delgado et al. 1998; Maoz et al. 1998; Colina & Arribas 1999).
While the optical spectral window is far more accessible, the available diagnostic features of massive stars are weaker and less easy to interpret. Old stars are cool and have many strong spectral features in the optical due to molecules and low-ionization metallic species. Hot young stars have relatively featureless optical spectra111The most direct optical signatures of young massive stars are the photospheric lines of He I and the broad emission features due to Wolf-Rayet stars. The former reach peak strength in early B stars and hence in stellar populations with ages of tens of Myr (González Delgado, Leitherer, & Heckman 1999). The latter trace the most massive stars and reach peak strengths for ages of several Myr (e.g., Leitherer et al. 1999). Both the He I and Wolf-Rayet features are weak and contaminated by nebular emission lines. They have been detected in only a handful of AGNs (Heckman et al. 1997; González Delgado et al. 1998; Storchi-Bergmann, Cid Fernandes, & Schmitt 1998).. Thus, the spectroscopic impact of the presence of young stars is mostly an indirect one: as they contribute an increasing fraction of the light (as the luminosity-weighted mean stellar age decreases) most of the strongest spectral features in the optical weaken. This effect is easy to measure. Unfortunately, the effect of adding “featureless” nonstellar continuum from an AGN and young starlight will be similar in this regard.
The strongest optical absorption lines from young stars are the Balmer lines. These reach peak strength in early A-type stars, and so they are most sensitive to a stellar population with an age of 100 Myr to 1 Gyr (e.g., González Delgado et al. 1998). Thus, the Balmer lines do not uniquely trace the youngest stellar population222In view of this, and in view of the importance of the Balmer lines, throughout this review I will use the term “young” to mean stellar populations with ages less than a Gyr.. On the plus side, they can be used to characterize past bursts of star formation (e.g., Dressler & Gunn 1983; Kauffmann et al. 2003a).
The situation is summarized in Figure 1.1, which plots the strength of the Balmer H absorption line (the H index) vs. the 4000 Å break strength [the index] for a set of 32,000 model galaxies with different star formation histories (see Kauffmann et al. 2003a). For “well-behaved” (continuous) histories of past star formation there is a tight inverse relation between these two parameters. The addition of a starburst moves the galaxy below and to the left of the main locus at early times ( 100 Myr) times and above it at intermediate times (100 Myr to 1 Gyr).
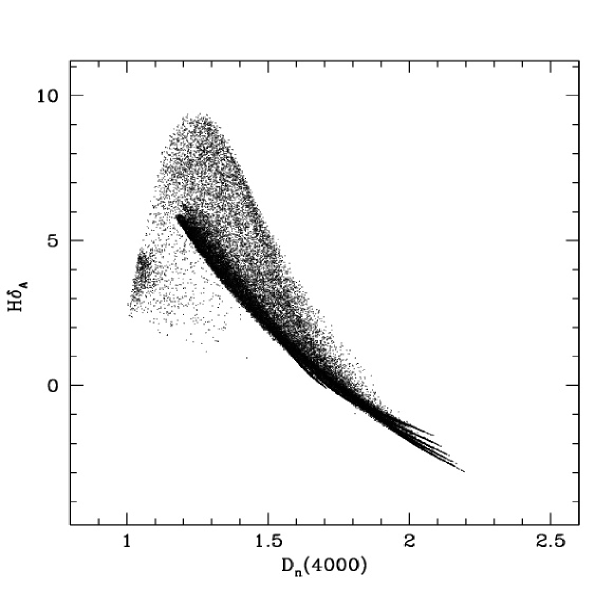
Note that the effect of adding featureless AGN continuum will carry an old stellar population located at roughly (2, 2) in Figure 1.1 to (1, 0). This “mixing line” lies well under the loci of the stellar populations [the latter having much stronger H at a given ]. This underscores the importance of the Balmer absorption lines, and of the need to properly account for the contaminating effects of nebular Balmer emission lines. The relative nebular contamination is minimized for the high-order Balmer lines in the blue and near-UV.
So far, I have equated young stars with hot stars. This is certainly true for main-sequence stars. However, a population of red supergiants will contribute significantly to the near-IR light in young stellar populations333For an instantaneous burst of star formation, red supergiants do not appear until 5 to 6 Myr have elapsed. Thus, they are absent only in very young bursts of very short duration.. The spectral features produced by red supergiants are qualitatively similar to those produced by red giants that dominate the near-IR light in an old stellar population. A robust method to determine whether old giants or young supergiants dominate is to measure the ratio in the near-IR using the stellar velocity dispersion. So far this technique has been applied to only a small sample, but the results are tantalizing (Oliva et al. 1999; Schinnerer et al. 2003).
In an old stellar population, cool stars provide most of the light in the optical and near-IR and so the associated metallic and molecular spectral features are strong in both bands. In contrast, the optical (near-IR) continuum in a young stellar population will be dominated by hot main-sequence stars (cool supergiants). The metallic/molecular lines are therefore weak in the optical and strong in the near-IR. This combination of properties provided some of the first direct evidence for a young stellar population in AGNs (Terlevich, Díaz, & Terlevich 1990; Nelson & Whittle 1999).
4 Emission-Line Diagnostics and AGN Classification
As noted above, I will be emphasizing optical spectroscopy in this review of the stellar populations in AGNs. Historically, this has also been the most widely used technique to detect and classify AGNs themselves.
AGNs can be broadly classified depending upon whether the central black hole and its associated continuum and broad emission-line region is viewed directly (a “type 1” AGN) or is obscured by a surrounding dusty medium (a “type 2” AGN). Since this obscuring medium does not fully cover 4 steradians as seen from the central AGN. some of the AGN radiation escapes the central region and photoionizes surrounding circumnuclear ( to pc-scale) gas, leading to strong, relatively narrow permitted and forbidden emission lines from the “narrow-line region” (NLR). In type 1 AGNs, the optical continuum is dominated by nonstellar emission, making it difficult to study the stellar population. In what follows, I will therefore ignore this type of AGN. In type 2 AGNs the observed optical continuum is predominantly starlight, with some contribution by light from the obscured AGN scattered into our line of sight and from nebular continuum associated with the NLR (e.g., Tran 1995; Wills et al. 2002).
In the simplest version of the “unified” model for AGNs (Antonucci 1993) the type 1 and type 2 AGNs are drawn from the same parent population and differ only in our viewing angle. In this case the stellar content of the two types will be the same. On the other hand, if the solid angle covered by the dusty obscuring medium varies substantially, then type 1 (2) AGNs will be preferentially drawn from those objects with smaller (larger) covering fractions for this medium. In such a case systematic differences might exist in stellar content between type 1 and type 2 AGNs (especially if the dusty obscurer is related to star formation). There have been recurring suggestions to this effect (e.g., Maiolino et al. 1995; Malkan, Gorjian, & Tam 1998; Oliva et al. 1999). It is important to keep this possible bias in mind.
Narrow emission lines can also be produced via photoionization by hot young stars. The most unambiguous discrimination between excitation of the NLR by young stars vs. an AGN is provided by lines due to species with ionization potentials greater than 54 eV (above the He II edge), since a young stellar population produces a negligible supply of such high-energy photons. Unfortunately, most such high-ionization lines are weak in the optical spectra of AGNs. In practice, classification is therefore usually based on the flux ratios of the strongest lines (Heckman 1980a,b; Baldwin, Phillips, & Terlevich 1981; Veilleux & Osterbrock 1987).
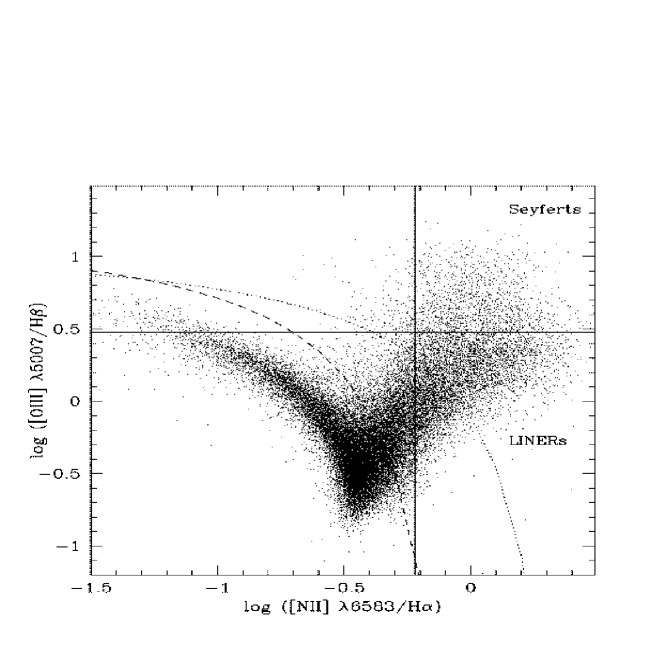
An example of such a classification diagram is shown in Figure 1.2, based on nearly 56,000 emission-line galaxies from the Sloan Digital Sky Survey (SDSS) sample discussed below. In this plot of the [O III] 5007/H vs. the [N II] 6583/H NLR line ratios, two distinct sequences are present. Star-forming galaxies define a narrow locus in which the metallicity increases from the upper left to the lower center. The plume that ascends from the high-metallicity end of the starformer sequence toward higher values of both [O III]/H and [N II]/H is the AGN population. In simple physical terms, the high-energy continuum of an AGN results in much greater photoelectric heating per ionization, which raises the temperature in the ionized gas, and therefore strengthens the collisionally excited forbidden lines that cool the gas.
It is important to realize that a contribution to the emission-line spectrum by regions of star formation is almost inevitable in many of the AGNs in Figure 1.2: at the median redshift of the SDSS main galaxy sample () the 3′′ diameter SDSS fiber corresponds to a projected size of nearly 6 kpc. Thus, a galaxy’s position along the AGN plume will be determined by the relative contribution of the AGN and star formation to the emission-line spectrum. This is particularly important in the context of this review because it means that the signature of young stars is present in the nebular emission lines as well as in the stellar absorption lines.
The AGN plume is quite broad at its upper end, where the AGN contribution is dominant. Traditionally, these AGN-dominated objects are classified as Seyferts if [O III]/H 3 and as low-ionization nuclear emission-line regions (LINERs) if [O III]/H 3 (e.g., Veilleux & Osterbrock 1987). The latter AGNs are more common, but do not attain the high luminosities of powerful Seyfert nuclei (e.g., Heckman 1980b; Ho, Filippenko, & Sargent 2003).
2 Young Stars in Active Galactic Nuclei
Spectroscopy of the nearest AGNs affords the opportunity to study the starburst-AGN connection on small physical scales ( a few pc). The drawback is that the nearest AGNs have low luminosities, and we might expect that the amount of star formation associated with black hole fueling would scale in some way with AGN power. To get a complete picture it is thus important to examine both the nearest AGNs and more powerful AGNs. I will review these two regimes in turn.
The earliest investigation of the stellar population for a moderately large sample of the nearest AGNs was by Heckman (1980a,b), who discussed 30 LINERs found in a survey of a sample of 90 optically bright galaxies. The typical projected radius of the spectroscopic aperture was 200 pc. The spectra covered the range from 3500 to 5300 Å. LINERs were primarily found in galaxies of early Hubble type (E through Sb). Based on the strengths of the stellar metallic lines and the high-order Balmer lines, the nuclear continuum was dominated by old stars in about 3/4 of the LINERs, while a contribution of younger stars was clearly present in the remainder. Typical luminosities of the [O III] 5007 and H NLR emission lines were to .
Ho et al. (2003) have recently examined the nuclear (typical radius pc) stellar population in a complete sample of 500 bright, nearby galaxies (of which 43% contain an AGN). In nearly all respects this is a major step forward from my old analysis. The sample is considerably larger, the quality of the spectra is superior, and the analysis of the emission-line properties more careful and more sophisticated. The larger sample size and improved treatment of the emission lines allow Ho et al. to study statistically significant samples of low-luminosity LINERs, type 2 Seyferts, and transition nuclei, and to span a larger range in AGN luminosity ( to ). The only disadvantage of these spectra is that they do not extend shortward of 4230 Å and so they miss the H and higher-order Balmer lines that most effectively probe young stars. Nevertheless, their results are qualitatively consistent with those of Heckman (1980a,b). The AGNs are hosted by early-type galaxies (E through Sbc). With a few exceptions, the AGNs have predominantly old stellar populations. The exceptions are primarily transition nuclei whose emission-line spectra suggest excitation by a mix of an AGN and massive stars.
My colleagues (Cid Fernandes, González Delgado, Schmitt, Storchi-Bergmann) and I have recently undertaken a program of near-UV spectroscopy of 43 LINER and transition nuclei taken from the Ho, Filippenko, & Sargent (1997) survey. Our specific goal was to access the high-order stellar Balmer absorption lines. We detect these lines in about half of the transition nuclei, but in very few LINERs. The cases in which hot stars are present are primarily Sb, Sbc, or Sc galaxies. These results are consistent with the idea that transition nuclei are composite AGN/starformers.
Let me now discuss significantly more powerful AGNs (classical type 2 Seyferts). It was recognized very early-on (e.g., Koski 1978) that the optical spectra of powerful type 2 Seyfert nuclei could not be explained purely by an old stellar population. An additional “featureless continuum” that typically produced 10% to 50% of the optical continuum was present. Until relatively recently, it was tacitly assumed that this component was light from the AGN (plausibly light from the hidden type 1 Seyfert nucleus that had been reflected into our line of sight by free electrons and/or dust). However, a detailed spectropolarimetric investigation by Tran (1995) and related arguments by Cid Fernandes & Terlevich (1995) and Heckman et al. (1995) showed that only a small fraction of this continuum could be attributed to scattered AGN light. While nebular continuum emission must be present (e.g., Tran 1995; Wills et al. 2002), Cid Fernandes & Terlevich (1995) and Heckman et al. (1995) argued that young stars were the main contributors.
This has been confirmed by several major optical spectroscopic investigations of moderately large samples of type 2 Seyfert nuclei (Schmitt, Storchi-Bergmann, & Cid Fernandes 1999; González Delgado, Heckman, & Leitherer 2001; Cid Fernandes et al. 2001b; Joguet et al. 2001). The latter two papers examined the nuclear stellar population in 35 and in 79 type 2 Seyferts, respectively. The projected aperture sizes range from a few hundred pc to about a kpc. On average, these are considerably more powerful AGNs than those in the Heckman (1980b) or Ho et al. (2003) samples, with [O III] luminosities of to .
The principal conclusion is that a young ( Gyr) stellar population is clearly present in about half of the Seyfert 2 nuclei. Cid Fernandes et al. (2001b) find that the fraction of nuclei with young stars is 60% when but is only 10% for the less powerful nuclei. They also found that the “young” Seyfert 2 nuclei were hosted by galaxies with much larger far-IR luminosities ( to ) than the “old” nuclei ( to ), suggesting that the global star formation rate was correspondingly higher (a topic considered in some detail below). Interestingly, Joguet et al. (2001) found that the Hubble type distribution for the host galaxies was roughly the same for the “old” and “young” nuclei (S0 to Sc). Using morphological classifications based on the Hubble Space Telescope imaging survey of (Malkan et al. 1998), Storchi-Bergmann et al. (2001) find a reasonably good correspondence between the presence of a young nuclear population and a late “inner Hubble type” (the presence of dust lanes and spiral features in the inner few kpc).
To date, spectroscopic investigations of the nuclear stellar populations in powerful radio-loud type 2 AGNs (the so-called “narrow-line radio galaxies”) have been restricted to relatively small samples (Schmitt, Storchi-Bergmann & Cid Fernandes 1999; Aretxaga et al. 2001b; Wills et al. 2002; Tadhunter et al. 2002). A young nuclear stellar population has been detected in about 1/3 of the cases.
3 Young Stars in AGN Host Galaxies
In the previous section I have reviewed spectroscopy of the stellar population in the nuclear region (the centralmost to pc). I now turn my attention to more global properties of AGN hosts.
Raimann et al. (2003) have recently used long-slit optical/near-UV spectroscopy to measure the radial variation in the stellar population for the sample of type 2 Seyfert galaxies whose nuclear properties were investigated by González Delgado et al. (2001). They characterize the stellar content by fitting each spectrum with a set of spectra of stellar clusters spanning a range in age and metal abundance.
They find that the Seyfert 2’s have younger mean ages than their comparison sample of normal galaxies at both nuclear and off-nuclear locations. The sample-averaged “vector” of the fractional contribution to the continuum at 4000 Å by stellar populations with ages of 10 Gyr, 1 Gyr, 30 Myr, and 3 Myr is (0.36, 0.25, 0.24, 0.15) at the nucleus, (0.36, 0.31, 0.20, 0.13) at 1 kpc, and (0.32, 0.30, 0.27, 0.11) at 3 kpc. Thus, the stellar population shows no strong systematic radial gradient in the hosts of powerful Seyfert 2 nuclei (at least out to radii of several kpc).
1 The Sloan Digital Sky Survey
So far, I have reported on spectroscopy of modest-sized samples of AGNs. The ongoing SDSS (York et al. 2000; Stoughton et al. 2002; Blanton et al. 2003; Pier et al. 2003) provides us with the opportunity to investigate the structure and stellar content of the hosts of tens of thousands of AGNs! In the remainder of the paper I will give a progress report on an on-going program in this vein that is a close collaboration between groups at JHU and MPA-Garching (Kauffmann et al., in preparation). The program was made possible by the inspiration and perspiration of the dedicated team that over the past 13 years has created and operated the SDSS.
The SDSS is using a dedicated 2.5-meter wide-field telescope at the Apache Point Observatory to conduct an imaging and spectroscopic survey of about a quarter of the sky. The imaging is conducted in the , , , , and bands (Fukugita et al. 1996; Gunn et al. 1998; Hogg et al. 2001; Smith et al. 2002), and spectra are obtained with a pair of multi-fiber spectrographs built by Alan Uomoto and his team at JHU. When the survey is complete, spectra will have been obtained for nearly 106 galaxies and 105 QSOs selected from the imaging data. Details on the spectroscopic target selection for the “main” galaxy sample and QSO sample can be found in Strauss et al. (2002) and Richards et al. (2002), respectively. We will be summarizing results based on spectra of 123,000 galaxies contained in the the SDSS Data Release One (DR1). These data are to be made publically available early in 2003.
Since I will primarily be discussing results derived from the spectra, it is useful to summarize their salient features. Spectra are obtained through 3′′ diameter fibers. At the median redshift of the main galaxy sample () this corresponds to a projected aperture size of 6 kpc which typically contains 20% to 40% of the total galaxy light. Thus, the SDSS spectra are closer to global than to nuclear spectra. At the median redshift the spectra cover the rest-frame wavelength range from 3500 to 8500 Å with a spectral resolution ( km s-1). The spectra are spectrophotometrically calibrated through observations of subdwarf F stars in each 3-degree field. By design, the spectra are well-suited to the determinations of the principal properties of the stars and ionized gas in galaxies.
2 Our Methodology
For the convenience of the reader we give a brief summary of our methodology below. For a much more complete description see Kauffmann et al. (2003a).
The rich stellar absorption-line spectrum of a typical SDSS galaxy is both a blessing and a curse. While the lines provide unique information about the stellar content and galaxy dynamics, they make the measurement of weak nebular emission lines quite difficult. To deal with this, we have performed a careful subtraction of the stellar absorption-line spectrum before measuring the nebular emission lines. This is accomplished by fitting the emission-line-free regions of the spectrum with a model galaxy spectrum. The model spectra are based on the new population synthesis code of Bruzual & Charlot (2003), which incorporates high-resolution stellar libraries. A set of 39 model template spectra were used that span the relevant range in age and metallicity. After convolving the template spectra to the measured stellar velocity dispersion () of an individual SDSS galaxy, the best fit to the galaxy spectrum is constructed from a linear combination of the template spectra.
As diagnostics of the stellar population we have used the amplitude of the 4000 Å break [the index of Balogh et al. 1999] and the strength of the H absorption line (the Lick H index of Worthey & Ottaviani 1997). The diagnostic power of these indices is shown in Figure 1.1 above. In both cases the indices measured in the SDSS galaxy spectra are corrected for the flux of the emission lines in their bandpasses.
Using a library of 32,000 star formation histories that span the relevant range in metallicity, we have used the measured and H indices to estimate the SDSS -band mass-to-light ratio for each galaxy. By comparing the colors of our best-fitting model to those of each galaxy, we have estimated the dust extinction of starlight in the -band (e.g., Calzetti, Kinney, & Storchi-Bergmann 1994; Charlot & Fall 2000).
The SDSS imaging data are then used to provide the basic structural parameters. The -band absolute magnitude and the derived values of and yield the stellar mass (). The half-light radius in the -band and the stellar mass yield the effective stellar surface mass density (). As a proxy for Hubble type we use the SDSS “concentration” parameter , which is defined as the ratio of the radii enclosing 90% and 50% of the galaxy light in the band (see Stoughton et al. 2002). Strateva et al. (2001) find that galaxies with 2.6 are mostly early-type galaxies, whereas spirals and irregulars have 2.0 2.6.
3 Results
As discussed in Kauffmann et al. (2003b - hereafter K03), the overall SDSS galaxy population is remarkably bimodal in nature. There is a rather abrupt transition in properties at a critical stellar mass . Below this mass, galaxies are young [small and large H], are disk dominated (low concentration, 2.6), and show a strong increase in surface mass density () with increasing mass. Above this mass, galaxies are old [large and small H], are bulge dominated ( 2.6), and have a uniform . There is also a strong transition in mean stellar age at a characteristic surface mass density of kpc-2 and a concentration index of 2.6.
Where do AGN hosts fit into this landscape? We find that AGNs are commonly present only in galaxies with large masses (), stellar velocity dispersions ( km s-1), and surface mass densities ()444Tremonti et al. (in preparation) find the SDSS galaxies obey a strong mass-metallicity relation. Since AGNs are hosted by massive galaxies, they have high metallicity. This explains why the “AGN plume” ascends from the region of metal-rich starformers in Figure 1.2.. Their stellar content and structure varies significantly as a function of AGN luminosity.
Before proceeding, a brief digression is necessary. Any attempt to characterize the stellar population in the AGN hosts with these spectra must, by necessity, include the transition objects that comprise the majority of the AGNs in Figure 1.2. Excluding these would bias the sample against host galaxies with significant amounts of on-going star formation. The only disadvantage of including the transition class is that it is then difficult (on the basis of the emission-line ratios alone) to classify them as Seyferts with star formation or LINERs with star formation.
It has long been known that LINERs do not attain the high luminosities of powerful Seyfert nuclei (e.g., Heckman 1980b; Ho et al. 2003)555In the SDSS sample, the luminosity of the [O III] 5007 emission line (the strong line from the NLR that is least contaminated by a contribution from galactic H II regions) is larger in type 2 Seyferts than in LINERs by an average factor of about 30 to 100 for galaxies with the same stellar mass or velocity dispersion. If we assume that AGNs hosts obey the (in)famous relation between black hole mass and stellar velocity dispersion, this would imply that on average LINERs are AGNs operating in a mode with a much lower than Seyfert nuclei. The same trend is seen by Ho (2002, 2003) in nearby galaxies. Thus, rather than classifying AGNs according to their line ratios, it makes more sense to examine how the properties of AGN hosts vary as a function of AGN luminosity (using the [O III] 5007 line as a measure). This allows us to include the transition class AGNs and thus mitigate the selection effects described above. For reference, the change-over from a LINER-dominated to Seyfert-dominated population occurs at an extinction-corrected value of in the SDSS sample.

We find that the stellar content of the AGN hosts is a strong function of (Fig. 1.3). This figure shows that the galaxy population as a whole is strongly bimodal (young, low mass, and low density, or old, high mass, and high density). What is very striking is that while the weak AGNs roughly follow the same trend as the normal massive galaxies, the powerful AGNs do not. The powerful AGNs are hosted by galaxies that are massive and dense, but relatively young.
Could the relatively small value for the index be caused by featureless AGN continuum rather than young stars? Decisive evidence against this is provided by the Balmer absorption lines, which are strong in the hosts of powerful AGNs. This is illustrated in Figure 1.4 which compares a high signal-to-noise ratio composite spectrum of several hundred of the most powerful AGNs () to a similar composite spectrum of normal high-mass, star-forming galaxies. More generally, nearly all the powerful AGNs in our sample lie on or above the locus of the continuous models of star formation in Figure 1.1. They have strong Balmer absorption lines as well as a relatively small index, so the latter is not due to dilution by AGN light.

K03 found that the fraction of galaxies that have undergone a major burst of star formation within the past Gyr declines strongly with increasing galaxy mass. The fraction of all SDSS galaxies that have experienced a major burst (at better than the 97.5% confidence level) is only about 0.1% to 0.3% over the range in appropriate for typical AGN hosts. In contrast, the fraction of “high-confidence” bursts in the AGN hosts rises with increasing AGN luminosity, from 1% at the lowest luminosities to nearly 10% at the highest.
Thus, it appears that powerful type 2 AGNs (Seyferts) reside in galaxies that have a combination of properties that are rare in the galaxy population as a whole: they are massive (and dense) but have relatively young stellar populations. This may have a very simple explanation. The two necessary ingredients for a powerful AGN are a massive black hole and an abundant fuel supply. Only massive galaxies contain massive black holes, and only galaxies with significant amounts of recent/ongoing star formation have the requisite fuel supply (ISM). This combination is rare today. The most massive black holes live mostly in the barren environment of a massive early-type galaxy. This was evidently not the case during the AGN era.
The rarity of galaxies having this combination of properties today implies that we may be witnessing a transient event. This would be consistent with the relatively large fraction of the hosts of powerful AGNs that have undergone a major starburst within the last Gyr (a rough galaxy merger time scale).
The above picture is appealingly simple. However, one possible “fly in the ointment” is the recent result that the hosts of powerful low-redshift QSOs are very massive but otherwise normal elliptical galaxies (Dunlop et al. 2003). If the stellar population of the QSO hosts is in fact old, then our results on the hosts of powerful Seyfert 2s could mean that the standard unified scenario for AGNs is seriously incomplete at high luminosities.
4 Summary
I have reviewed our understanding of the connection between star formation and the AGN phenomenon, emphasizing large surveys that have used direct spectroscopic diagnostics to search for young ( Gyr) stars in AGNs and in their host galaxies in the local Universe. I have considered only those objects in which the blinding glare of the central AGN is obscured from our direct view, so that the optical continuum is dominated by starlight. For these “type 2” AGNs I have used the luminosity of the narrow-line region as an indicator of AGN power.
The major conclusions are as follows:
Galactic Nuclei ( to pc): The majority of galaxies of early/middle Hubble type contain AGNs, usually of low luminosity. In most cases, the nuclear stellar population in low-power AGNs is predominantly old. In contrast, a young stellar population is detected in about half of the powerful type 2 Seyfert nuclei.
Host Galaxies ( pc): The host galaxies of AGNs have large stellar masses and surface mass densities. Normal galaxies like this have predominantly old stellar populations. While the stellar content of the hosts of low-power AGNs appears normal, the hosts of powerful AGNs have young stellar populations. A significant fraction of these young hosts have undergone major starbursts in the last Gyr.
The observational evidence for a connection between star formation and black hole fueling is thus clearer in powerful AGNs. This is true both in the nucleus itself and in its host galaxy. Such a dependence is astrophysically plausible, and is qualitatively consistent with the processes that established the correlation between black hole and stellar mass in galaxy bulges.
The most natural explanation for why powerful AGNs are hosted by massive
galaxies with young stellar populations is that a powerful AGN requires both
a high mass black hole (massive host galaxy) and an abundant fuel supply (a
star-forming ISM). While this combination is rare today, it would have been
much more common during the AGN era at high redshift.
I would like to thank Carnegie Observatories, in particular Luis Ho, for organizing and hosting such a successful meeting. I would also like to thank all my collaborators on the work reported in this paper, with a special thanks to Guinevere Kauffmann who is leading the SDSS project on AGN hosts.
Funding for the creation and distribution of the SDSS Archive has been provided by the Alfred P. Sloan Foundation, the Participating Institutions, the National Aeronautics and Space Administration, the National Science Foundation, the U.S. Department of Energy, the Japanese Monbukagakusho, and the Max Planck Society. The SDSS Web site is http://www.sdss.org/.
The SDSS is managed by the Astrophysical Research Consortium (ARC) for the Participating Institutions. The Participating Institutions are The University of Chicago, Fermilab, the Institute for Advanced Study, the Japan Participation Group, The Johns Hopkins University, Los Alamos National Laboratory, the Max-Planck-Institute for Astronomy (MPIA), the Max-Planck-Institute for Astrophysics (MPA), New Mexico State University, University of Pittsburgh, Princeton University, the United States Naval Observatory, and the University of Washington.
References
- [1] Antonucci, R. R. J. 1993, ARA&A, 31, 473
- [2] Aretxaga, I., Kunth, D., & Mujica, R. 2001a, Advanced Lectures on the Starburst-AGN Connection (Singapore: World Scientific)
- [3] Aretxaga, I., Terlevich, E., Terlevich, R. J., Cotter, G., & Díaz, A. I. 2001b, MNRAS, 325, 636
- [4] Baldwin, J. A., Phillips, M. M., & Terlevich, R. 1981, PASP, 93, 5
- [5] Balogh, M. L., Morris, S. L., Yee, H. K. C., Carlberg, R. G., & Ellingson, E. 1999, ApJ, 527, 54
- [6] Blanton, M. R., Lupton, R. H., Maley, F. M., Young, N., Zehavi, I., & Loveday, J. 2003, AJ, in press
- [7] Bruzual A., G., & Charlot, S. 2003, MNRAS, submitted
- [8] Calzetti, D., Kinney, A. L., & Storchi-Bergmann, T. 1994, ApJ, 429, 582
- [9] Charlot, S., & Fall, S. M. 2000, ApJ, 539, 718
- [10] Cid Fernandes, R., Jr., Heckman, T. M., Schmitt, H. R., Golzález Delgado, R. M., & Storchi-Bergmann, T. 2001b, ApJ, 558, 81
- [11] Cid Fernandes, R., Jr., Schmitt, H. R., & Storchi-Bergmann, T. 2001a, RMxAC, 11, 133
- [12] Cid Fernandes, R., Jr., & Terlevich, R. 1995, MNRAS, 272, 423
- [13] Colina, L., & Arribas, S. 1999, ApJ, 514, 637
- [14] de Mello, D., Leitherer, C., & Heckman, T. M. 2000, ApJ, 530, 251
- [15] Dressler, A., & Gunn, J. E. 1983, ApJ, 270, 7
- [16] Dunlop, J. S., McLure, R. J., Kukula, M. J., Baum, S. A., O’Dea, C. P., & Hughes, D. H. 2003, MNRAS, in press (astro-ph/0108397)
- [17] Fan, X., et al. 2001, AJ, 121, 54
- [18] Ferrarese, L., & Merritt, D. 2000, ApJ, 539, L9
- [19] Filippenko, A. V. 1992, ed., Relationships between Active Galactic Nuclei and Starburst Galaxies (San Francisco: ASP)
- [20] Fukugita, M., Ichikawa, T., Gunn, J. E., Doi, M., Shimasaku, K., & Schneider, D. P. 1996, AJ, 111, 1748
- [21] Gebhardt, K., et al. 2000, ApJ, 539, L13
- [22] González Delgado, R. M., Heckman, T., & Leitherer, C. 2001, ApJ, 546, 845
- [23] González Delgado, R. M., Heckman, T., Leitherer, C., Meurer, C., Krolik, J. H., Wilson, A. S., Kinney, A. L., & Koratkar, A. P. 1998, ApJ, 505, 174
- [24] González Delgado, R. M., Leitherer, C., & Heckman, T. 1999, ApJS, 125, 489
- [25] Gunn, J. E., et al. 1998, AJ, 116, 3040
- [26] Haehnelt, M., & Kauffmann, G. 2000, MNRAS, 318, L35
- [27] Heckman, T. M. 1980a, A&A, 87, 142
- [28] ——. 1980b, A&A, 87, 152
- [29] ——. 1991, in Massive Stars in Starbursts, ed. C. Leitherer et al. (Cambridge: Cambridge Univ. Press), 289
- [30] Heckman, T. M., et al. 1995, ApJ, 452, 549
- [31] Heckman, T. M., González Delgado, R. M., Leitherer, C., Meurer, G. R., Krolik, J., Wilson, A. S., Koratkar, A>, & Kinney, A. 1997, ApJ, 482, 114
- [32] Ho, L. C. 2002, in Issues in Unification of AGNs, ed. R. Maiolino, A. Marconi, & N. Nagar (San Francisco: ASP), 165
- [33] ——. 2003, in Carnegie Observatories Astrophysics Series, Vol. 1: Coevolution of Black Holes and Galaxies, ed. L. C. Ho (Cambridge: Cambridge Univ. Press), in press
- [34] Ho, L. C., Filippenko, A. V., & Sargent, W. L. W. 1997, ApJS, 112, 315
- [35] ——. 2003, ApJ, 583, 159
- [36] Hogg, D. W., Finkbeiner, D. P., Schlegel, D. J., & Gunn, J. E. 2001, AJ, 122, 2129
- [37] Joguet, B., Kunth, D., Melnick, J., Terlevich, R., & Terlevich, E. 2001, A&A, 380, 19
- [38] Kauffmann, G., et al. 2003a, MNRAS, in press (astro-ph/0204055)
- [39] ——. 2003b, MNRAS, in press (astro-ph/0205070) (K03)
- [40] Kauffmann, G., & Haehnelt, M. 2000, 311, 576
- [41] Kewley, L. J., Dopita, M. A., Sutherland, R. S., Heisler, C. A., & Trevena, J. 2001, ApJ, 556, 121
- [42] Koski, A. T. 1978, ApJ, 223, 56
- [43] Leitherer, C., et al. 1999, ApJS, 123, 3
- [44] Maiolino, R., Ruiz, M., Rieke, G. H., & Keller, L. D. 1995, ApJ, 446, 561
- [45] Malkan, M. A., Gorjian, V., & Tam, R. 1998, ApJS, 117, 25
- [46] Maoz, D., Koratkar, A. P., Shields, J. C., Ho, L. C., Filippenko, A. V., & Sternberg, A. 1998, AJ, 116, 55
- [47] Nelson, C. H., & Whittle, M. 1999, AdSpR, 23, 891
- [48] Oliva, E., Origlia, L., Maiolino, R., & Moorwood, A. F. M. 1999, A&A, 350, 9
- [49] Pier, J. R., Munn, J. A., Hindsley, R. B., Hennessy, G. S., Kent, S. M., Lupton, R. H., & Ivezić, Z. 2003, AJ, 125, 1559
- [50] Raimann, D., Storchi-Bergmann, T., Gonzalez Delgado, R. M., Cid Fernandes, R., Heckman, T., Leitherer, C., & Schmitt, H. 2003, MNRAS, 339, 772
- [51] Richards, G. T., et al. 2002, AJ, 123, 2945
- [52] Schinnerer, E., Colbert, E., Armus, L., Scoville, N. Z., & Heckman, T. M. 2003, in Coevolution of Black Holes and Galaxies, ed. L. C. Ho (Pasadena: Carnegie Observatories, http://www.ociw.edu/ociw/symposia/series/symposium1/proceedings.html
- [53] Schmitt, H. R., Storchi-Bergmann, T., & Cid Fernandes, R. 1999, MNRAS, 303, 173
- [54] Smith, J. A., et al. 2002, AJ, 123, 2121
- [55] Steidel, C. C., Adelberger, K. L., Giavalisco, M., Dickinson, M., & Pettini, M. 1999, ApJ, 519, 1
- [56] Storchi-Bergmann, T., Cid Fernandes, R., & Schmitt, H. R. 1998, ApJ, 501, 94
- [57] Storchi-Bergmann, T., González Delgado, R. M., Schmitt, H. R., Cid Fernandes, R., & Heckman, T. 2001, ApJ, 559, 147
- [58] Stoughton, C., et al. 2002, AJ, 123, 485 (erratum: 123, 3487)
- [59] Strateva, I., et al. 2001, AJ, 122, 1104
- [60] Strauss, M., et al. 2002, AJ, 124, 1810
- [61] Tadhunter, C. N., Dickinson, R., Morganti, R., Robinson, T. G., Villar-Martin, M., & Hughes, M. 2002, MNRAS, 330, 977
- [62] Terlevich, E., Díaz, A. I., & Terlevich, R. 1990, MNRAS, 242, 271
- [63] Terlevich, R. 1989, in Evolutionary Phenomena in Galaxies, ed. J. Beckman, & B. Pagel (Cambridge: Cambridge Univ. Press), 149
- [64] Terlevich, R. & Melnick, J. 1985, MNRAS, 213, 841
- [65] Tran, H. 1995, ApJ, 440, 597
- [66] Veilleux, S. 2001, in Starburst Galaxies: Near and Far, ed. L. Tacconi & D. Lutz (Heidelberg: Springer-Verlag), 88
- [67] Veilleux, S., & Osterbrock, D. E. 1987, ApJS, 63, 295
- [68] Wills, K. A., Tadhunter, C. N., Robinson, T. G., & Morganti, R. 2002, MNRAS, 333, 211
- [69] Worthey, G., & Ottaviani, D. L. 1997, ApJS, 111, 377
- [70] York, D. G., et al. 2000, AJ, 120, 1579